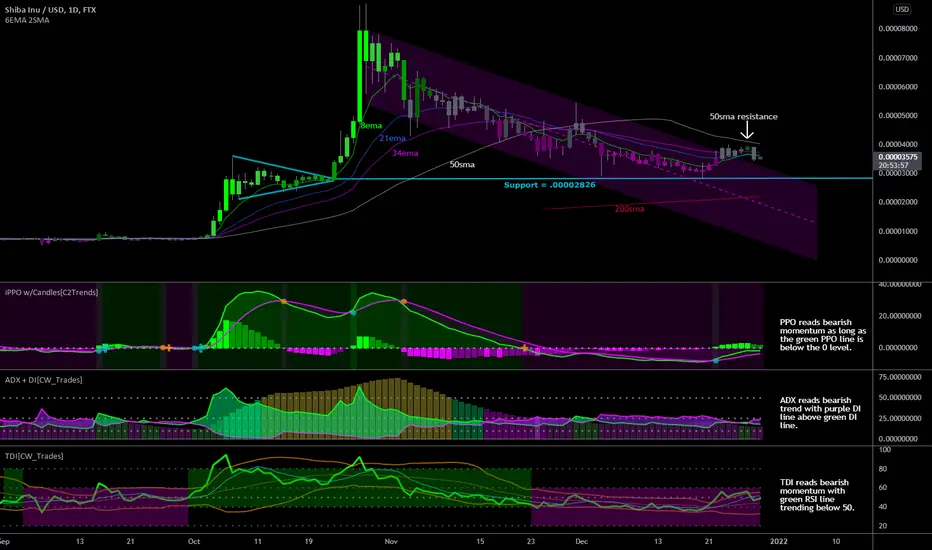
SHIBUSD 50sma ResistanceShiba Inu has failed to move above the 50sma after finding resistance at that level for the past week. Price risks falling back into the downtrend channel with a possible re-test of local lows near $0.00002826 which is roughly -18% from the current price of $0.00003560. Lower indicators are all showing bearish trend and momentum behind price in the short and intermediate-term. Should Bitcoin continue to show weakness, expect the rest of the altcoin market to follow suit.
ADX
Bitcoin Re-Testing 200sma SupportBitcoin has fallen back below the $50k level after price failed to advance above the purple 34ema for 5 consecutive days. Price is now testing the red 200sma again while also falling back into the purple downtrend channel. First level of support to watch for is near $40k(yellow), secondary support comes in near $30k(yellow). Lower indicators all pointing to more downside ahead for price in the short and medium-term.

PGJO ADX Cross up (area 20-30); +DM>-DM; Sto14 %K>$%D (Bullish)ADX Cross up (area 20-30); +DM>-DM; Sto14 %K>$%D (Bullish)

SPY Bearish Divergences w/ Potential Triple Top$SPY S&P500 ETF. SPY is currently hesitating near all-time highs which has led to a potential bearish triple top formation(upper red arrows) on the daily chart. As price has stayed relatively the same since early November, the lower indicators have all been declining(lower red arrows) which has created a bearish divergence. The lower indicators all show that the internals behind the recent rally in price from October to November have weakened, but have not flipped bearish yet.
The PPO indicator shows the green PPO line trending below the purple signal line. This indicates a short-term loss of upward momentum in price. This indicator isn’t considered bearish until both the green and purple lines are below the 0 level. What we would need to see going forward in order for price to continue moving higher is for the green line to cross back above the purple and for both to continue moving higher.
The ADX indicator shows the green DI and purple DI lines overlapping which means that the short-term trend in price has flatlined. When the green line is above the purple line the short-term trend in price is up, and when the purple line is above the green line the short-term trend is down. The histogram behind the DI lines is declining which indicates weakening trend strength. What we want to see here is for the green DI line to cross back above the purple DI line, and then for the histogram to begin rising which would indicate a short-term bull trend with increasing strength.
The TDI indicator shows the green RSI line rolling over after finding resistance at the horizontal 60 level and the middle of the RSI Bollinger Bands. The intermediate momentum behind price can be considered bullish based on the fact that the RSI is above the horizontal 50 level and so is the center of the BBands. When both are below the 50 level the short and intermediate momentum in price can be considered bearish. What we want to see in this indicator is for the green RSI line to cross above the center of the BBands and then rise above the 60 level to give us a strong indication that the short-term and intermediate-term momentum behind price is bullish.
Worth noting is that as price rose this week, volume declined. This indicates that less traders were in the market moving price back up to test the all-time high near $470 after the previous double top.
Should price continue to hesitate and rollover over from here, local lows can be looked at for potential levels of support. The two most recent local lows to watch are at $450 and $425, those were the last two levels of demand prior to new all-time highs being made. If the market is still mostly bullish, those two levels will hold, with $425 being the critical level.
#sp500 #spy #spx #stocks #equities #trading #investing #chart #analysis #technical #indicators #candlestickchart #pricepercentoscillator #ppo #averagedirectionalindex #adx #tdi #tradersdynamicindex #rsi #relativestrengthindex #trend #momentum #tradingview #price #etf #divergence #bearish #bearishdivergence

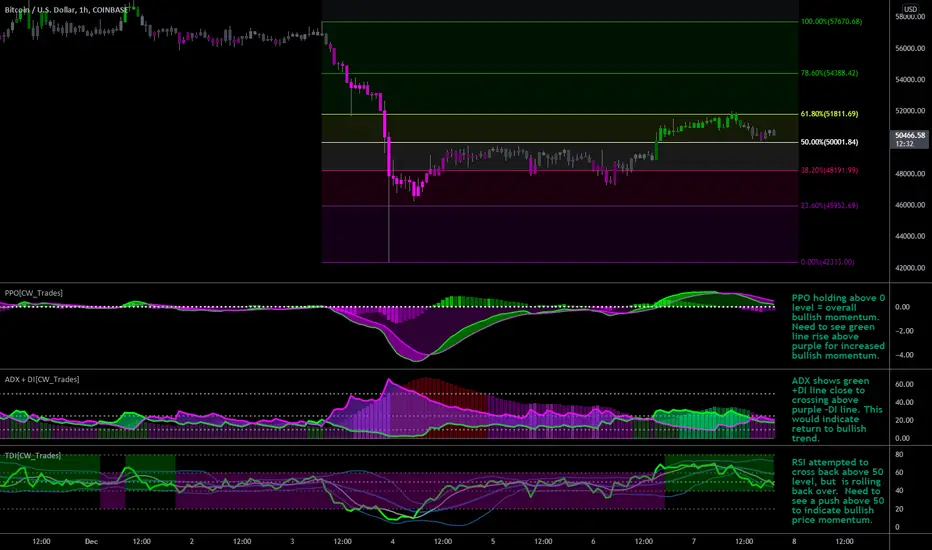
Bitcoin 1/hr Fib ConsolidationBitcoin 1/hr chart shows price trending between the 50% and 61.8% Fibonacci retracement levels in a tight $1,800 range. The fib levels are drawn from the recent peak at $57,670(100%) and $42,333(0%). What we’re looking for here is a price move above the 61.8% fib level at $51,811 if we want to see continue gains. Should price fail to hold support at the 50% fib level at $50,000, then we can start to look at possible points of support at the 38.2%, 23.6% and 0% fib levels. Price would technically still be in an uptrend, albeit under a period of consolidation, as long as the $40k level isn’t breached. Should price fall below $40k the trend would flip from a period of consolidation to a new bear trend.
Lower indicators are looking favorable for bulls as they stand. The PPO indicator is showing both the green PPO line and purple signal line above the 0 level. In order for the uptrend in price to continue we need to see the green line cross back above the purple line and for both lines to move higher. That would indicate healthy bullish momentum behind price.
The ADX indicator shows the purple DI line above the green DI line which indicates a bearish trend behind price. The lines appear to be on the verge of another crossover though which would put the green line back above the purple line and indicate that there is a positive trend behind price.
The TDI indicator shows the green RSI line trending in the lower half of the purple BBands which indicates a negative trend for price in the short-term. The RSI line also recently attempted to cross above the 50 level, but rolled back over. Bitcoin needs to see an RSI reading above 50, and preferably 60, in order for momentum to be considered bullish.
Overall, neutral on price until the more risk-tolerant traders move it one direction or another. Above the 61.8% fib at $52k and bulls will be in charge, below the 50% fib at $50k and bears will have the upper hand on price movement.
Bitcoin Holding 50% Fib Level After a large drop over the weekend Bitcoin is holding above the 50% Fibonacci retracement level which is drawn from the July 20 low near $29,500(100% Fib) to the Nov 10 high at $69,000(0% Fib). This level is acting as decent support for now, but we have yet to see any eager buyers of size step in and push price back up into the blue uptrend channel, and above the 38% Fib level which is where price needs to be if we want to see the uptrend in Bitcoin continue-and by proxy the rest of the cryptosphere. For now the lower blue line of the uptrend channel and 39.2% Fib level can be considered overhead resistance levels for price in the short-term.
Should bulls be unable to push price higher from here and the 50% Fib level fails as support, we’re looking at a potential move back down near the yellow 61.8% Fib level to re-test the weekend lows. Just below there I’ve drawn a teal line near $40,000 that stems from local lows made back in September. That was the last area of strong demand prior to the dip this past weekend, and price held above it on this most recent dip. For now we can consider that area of support to still be valid.
Price will technically remain in an uptrend unless/until the $40k level is taken out as price stands right now. Should price fall below $40k bears will most likely take it all the way back down to test the summer lows near $29k as there are likely a lot of newly leveraged bulls in the market right now.
Currently neutral on price due to the magnitude of the weekend drop and lack of follow-through after the jump back up to $50k. Lower chart indicators are all showing negative trend and momentum for price which isn't helping the bullish case right now. Will turn bullish again if price can move back into the blue uptrend channel and above the 38.2% Fib level.

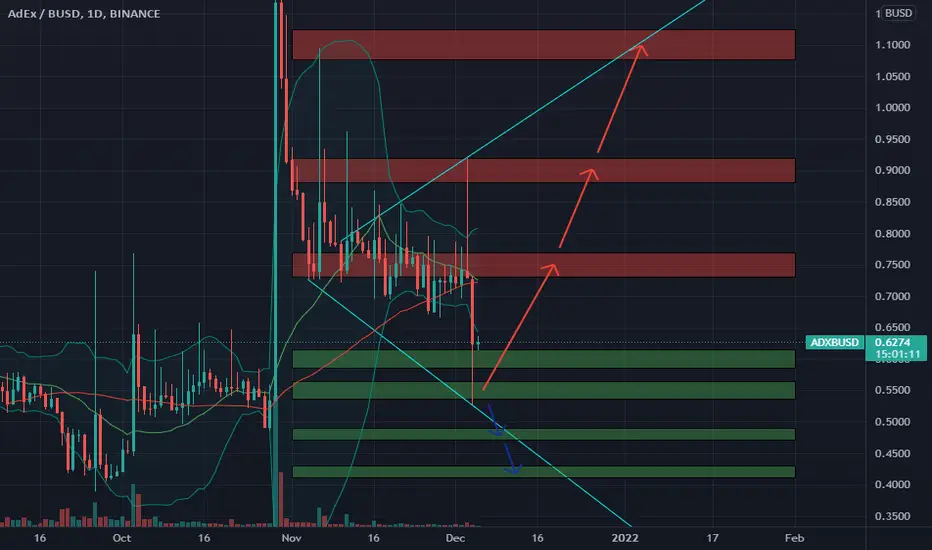
🆓Ambire AdEx (ADX) Dec-5 #ADX $ADX
.
📈RED PLAN
♻️Condition : If 1-Day closes ABOVE 0.55$ zone
🔴Buy : 0.6 - 0.55
🔴Sell : 0.75 - 0.9 - 1.1
📉BLUE PLAN
♻️Condition : If 1-Day closes BELOW 0.55$ zone
🔵Sell : 0.55
🔵Buy : 0.48 - 0.42
❓Details
🚫Stoploss for Long : 10%
🚫Stoploss for Short : 5%
📈Red Arrow : Main Direction as RED PLAN
📉Blue Arrow : Back-Up Direction as BLUE PLAN
🟩Green zone : Support zone as BUY section
🟥Red zone : Resistance zone as SELL section

ADA Primed for Another Bullish Runw Crypto Traders,
Appreciate you taking the time to view my analysis which I hope you may find beneficial. Please be sure to “LIKE” if you indeed find my analysis useful and/or find my analysis intriguing.
Cheers & Happy Trading!
-----------------------------------------------------------------------------------------------------------------------------------------------------------
Analysis:
ADA forming bottom structure. Multiple RSI support validations in the same region, in conjunction w/ the most recent RSI down trend making a higher low.
Volume is setting up for an inverses head and shoulders type of structure. Volume spike over the overhang diagonal resistance line would be a solid entry signal.
VWAP RS flip @ buy trigger. These events should happen concurrently with -DI trending down, as it appears to have hit a local top, signaling a quality bottom structure.

FLWS Range BreakoutFLWS has been range trading since the earnings reported in April. We experienced one false breakout back in early June, but it was quickly thrown back into the range. Disregarding the intra-day break in September, we are in the middle of a second breakout attempt, which started with the October earnings. This break experienced a brief throwback before continuing on the bullish trend. A throwback tends to forewarn a weaker breakout.
Looking at RSI and ADX, we see bullish trends in both. There is a lack of volume accompanying this break. Breakouts can be valid without an accompanying increase in volume.
Fundamentally, FLWS tends to have its bests sales and revenues in the 4th quarter. This breakout coincides with the start of the 4th quarter. Optimistically this bullish trend could last into the holiday season.
Looking at the factors of the trade, I believe a half position and tighter stop are warranted.
4hr and Weekly charts provided for perspective

AdxUsdt#1234567890
#Abcdefghijklmnobqrstuvwxyz
I think It will fly soon
Not advice to buy or sell
just expectation

$IOST - Bullish Pinbar formed in Daily. Entering LONG#IOST has formed one of the most beautiful chart formations for me, consisting of a Daily pinbar in a strong support zone plus the MACD forming a twist in its MA’s, indicating a strong exchange in market direction.
ADX is super strong also, indicating the strong power of the current trend.
Placing Long positions from right here.
**WILL BE UPDATING**

Adx UsdtYou can give a chance with a close stop loss and a close buy order.
New currency. Therefore risk must be taken into account.
Note: This is not an investment advice.
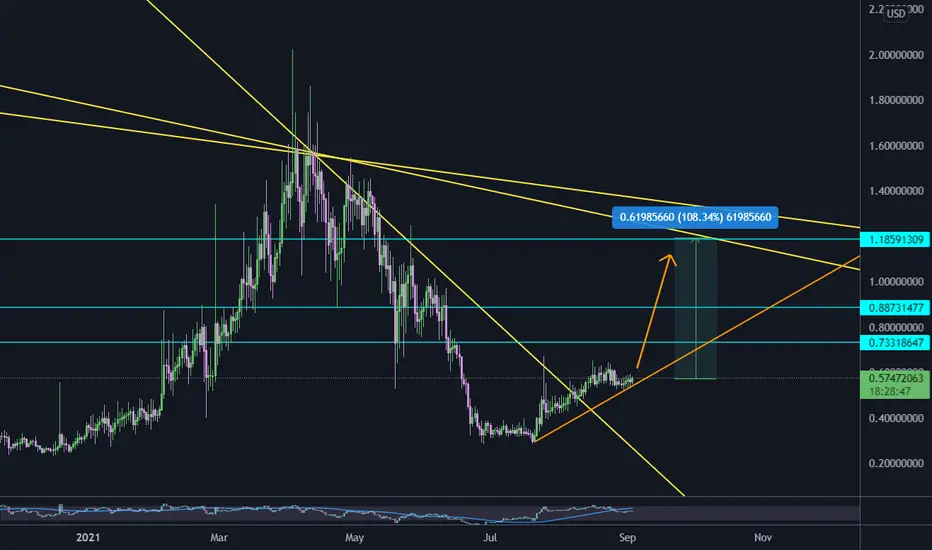
LINK longEnglish:
$LINK remains above the EMA (55, Close) but without clearly exceeding the bearish trend line.
The Momentum has upward directionality but with an ADX below level 23, beyond that level the ADX would be confirming an upward trend that could take the price to the previous maximum, obtaining a 68% increase approximately.
I would say that this is an ideal scenario because we can see that it is in the low zone of a bullish channel.
$LINK se mantiene por encima de la EMA (55, cierre) pero sin superar claramente la línea de tendencia bajista.
El Momentum tiene direccionalidad alcista pero con un ADX por debajo del nivel 23, al superar ese nivel el ADX estaría confirmando una tendencia alcista que podría llevar el precio al máximo anterior, obteniendo un aumento del 68% aproximadamente.
Yo diría que este es un escenario ideal porque podemos ver que está en la zona baja de un canal alcista.

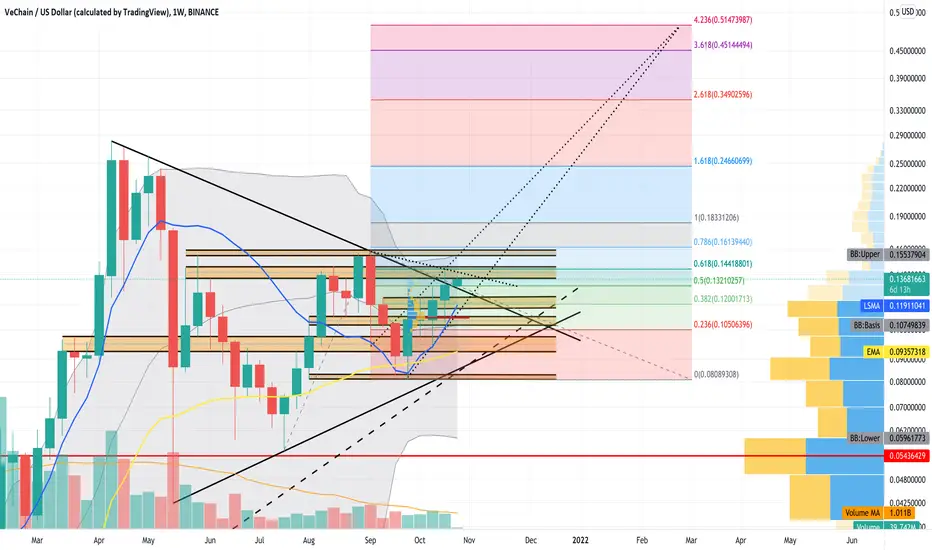
VET - weekly chart analysisVET has broken back ABOVE its massive Symmetrical Triangle and has so far successfully tested it as support on this 1w timeframe. VET needs to 110% CLOSE this weekly candle ABOVE the Descending Trend-line of the Symmetrical Triangle.
Note that VET is still safely above its Longterm Upwards Trend-line (Ascending Dashed Line) on this 1w timeframe.
VET is still above its Bollinger Bands Middle Band Basis 20 Period SMA for this 1d timeframe. Note that VET has room to move up before hitting the Bollinger Bands Upper Band on this 1w timeframe.
VET is still above its Least Squares Moving Average (LSMA) for this 1w timeframe. For this indicator, ABOVE the LSMA is a potential ‘BUY’ and BELOW the LSMA is a potential “SELL’.
Note that VET is still above its Volume Profile Fixed Range POC for the fixed range of 5 weekly candle that i have selected.
Note that Volume has increased slightly but note that the Volume Bars are still Below its Volume 20 Period MA.
I have added various support and resistance areas on this chart and you can clearly see the interaction with theses area. Note that VET has found some resistance from its first resistance line.
The Average Directional Index (ADX DI) is indicating that the trend strength is sideways but strong with the ADX (Orange Line) at 22.69. Note that the 9 Period EMA is above the ADX at 25.38 but is dropping. The +DI (Green Line) has dropped slightly to 21.79 but the -DI (Red Line) has also dropped slightly to 14.34. This indicates both positive and negative momentum has dropped slightly. We will potentially see a massive move upwards if the ADX (Orange Line) crosses back above the 9 Period EMA (Black Line) if the +DI (Green Line) is still above and moving away from the -DI (Red Line) on this 1w timeframe.
The OnBalanceVolume (OBV) is indicating momentum is sideways within a range. Note that the OBV (Blue Line) has crossed back above the 9 Period EMA (Orange Line) indicating upwards strength on this 1w timeframe.
The Moving Average Convergence Divergence (MACD) is indicating that we have had the MACD Line (Blue Line) cross back ABOVE the Signal Line (Orange Line) on this 1w timeframe. Note that the MACD is still in the Positive Zone above the 0.0 Base Line and note that we have had our first proper Green Histogram for the first time in 7 weeks.
I have also added a Trend-Based Fib Extension to show some potential FIB levels if VET continues the upwards trajectory on this 1w timeframe.
VET is also in a very thin Rising Wedge Pattern. VET needs to invalidate this bearish pattern by breaking back above it and successfully testing it as support on this 1w timeframe. What is interesting is that the Rising Wedge takes us right up to the 4.236 Fib Level at $0.5147. This is something to keep an eye on on this 1w chart.
Note that this chart is looking at the longterm without taking into account what is happening on lower timeframes, which you should be watching & analysing as well. All in all, VeChain is looking great so it should be an interesting couple of weeks for VET providing BTC behaves herself.
I hope this is helpful with your trading and hodl-ing.
Notes:
Bollinger Bands = Grey Bands on chart
LSMA = Blue squiggly line on chart
VPFR POC = Short horizontal red line on chart
VPVR POC = Long horizontal red line on chart
50EMA = Yellow squiggly line on chart
Symmetrical Triangle = Converging ascending and descending black lines
Rising Wedge = Ascending converging dotted lines
Longterm upwards Trend-line = Ascending dashed black line.
Support and resistance areas = Horizontal black lines with yellow shading
LSK (LISK) lateralizingLSK has a very ugly long-term chart.
On the daily, it looks like it's in a "Shoulder-Head-Shoulder" pattern, however the Stochastic, RSI and ADX indicators indicate a sideways move with a possible rally.
If the BTC rises it can only follow later.
However, now is not the best time to position yourself on altcoins.
I would particularly be left out.
The risk return would be approximately 1 to 1, which should be reflected if it is really worth it.
"Not to act is also to act. Sometimes the best thing is to do nothing."

Bitcoin Three Day Directional Index just got bearishFresh off the presses from the 3 day close. The current top and the top of early 2021 have a lot of similarities. Key for this idea are the bearish rising wedges which are confirmed by falling volume as the pattern continues. If this is going to keep going with the similarities we are going to see the red volume really begin to pick up now that the DI+ has crossed under the DI-. There is always a chance that this DI cross will not be maintained but that remains to be seen. I have not shown the ADX because with price in a consolidation/reverersl pattern the ADX is low. I am looking to use this DI+/- cross in conjunction with the chart pattern and volume to predict an increase in the ADX.
Linked ideas show broader bearishness in crypto.

BTC will touch 40k before continuing to riseBTC will touch 40k before continuing to rise
It still brings downward force, the Squeeze Momentum and the ADX confirm it, we must wait for the Squeeze to form a red valley and for the ADX to change directionality.
I estimate this will be between 38k and 40k.

ADX adex Please see chart for details.
This one is based off of a cup and handle pattern on the weekly.
Nice 400 plus %.
Enjoy!

ADX potential to increase more than 100%#ADXUSD
$ADX broke out from long term descending resistance and it is still above ascending support line, next resistance is more than 100% up from here,
buy now ♨️
targets in chart 🧘🏻♀️
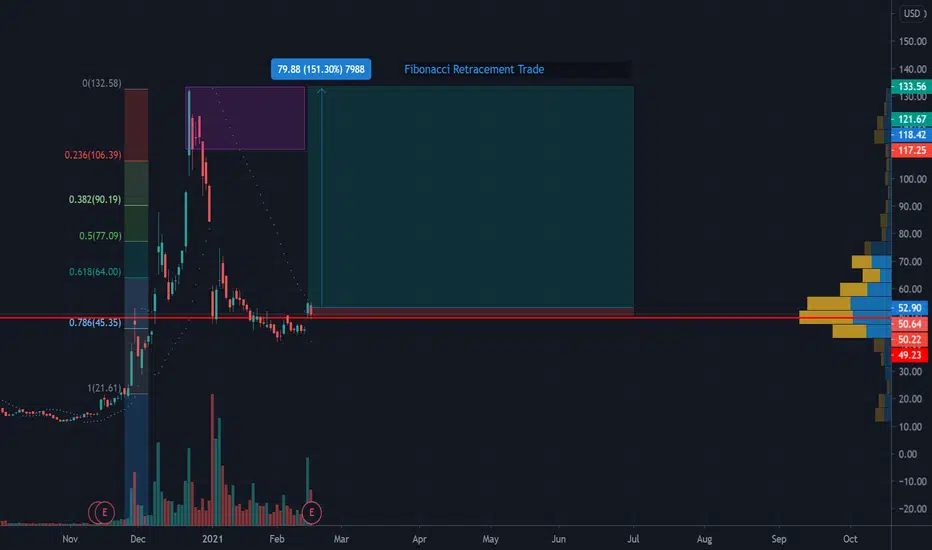
QS Long - Fibonacci TradeDaily Chart - Swing Trade - Fibonacci Retracement Strategy
QS retraced significantly from its ATH and is currently consolidating at the Point of Control (POC) also a Demand Zone right around $50.00. ADX is below 25, meaning QS is not trending right now. You'll notice on the left that the fib retrace level shows, just over 78.6% price retraced, which is big and a good opportunity to take a position for this kind of strategy when the price moves up to retest that Supply Zone in Purple.
MACD crossed so we should see some price action to the upside. RSI is good, not overbought, not oversold.
Earning was today and was... o k.
Looking long term QS has potential with the solid-state battery technology for EVs.
This was the first significant retrace and I've taken a position on this trade with a target of 150%.
I am speculating but maybe by mid-summer, we could see this.
Trade at your own risk. This is not financial advice. I am not a financial advisor.
Buy ABFRLA Symmetric Triangle formation has occurred on the weekly charts.
Above average high volume on breakout.
Also price has been in an expanding formation since 11th May 2020.
Price objective as per Triangle formation comes to 382.9
Other near term price targets are shown by green horizontal lines
Rising ADX line + Bullish MACD crossover on weekly charts further confirm the bullish trend
Stop Loss can be kept at 184.3
Risk/Reward Ratio is 4.35

BTCUSDT DMI analysisAs shown ADX is 25 and upward So Bears has required momentum, as DI- goes up BTC can down to about 30K .
Be careful: Your Trade , Your Risk, Your responsibility!
