Soybeans and Rain: Moisture’s Market Impact on the Bean Trade1. Introduction: Moisture & Market Momentum
Soybeans, often referred to as “the oilseed king,” are a cornerstone of global agriculture. As a leading source of protein for both humans and animals, their price fluctuations affect industries ranging from food production to biofuels. One key variable traders often monitor? Rainfall. 🌧️
Moisture plays a critical role in soybean development, influencing yield and quality from the moment the seed is sown. It’s no surprise that many market participants assume a strong correlation between rainfall and price behavior. But is that assumption truly supported by data?
In this article, we analyze how varying precipitation levels impact weekly soybean futures returns. As you'll see, the results might not be as clear-cut as you’d expect—but they still offer meaningful insights.
2. Biological Realities: Soybeans’ Water Needs
Soybeans thrive under specific conditions. While they’re generally resilient, rainfall—or the lack thereof—can tip the balance between bumper harvests and disappointing yields.
During early vegetative stages, sufficient moisture ensures healthy root development. Later, during the pod-fill phase, rainfall becomes even more essential. Too little water at this point leads to incomplete pods or aborted seeds. On the flip side, too much rain can invite fungal diseases and delay harvests, especially in lower-lying regions.
In countries like Brazil and Argentina, soybean fields often face seasonal extremes, while the U.S. Midwest typically enjoys more consistent conditions—though droughts and floods have both hit the Corn Belt in recent years. These environmental realities create natural volatility in both yield and pricing expectations.
3. Methodology: How We Analyzed Weather vs. Futures
To explore the potential connection between rainfall and soybean futures prices, we collected weekly weather data for major soybean-growing cities across the globe. Each week’s precipitation was categorized using a normalized percentile system:
Low Rainfall: below the 25th percentile
Normal Rainfall: between the 25th and 75th percentiles
High Rainfall: above the 75th percentile
We then matched this data against weekly returns of standard soybean futures (ZS) and micro soybean futures (MZS), both traded on the CME Group.
This allowed us to compare average price behavior in different rainfall scenarios—and test whether there was any statistically significant difference between dry and wet weeks.
4. Statistical Findings: Is There a Signal in the Noise?
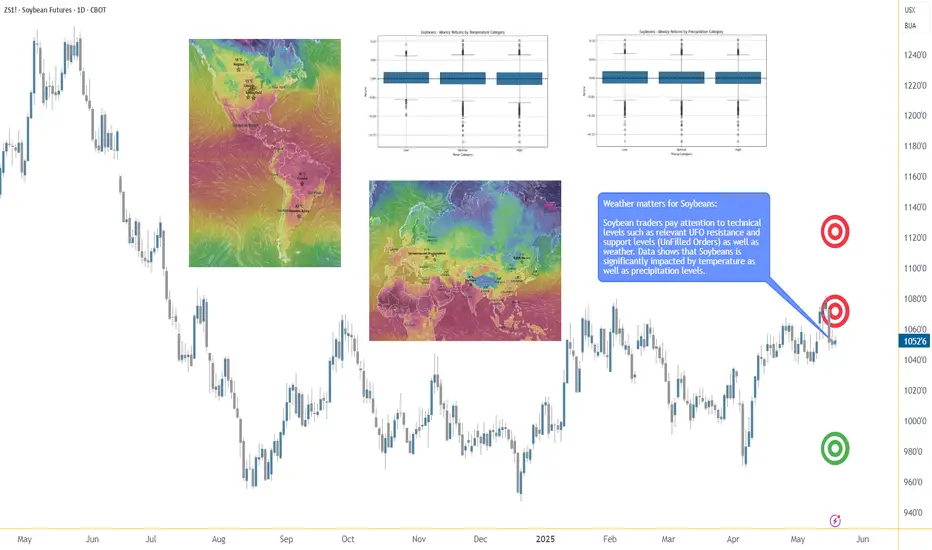
When examining the data, the initial visual impression from boxplots was underwhelming—return distributions across rainfall categories looked surprisingly similar. However, a deeper dive showed that the difference in mean returns between low and high precipitation weeks was statistically significant, with a p-value around 0.0013.
What does that mean for traders? While the signal may not be obvious to the naked eye, statistically, rainfall extremes do impact market behavior. However, the magnitude of impact remains modest—enough to be part of your strategy but not enough to drive decisions in isolation.
Soybean prices appear to be influenced by a mosaic of factors, with precipitation being just one tile in that complex picture.
5. Charting the Relationship: Visual Evidence
While statistical tests gave us the green light on significance, we know traders love to “see” the story too. Boxplots of weekly soybean futures returns segmented by rainfall categories offered a subtle narrative:
Low-precipitation weeks showed slightly higher average returns and tighter interquartile ranges.
High-precipitation weeks had broader return distributions and more frequent downside outliers.
Normal weeks exhibited relatively stable behavior, reinforcing the idea that the market reacts most during extremes.
This kind of visualization may not scream alpha at first glance, but it reinforces the idea that precipitation events—particularly dry spells—tend to nudge prices upward, possibly as market participants price in production risk.
6. Trading Implications: Positioning Around Weather
Here’s where things get practical. While weather alone won’t dictate every trading decision, it can be a key filter in a broader strategy. For soybean traders, rainfall data can help inform:
Bias assessment: Low-precipitation weeks may suggest bullish tendencies.
Risk control: Expect wider return distributions in high-precip weeks—adjust stops or contract sizing accordingly.
Event trading: Pair weather anomalies with technical signals like trendline breaks or volume surges for potential setups.
It’s also worth noting that weekly weather forecasts from reputable sources can serve as a forward-looking indicator, giving traders a head start before the market fully reacts.
7. Margin Efficiency with Micro Soybeans
For traders looking to scale into soybean exposure without the capital intensity of full contracts, the CME Group’s micro-sized futures offer a compelling alternative.
📌 Contract Specs for Soybean Futures (ZS):
Symbol: ZS
Contract size: 5,000 bushels
Tick size: 1/4 of one cent (0.0025) per bushel = $12.50
Initial margin: ~$2,100 (varies by broker and volatility)
📌 Micro Soybean Futures (MZS):
Symbol: MZS
Contract size: 500 bushels
Tick size: 0.0050 per bushel = $2.50
Initial margin: ~$210
These smaller contracts are perfect for strategy testing, risk scaling, or layering exposure around key macro events like WASDE reports or weather disruptions. For traders aiming to build weather-aligned positions, MZS is a powerful tool to balance conviction with capital efficiency.
8. Wrapping It All Together
Rain matters. Not just in fields, but in futures prices too. While soybean markets may not overreact to every drizzle or downpour, extreme rainfall conditions—especially drought—can leave noticeable footprints on price action.
For traders, this means opportunity. By incorporating precipitation metrics into your workflow, you unlock a new layer of context. One that doesn’t replace technical or fundamental analysis, but enhances both.
And remember: this article is just one piece of a larger exploration into how weather affects the commodity markets. Make sure you also read prior installments.
When charting futures, the data provided could be delayed. Traders working with the ticker symbols discussed in this idea may prefer to use CME Group real-time data plan on TradingView: tradingview.sweetlogin.com - This consideration is particularly important for shorter-term traders, whereas it may be less critical for those focused on longer-term trading strategies.
General Disclaimer:
The trade ideas presented herein are solely for illustrative purposes forming a part of a case study intended to demonstrate key principles in risk management within the context of the specific market scenarios discussed. These ideas are not to be interpreted as investment recommendations or financial advice. They do not endorse or promote any specific trading strategies, financial products, or services. The information provided is based on data believed to be reliable; however, its accuracy or completeness cannot be guaranteed. Trading in financial markets involves risks, including the potential loss of principal. Each individual should conduct their own research and consult with professional financial advisors before making any investment decisions. The author or publisher of this content bears no responsibility for any actions taken based on the information provided or for any resultant financial or other losses.
AGRI
Rain or Ruin? Analyzing Wheat Prices During Precip Extremes1. Introduction: When Rain Means Risk for Wheat Traders
Rain is life for wheat crops—until it isn’t. In the world of agriculture, water is essential, but extremes in precipitation can cause just as much harm as droughts. For traders in the wheat futures market, understanding this relationship between rainfall and price action is not just useful—it’s essential.
Wheat is a crop with a long growth cycle, grown across diverse geographies like the U.S. Plains, the Canadian Prairies, Russia, and Ukraine. Each region has its own precipitation rhythm, and any disruption can ripple through the global supply chain. The question is: can weather signals—especially rainfall—be used to predict market behavior?
This article dives into that question using a data-driven lens. We categorized precipitation data and measured how wheat futures returns responded to different rainfall environments. The results? Revealing, and at times, counterintuitive.
2. The Role of Rainfall in Wheat Production
Wheat, especially spring and winter varieties, is particularly sensitive to soil moisture levels at key phases like germination, tillering, and heading. Too little rain in early development and the crop can fail to establish. Too much rain close to harvest? Risk of disease, sprouting, and quality degradation.
Traders have long known that unexpected wet or dry weeks can trigger speculative surges or hedging activity. But how do these events influence actual futures returns?
Before answering that, we need to translate rain into something traders can use: categories based on historical norms.
3. Methodology: Categorizing Rainfall and Measuring Market Response
To understand how wheat prices respond to different levels of rainfall, we analyzed weekly precipitation data across global wheat-producing regions. We normalized the data using percentiles:
Low Precipitation: Below the 25th percentile
Normal Precipitation: Between the 25th and 75th percentiles
High Precipitation: Above the 75th percentile
We then matched this categorized weather data with weekly returns from wheat futures (symbol: ZW) to explore if price behavior systematically varied depending on how wet or dry a week had been.
To test significance, we used a simple t-test comparing the mean returns of low-precip and high-precip weeks. The p-value (6.995E-06) revealed a compelling result: yes, there is a statistically significant difference.
4. Results: High Rainfall, Higher Price Volatility
The data confirms that weeks with extreme rainfall—especially those with high precipitation—often align with more volatile wheat price movements.
But here’s the twist: while low-precip weeks didn’t consistently show bullish returns, high-precip weeks correlated with negative or erratic returns. That makes sense when you think about harvest delays, rot, and declining grain quality.
Traders watching forecasts for excessive rainfall should consider the implications for grain availability and price stabilization mechanisms. This is where speculative plays or hedging via options and standard or micro futures contracts can become especially useful.
5. Interpreting the Volatility: Why the Market Reacts to Rain
Why does excessive rain lead to such uneven price behavior?
The answer lies in uncertainty. Heavy rainfall often introduces multiple variables into the equation: planting delays, logistical bottlenecks, and downgraded wheat quality due to fungal infections. For example, a wet harvest can reduce protein content, pushing millers to seek alternatives—altering both demand and supply expectations simultaneously.
This dual-sided pressure—reduced high-quality yield and uncertain export capability—tends to shake market confidence. Traders respond not just to the supply data but also to how much trust they place in the supply pipeline itself.
6. Futures Contracts: Navigating Risk with Position Size Control
Traders looking to participate in wheat price action have two main CME-listed options:
Standard Wheat Futures (ZW)
Contract Size: 5,000 bushels
Tick Size: 1/4 cent per bushel (0.0025) has a $12.50 per tick impact
Margin Requirement: Approx. $1,700 (subject to change)
Micro Wheat Futures (MZW)
Contract Size: 500 bushels (1/10th the size of the standard contract)
Tick Size: 0.0050 per bushel has a $2.50 per tick impact
Margin Requirement: Approx. $170 (subject to change)
Micro contracts like MZW offer a lower-cost, lower-risk way to trade wheat volatility—perfect for sizing into weather-related trades with precision or managing risk in a more granular fashion. Many traders use these contracts to test strategies during seasonal transitions or while responding to forecast-driven setups.
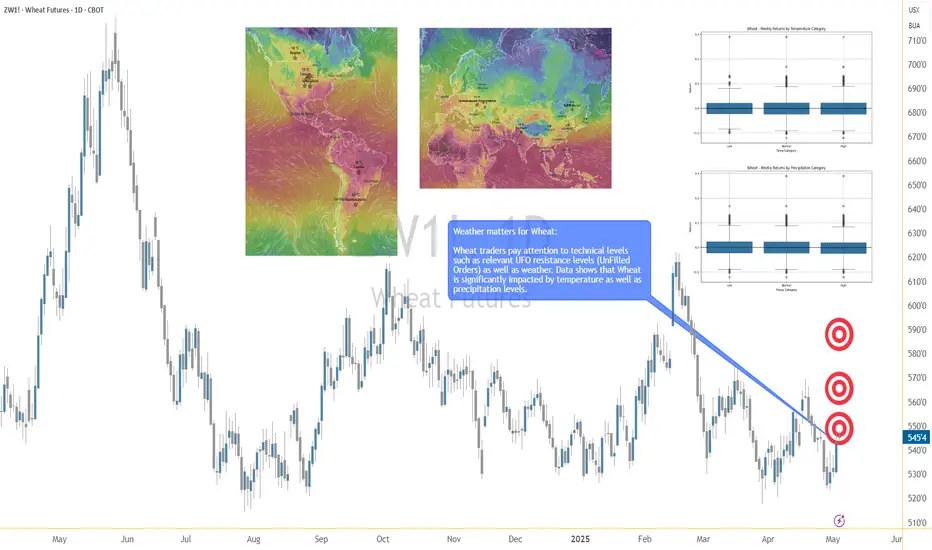
7. Visual Evidence: Price Behavior by Precipitation Category
To visually represent our findings, we used box plots to show wheat weekly returns grouped by precipitation category:
The shape of these distributions is revealing. High-precipitation weeks not only show lower average returns but also a wider range of possible outcomes—underscoring the role that rainfall extremes play in price volatility rather than just directional bias.
We are also complementing this visual with a weather map that shows real-time precipitation patterns in major wheat-growing regions. This could help traders align weather anomalies with trading opportunities.
8. Final Thoughts: The Forecast Beyond Forecasts
Precipitation isn’t just an agricultural concern—it’s a market catalyst.
Our analysis shows that rainfall extremes, particularly heavy rain, create meaningful signals for wheat traders. The price response is less about direction and more about uncertainty and volatility, which is equally important when structuring trades.
If you’re serious about trading wheat futures, don’t just watch the charts—watch the clouds.
This article is one piece in our broader series on how weather influences ag futures. Stay tuned for the next one, where we continue to decode the atmosphere’s impact on the markets.
When charting futures, the data provided could be delayed. Traders working with the ticker symbols discussed in this idea may prefer to use CME Group real-time data plan on TradingView: tradingview.sweetlogin.com - This consideration is particularly important for shorter-term traders, whereas it may be less critical for those focused on longer-term trading strategies.
General Disclaimer:
The trade ideas presented herein are solely for illustrative purposes forming a part of a case study intended to demonstrate key principles in risk management within the context of the specific market scenarios discussed. These ideas are not to be interpreted as investment recommendations or financial advice. They do not endorse or promote any specific trading strategies, financial products, or services. The information provided is based on data believed to be reliable; however, its accuracy or completeness cannot be guaranteed. Trading in financial markets involves risks, including the potential loss of principal. Each individual should conduct their own research and consult with professional financial advisors before making any investment decisions. The author or publisher of this content bears no responsibility for any actions taken based on the information provided or for any resultant financial or other losses.
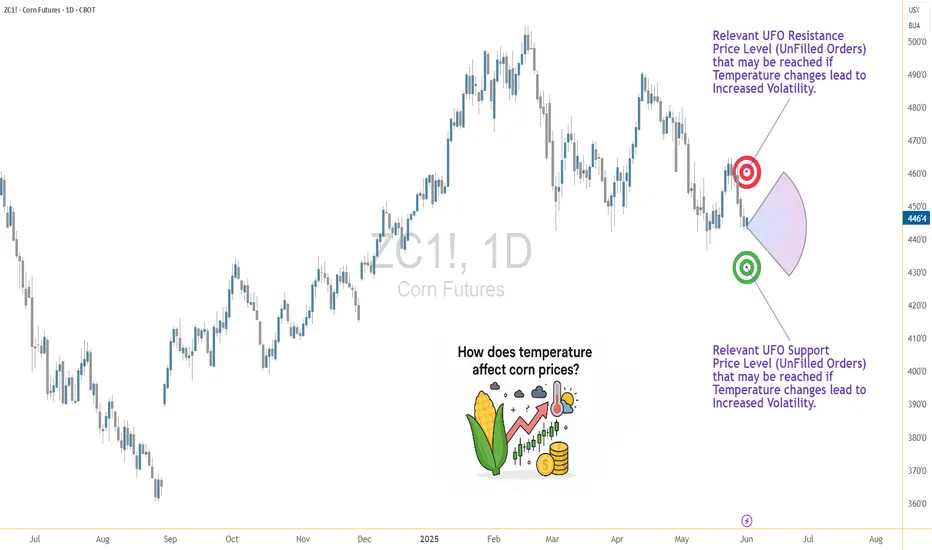
Weather and Corn: Understanding the Precipitation Factor1. Introduction: Rain, Grain, and Market Chain Reactions
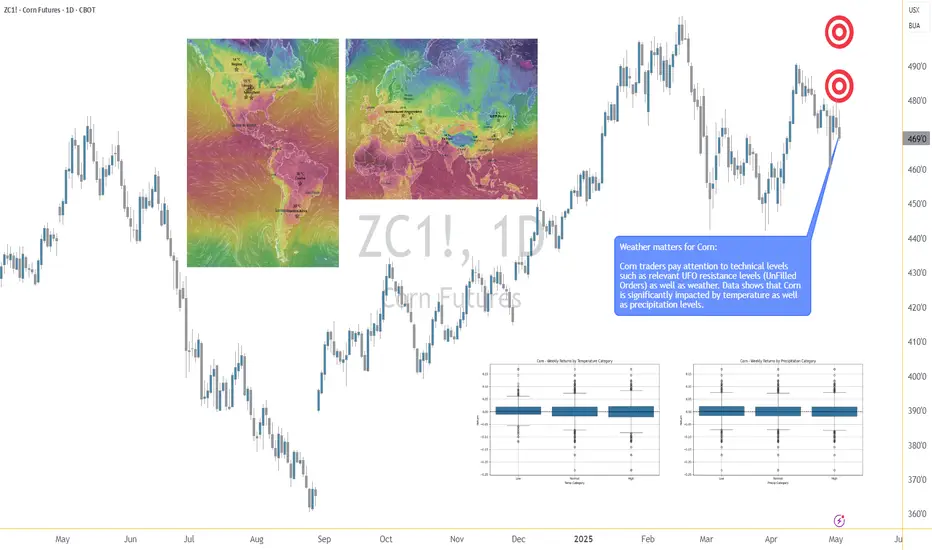
In the world of agricultural commodities, few forces carry as much weight as weather — and when it comes to corn, precipitation is paramount. Unlike temperature, which can have nuanced and sometimes ambiguous effects depending on the growth stage, rainfall exerts a more direct and consistent influence on crop performance. For traders, understanding the role of rainfall in shaping market sentiment and price behavior isn't just an agricultural curiosity — it's a trading edge.
This article unpacks the relationship between weekly rainfall levels and corn futures prices. By leveraging normalized weather data and historical returns from Corn Futures (ZC), we aim to translate weather signals into actionable market insights. Whether you're managing large agricultural positions or exploring micro futures like MZC, precipitation patterns can provide vital context for your trades.
2. Corn’s Moisture Dependency
Corn is not just sensitive to water — it thrives or suffers because of it. From the moment seeds are planted, the crop enters a delicate dance with precipitation. Too little moisture during the early stages can impair root development. Too much during germination may lead to rot. And during pollination — particularly the tasseling and silking stages — insufficient rainfall can cause the plant to abort kernels, drastically reducing yield.
On the other hand, excessive rainfall isn't necessarily beneficial either. Prolonged wet periods can saturate soil, hinder nutrient uptake, and encourage fungal diseases. Farmers in the U.S. Corn Belt — particularly in states like Iowa, Illinois, and Nebraska — know this well. A single unexpected weather shift in these regions can send ripple effects across global markets, causing speculators to reassess their positions.
For traders, these weather events aren’t just environmental footnotes — they are catalysts that influence prices, volatility, and risk sentiment. And while annual production is important, it's the week-to-week rhythm of the growing season where short-term trades are born.
3. Our Data-Driven Approach: Weekly Rainfall and Corn Returns
To understand how rainfall impacts price, we collected and analyzed decades of historical weather and futures data, aligning weekly precipitation totals from major corn-growing regions with weekly returns from Corn Futures (ZC).
The weather data was normalized using percentiles for each location and week of the year. We then assigned each weekly observation to one of three precipitation categories:
Low rainfall (<25th percentile)
Normal rainfall (25th–75th percentile)
High rainfall (>75th percentile)
We then calculated the weekly percent change in corn futures prices and matched each return to the rainfall category for that week. The result was a dataset that let us measure not just general trends but statistically significant shifts in market behavior based on weather. One key finding stood out: the difference in returns between low-rainfall and high-rainfall weeks was highly significant, with a p-value of approximately 0.0006.
4. What the Numbers Tell Us
The results are striking. During low-rainfall weeks, corn futures often posted higher average returns, suggesting that the market responds to early signs of drought with anticipatory price rallies. Traders and institutions appear to adjust positions quickly when weather models hint at below-normal moisture during key growth stages.
In contrast, high-rainfall weeks displayed lower returns on average — and greater variability. While rain is essential, excess moisture raises fears of waterlogging, planting delays, and quality issues at harvest. The futures market, ever forward-looking, seems to price in both optimism and concern depending on the volume of rain.
Boxplots of these weekly returns reinforce the pattern: drier-than-usual weeks tend to tilt bullish, while wetter periods introduce uncertainty. For discretionary and algorithmic traders alike, this insight opens the door to strategies that incorporate weather forecasts into entry, exit, and risk models.
📊 Boxplot Chart: Weekly corn futures returns plotted against precipitation category (low, normal, high). This visual helps traders grasp how price behavior shifts under varying rainfall conditions.
5. Strategy: How Traders Can Position Themselves
With the clear statistical link between rainfall extremes and price behavior in corn futures, the logical next step is applying this insight to real-world trading. One straightforward approach is to incorporate weather forecast models into your weekly market prep. If a key growing region is expected to receive below-normal rainfall, that could serve as a signal for a potential bullish bias in the upcoming trading sessions.
This doesn’t mean blindly buying futures on dry weeks, but rather layering this data into a broader trading thesis. For example, traders could combine weather signals with volume surges, technical breakouts, or news sentiment to form confluence-based setups. On the risk management side, understanding how price behaves during extreme weather periods can inform smarter stop-loss placements, position sizing, or even the use of option strategies to protect against unexpected reversals.
Additionally, this information becomes particularly valuable during the planting and pollination seasons, when the corn crop is most vulnerable and the market reacts most strongly. Knowing the historical patterns of price behavior in those weeks — and aligning them with current forecast data — offers a clear edge that fundamental and technical analysis alone may not reveal.
🗺️ Global Corn Map Screenshot: A world map highlighting major corn-growing regions with weather overlay. This helps illustrate the geographic variability in rainfall and how it intersects with key production zones.
6. Corn Futures Contracts: Speculating with Flexibility
For traders looking to act on this kind of seasonal weather intelligence, CME Group provides two practical tools: the standard-size Corn Futures contract (ZC) and the Micro Corn Futures contract (MZC).
Here are some quick key points to remember:
Tick size for ZC is ¼ cent (0.0025) per bushel, equating to $12.50 per tick.
For MZC, each tick is 0.0050 equating to $2.50 per tick.
Standard ZC initial margin is approximately $1,000 and MZC margins are around $100 per contract, though this can vary by broker.
Micro contracts are ideal for those who want exposure to corn prices without the capital intensity of full-size contracts. They’re especially helpful for weather-based trades, where your thesis may rely on shorter holding periods, rapid scaling, or position hedging.
7. Conclusion: Rain’s Role in the Corn Trade
Precipitation isn’t just a farmer’s concern — it’s a trader’s opportunity. Our analysis shows that weather data, especially rainfall, has a statistically significant relationship with corn futures prices. By normalizing historical precipitation data and matching it to weekly returns, we uncovered a clear pattern: drought stress tends to lift prices, while excessive moisture creates volatility and downside risk.
For futures traders, understanding this dynamic adds another layer to market analysis.
As part of a broader series, this article is just one piece of a puzzle that spans multiple commodities and weather variables. Stay tuned for our upcoming releases, where we’ll continue exploring how nature’s forces shape the futures markets.
When charting futures, the data provided could be delayed. Traders working with the ticker symbols discussed in this idea may prefer to use CME Group real-time data plan on TradingView: tradingview.sweetlogin.com - This consideration is particularly important for shorter-term traders, whereas it may be less critical for those focused on longer-term trading strategies.
General Disclaimer:
The trade ideas presented herein are solely for illustrative purposes forming a part of a case study intended to demonstrate key principles in risk management within the context of the specific market scenarios discussed. These ideas are not to be interpreted as investment recommendations or financial advice. They do not endorse or promote any specific trading strategies, financial products, or services. The information provided is based on data believed to be reliable; however, its accuracy or completeness cannot be guaranteed. Trading in financial markets involves risks, including the potential loss of principal. Each individual should conduct their own research and consult with professional financial advisors before making any investment decisions. The author or publisher of this content bears no responsibility for any actions taken based on the information provided or for any resultant financial or other losses.
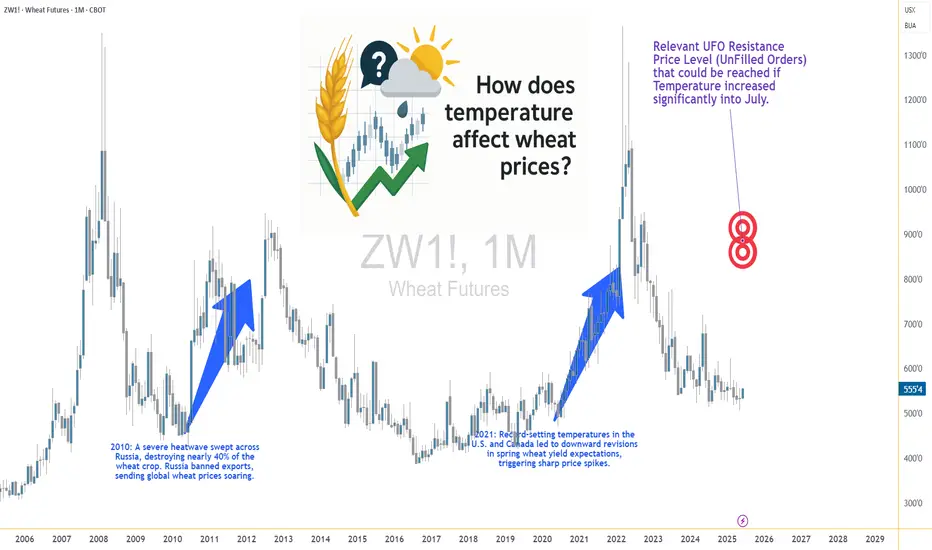
Heatwaves and Wheat: How Temperature Shocks Hit Prices🌾 Section 1: The Wheat–Weather Connection—Or Is It?
If there’s one crop whose success is often tied to the weather forecast, it’s wheat. Or so we thought. For decades, traders and analysts have sounded the alarm at the mere mention of a heatwave in key wheat-producing regions. The logic? Excessive heat during the growing season can impair wheat yields by disrupting pollination, shortening the grain-filling period, or damaging kernel development. A tightening supply should lead to price increases. Simple enough, right?
But here’s where the story takes an unexpected turn.
What happens when we actually analyze the data? Does heat reliably lead to price spikes in the wheat futures market? The short answer: not exactly. In fact, our statistical tests show that temperature may not have the consistent, directional impact on wheat prices that many traders believe it does.
And that insight could change how you think about risk, seasonality, and the role of micro contracts in your wheat trading strategy.
📈 Section 2: The Economics of Wheat—And Its Role in the Futures Market
Wheat isn’t just a breakfast staple—it’s the most widely grown crop in the world. It’s cultivated across North America, Europe, Russia, Ukraine, China, and India, making it a truly global commodity. Because wheat is produced and consumed everywhere, its futures markets reflect a wide array of influences: weather, geopolitics, global demand, and speculative positioning.
The Chicago Board of Trade (CBOT), operated by CME Group, is the main venue for wheat futures trading. It offers two primary wheat contracts:
Standard Wheat Futures (ZW)
Contract Size: 5,000 bushels
Tick Size: 1/4 cent per bushel (0.0025) has a $12.50 per tick impact
Margin Requirement: Approx. $1,700 (subject to change)
Micro Wheat Futures (MZW)
Contract Size: 500 bushels (1/10th the size of the standard contract)
Tick Size: 0.0050 per bushel has a $2.50 per tick impact
Margin Requirement: Approx. $170 (subject to change)
These micro contracts have transformed access to grain futures markets. Retail traders and smaller funds can now gain precise exposure to weather-driven moves in wheat without the capital intensity of the full-size contract.
🌡️ Section 3: Weather Normalization—A Smarter Way to Measure Impact
When analyzing weather, using raw temperature values doesn’t paint the full picture. What’s hot in Canada might be normal in India. To fix this, we calculated temperature percentiles per location over 40+ years of historical weather data.
This gave us three weekly categories:
Below 25th Percentile (Low Temp Weeks)
25th to 75th Percentile (Normal Temp Weeks)
Above 75th Percentile (High Temp Weeks)
Using this approach, we grouped thousands of weeks of wheat futures data and examined how price returns behaved under each condition. This way, we could compare a “hot” week in Ukraine to a “hot” week in the U.S. Midwest—apples to apples.
🔄 Section 4: Data-Driven Temperature Categories and Wheat Returns
To move beyond anecdotes and headlines, we then calculated weekly percent returns for wheat futures (ZW) for each of the three percentile-based categories.
What we found was surprising.
Despite common assumptions that hotter weeks push wheat prices higher, the average returns didn’t significantly increase during high-temperature periods. However, something else did: volatility.
In high-temp weeks, prices swung more violently — up or down — creating wider return distributions. But the direction of these moves lacked consistency. Some heatwaves saw spikes, others fizzled.
This insight matters. It means that extreme heat amplifies risk, even if it doesn't create a reliable directional bias.
Traders should prepare for greater uncertainty during hot weeks — an environment where tools like micro wheat futures (MZW) are especially useful. These contracts let traders scale exposure and control risk in turbulent market conditions tied to unpredictable weather.
🔬 Section 5: Statistical Shock—The t-Test Revelation
To confirm our findings, we ran two-sample t-tests comparing the returns during low vs. high temperature weeks. The goal? To test if the means of the two groups were statistically different.
P-Value (Temp Impact on Wheat Returns): 0.354 (Not Significant)
Conclusion: We cannot reject the hypothesis that average returns during low and high temp weeks are the same.
This result is counterintuitive. It flies in the face of narratives we often hear during weather extremes.
However, our volatility analysis (using boxplots) showed that variance in returns increases significantly during hotter weeks, making them less predictable and more dangerous for leveraged traders.
🧠 Section 6: What Traders Can Learn from This
This analysis highlights a few key lessons:
Narratives aren’t always backed by data. High heat doesn’t always mean high prices.
Volatility increases during weather stress. That’s tradable, but not in the way many assume.
Risk-adjusted exposure matters. Micro wheat futures (MZW) are ideal for navigating weather-driven uncertainty.
Multi-factor analysis is essential. Weather alone doesn’t explain price behavior. Global supply chains, speculative flows, and other crops’ performance all play a role.
This article is part of a growing series where we explore the relationship between weather and agricultural futures. From corn to soybeans to wheat, each crop tells a different story. Watch for the next release—we’ll be digging deeper into more effects and strategies traders can use to capitalize on weather.
When charting futures, the data provided could be delayed. Traders working with the ticker symbols discussed in this idea may prefer to use CME Group real-time data plan on TradingView: tradingview.sweetlogin.com - This consideration is particularly important for shorter-term traders, whereas it may be less critical for those focused on longer-term trading strategies.
General Disclaimer:
The trade ideas presented herein are solely for illustrative purposes forming a part of a case study intended to demonstrate key principles in risk management within the context of the specific market scenarios discussed. These ideas are not to be interpreted as investment recommendations or financial advice. They do not endorse or promote any specific trading strategies, financial products, or services. The information provided is based on data believed to be reliable; however, its accuracy or completeness cannot be guaranteed. Trading in financial markets involves risks, including the potential loss of principal. Each individual should conduct their own research and consult with professional financial advisors before making any investment decisions. The author or publisher of this content bears no responsibility for any actions taken based on the information provided or for any resultant financial or other losses.
Weather and Corn: A Deep Dive into Temperature Impact1. Introduction: Corn and Climate – An Inseparable Relationship
For traders navigating the corn futures market, weather isn't just a background noise—it's a market mover. Few agricultural commodities are as sensitive to environmental variables as corn, especially temperature. Corn is grown across vast regions, and its development is directly tied to how hot or cold the season plays out. This makes weather not just a topic of interest but a core input in any corn trader’s playbook.
In this article, we go beyond conventional wisdom. Instead of simply assuming “hotter equals bullish,” we bring data into the equation—weather data normalized by percentile, matched with price returns on CME Group's corn futures. The results? Useful for anyone trading ZC or MZC contracts.
2. How Temperature Affects Corn Physiology and Yields
At the biological level, corn thrives best in temperatures between 77°F (25°C) and 91°F (33°C) during its growth stages. During pollination—a critical yield-defining window—extreme heat (especially above 95°F / 35°C) can cause irreversible damage. When hot weather coincides with drought, the impact on yields can be catastrophic.
Historical drought years like 2012 and 1988 serve as powerful examples. In 2012, persistent heat and dryness across the US Midwest led to a national yield drop of over 25%, sending futures skyrocketing. But heat doesn't always spell disaster. Timing matters. A heat wave in early June may have little impact. That same wave during tasseling in July? Major consequences.
3. The Market Mechanism: How Traders Respond to Temperature Surprises
Markets are forward-looking. Futures prices don’t just reflect today’s weather—they reflect expectations. A dry June may already be priced in by the time USDA issues its report. This dynamic creates an interesting challenge for traders: separating noise from signal.
During July and August—the critical reproductive phase—temperature updates from NOAA and private forecasters often trigger major moves. Rumors of an incoming heat dome? Corn futures might gap up overnight. But if it fizzles out, retracements can be just as dramatic. Traders who rely on headlines without considering what’s already priced in are often late to the move.
4. Our Analysis: What the Data Reveals About Corn and Temperature
To cut through the fog, we performed a percentile-based analysis using decades of weather and price data. Rather than looking at raw temperatures, we classified each week into temperature “categories”:
Low Temperature Weeks: Bottom 25% of the historical distribution
Normal Temperature Weeks: Middle 50%
High Temperature Weeks: Top 25%
We then analyzed weekly percentage returns for the corn futures contract (ZC) in each category. The outcome? On average, high-temperature weeks showed higher volatility—but not always higher returns. In fact, the data revealed that some extreme heat periods were already fully priced in, limiting upside.
5. Statistically Significant or Not? T-Tests and Interpretation
To test whether the temperature categories had statistically significant impacts on weekly returns, we ran a t-test comparing the “Low” vs. “High” temperature groups. The result: highly significant. Corn returns during high-temperature weeks were, on average, notably different than those during cooler weeks, with a p-value far below 0.01 (4.10854357245787E-13).
This tells us that traders can't ignore temperature anomalies. Extreme heat does more than influence the narrative—it materially shifts price behavior. That said, the direction of this shift isn't always bullish. Sometimes, high heat correlates with selling, especially if it’s viewed as destructive beyond repair.
6. Strategic Takeaways for Corn Traders
Traders can use this information in several ways:
Anticipatory Positioning: Use temperature forecasts to adjust exposure ahead of key USDA reports.
Risk Management: Understand that volatility spikes in extreme temperature conditions and plan stops accordingly.
Calendar Sensitivity: Prioritize weather signals more heavily in July than in May, when crops are less vulnerable.
Combining weather percentile models with weekly return expectations can elevate a trader’s edge beyond gut feel.
7. CME Group Corn Futures and Micro Corn Contracts
Corn traders have options when it comes to accessing this market. The flagship ZC futures contract from CME Group represents 5,000 bushels of corn and is widely used by commercial hedgers and speculators alike. For those seeking more precision or lower capital requirements, the recently launched Micro Corn Futures (MZC) represent just 1/10th the size.
This fractional sizing makes temperature-driven strategies more accessible to retail traders, allowing them to deploy seasonal or event-based trades without excessive risk exposure.
Here are some quick key points to remember:
Tick size for ZC is ¼ cent (0.0025) per bushel, equating to $12.50 per tick.
For MZC, each tick is 0.0050 equating to $2.50 per tick.
Standard ZC initial margin is approximately $1,000 and MZC margins are around $100 per contract, though this can vary by broker.
8. Wrapping Up: Temperature's Role in a Complex Equation
While temperature is a key driver in corn futures, it doesn't act in isolation. Precipitation, global demand, currency fluctuations, and government policies also play crucial roles. However, by quantifying the impact of extreme temperatures, traders gain a potential edge in anticipating market behavior.
Future articles will expand this framework to include precipitation, international weather events, and multi-variable models.
This article is part of a broader series exploring how weather impacts the corn, wheat, and soybean futures markets. Stay tuned for the next release, which builds directly on these insights.
When charting futures, the data provided could be delayed. Traders working with the ticker symbols discussed in this idea may prefer to use CME Group real-time data plan on TradingView: tradingview.sweetlogin.com - This consideration is particularly important for shorter-term traders, whereas it may be less critical for those focused on longer-term trading strategies.
General Disclaimer:
The trade ideas presented herein are solely for illustrative purposes forming a part of a case study intended to demonstrate key principles in risk management within the context of the specific market scenarios discussed. These ideas are not to be interpreted as investment recommendations or financial advice. They do not endorse or promote any specific trading strategies, financial products, or services. The information provided is based on data believed to be reliable; however, its accuracy or completeness cannot be guaranteed. Trading in financial markets involves risks, including the potential loss of principal. Each individual should conduct their own research and consult with professional financial advisors before making any investment decisions. The author or publisher of this content bears no responsibility for any actions taken based on the information provided or for any resultant financial or other losses.
Soybeans: The Global Protein Powerhouse🟡 1. Introduction
Soybeans might not look like much at first glance — small, round, unassuming. But behind every bean lies a global story of protein demand, export flows, and economic policy.
They feed livestock, fuel vehicles, nourish entire populations, and move markets. In fact, soybeans sit at the intersection of agriculture, industry, and geopolitics — making them one of the most actively traded and strategically watched commodities in the world.
If you’re looking to understand how soybeans move markets — and how you can trade them effectively — this article is your starting point.
🌍 2. Why the World Cares About Soybeans
Few agricultural commodities carry the weight soybeans do. Their importance spans both the food and energy sectors — and their global footprint is enormous.
Here’s why they matter:
Protein Meal: After processing, about 80% of the soybean becomes high-protein meal used to feed poultry, pigs, and cattle.
Soybean Oil: Roughly 20% is extracted as oil — a key ingredient in cooking, industrial products, and increasingly, biodiesel.
Biofuels: As the push for renewable energy grows, soybean oil plays a major role in sustainable fuel strategies.
Top producers:
United States — historically the world’s largest producer.
Brazil — now rivals or exceeds U.S. production in some years.
Argentina — a dominant player in soybean meal and oil exports.
Top importers:
China — imports over 60% of globally traded soybeans.
EU, Mexico, Japan — also large buyers.
Soybeans are a bridge commodity — connecting livestock feed, food manufacturing, and renewable energy. That’s why traders from Chicago to Shanghai watch every yield forecast and export announcement closely.
💹 3. CME Group Soybean Contracts
Soybeans trade on the CME Group’s CBOT platform, with two main futures products:
o Standard Soybeans
Ticker: ZS
Size = 5,000 bushels
Tick = 0.0025 = $12.50
Margin = ~$2,150
o Micro Soybeans
Ticker: MZS
Size = 500 bushels
Tick = 0.0050 = $2.50
Margin = ~$215
Soybean futures are among the most actively traded agricultural contracts, offering deep liquidity, tight spreads, and excellent volatility for strategic traders. Keep in mind that margins are subject to change — always confirm with your broker. Micro contracts are ideal for scaling in/out of trades or learning market structure without large capital risk.
📅 4. The Soybean Calendar
Soybeans follow a seasonal cycle that creates rhythm in the market — and a potential edge for informed traders.
In the United States:
🌱 Planting: Late April to early June
☀️ Pod development / blooming: July and early August (weather-sensitive)
🌾 Harvest: September through November
In Brazil:
🌱 Planting: October to December
🌾 Harvest: February through April
This staggered calendar means that soybean markets have multiple weather risk windows each year. It also means the export flows and global pricing dynamics shift between the Northern and Southern Hemispheres throughout the calendar year.
That’s why soybeans tend to have two major volatility windows — mid-summer (U.S. crop concerns) and early Q1 (South American weather). Traders often build seasonal strategies around these patterns — buying weakness before key USDA reports, fading rallies during overbought harvests, or trading futures spreads between U.S. and Brazilian supply flows.
🔄 5. How Soybeans Are Traded Globally
Soybeans move through a complex international web of growers, crushers, exporters, and consumers. As a trader, understanding this flow is essential — because each node introduces price risk, opportunity, and reaction points.
Key players:
o Hedgers:
U.S. and Brazilian farmers hedge production risk using futures or options on futures.
Exporters hedge shipping schedules against fluctuating basis and FX risk.
o Crushers:
Companies like Cargill or Bunge buy soybeans to crush into meal and oil.
Crush margin (aka “board crush”) affects demand and influences futures spreads.
o Speculators:
Institutional funds trade soybeans as a macro or relative value play.
Retail traders use micro contracts (MZS) to capture directional or seasonal moves.
o China:
Its purchasing pace (or sudden cancellations) can move markets dramatically.
Announcements of bulk U.S. purchases could trigger short-covering rallies.
Additionally, soybeans are sometimes traded indirectly via their by-products:
Soybean Meal (ZM)
Soybean Oil (ZL)
These contracts often lead or lag ZS based on demand shifts in feed or fuel.
📈 6. What Makes Soybeans Unique to Trade
Compared to wheat and corn, soybeans are:
More weather-sensitive during July and August (especially to drought and heat).
More globally integrated, thanks to China’s dominant import role.
More complex, due to crush dynamics and multiple end-use markets.
This multifaceted nature is why many professional traders monitor soybeans, even if they aren’t actively trading them every week.
📌 7. Summary / Takeaway
Soybeans are one of the most important — and most tradable — commodities in the world. They feed livestock, fuel industry, and anchor the agricultural markets across two hemispheres.
Their unique role in food, fuel, and feed makes them more than just another contract — they’re a barometer for global health, demand, and policy.
Whether you’re trading the standard ZS contract or getting started with MZS, mastering soybeans means understanding weather, trade flows, product demand, and seasonality.
🧭 This article is part of our agricultural futures trading series.
📅 Watch for the next release: “Weather and Corn: A Deep Dive into Temperature Impact”
When charting futures, the data provided could be delayed. Traders working with the ticker symbols discussed in this idea may prefer to use CME Group real-time data plan on TradingView: tradingview.sweetlogin.com - This consideration is particularly important for shorter-term traders, whereas it may be less critical for those focused on longer-term trading strategies.
General Disclaimer:
The trade ideas presented herein are solely for illustrative purposes forming a part of a case study intended to demonstrate key principles in risk management within the context of the specific market scenarios discussed. These ideas are not to be interpreted as investment recommendations or financial advice. They do not endorse or promote any specific trading strategies, financial products, or services. The information provided is based on data believed to be reliable; however, its accuracy or completeness cannot be guaranteed. Trading in financial markets involves risks, including the potential loss of principal. Each individual should conduct their own research and consult with professional financial advisors before making any investment decisions. The author or publisher of this content bears no responsibility for any actions taken based on the information provided or for any resultant financial or other losses.
Breadbasket Basics: Trading Wheat Futures🟡 1. Introduction
Wheat may be a breakfast-table staple, but for traders, it’s a globally sensitive asset — a commodity that reacts to geopolitics, climate patterns, and shifting demand from dozens of countries.
Despite its critical role in food security and its status as one of the most traded agricultural commodities, wheat is often overlooked by traders who focus on corn or soybeans. Yet wheat offers a unique combination of liquidity, volatility, and macro sensitivity that makes it highly attractive for both hedgers and speculators.
If you’re new to trading wheat, this guide gives you a solid foundation: how the wheat market works, who the key players are, and what makes wheat such a dynamic futures product.
🌍 2. Types of Wheat and Where It Grows
One of the first things traders need to understand is that wheat is not a single, uniform product. It’s a diverse group of grain types, each with its own characteristics, end uses, and pricing dynamics.
The major classes of wheat include:
Hard Red Winter (HRW): High-protein wheat grown in the central U.S. — used in bread and baking.
Soft Red Winter (SRW): Lower protein, used for pastries and crackers.
Hard Red Spring (HRS): Grown in the Northern Plains; prized for high gluten content.
Durum Wheat: Used for pasta, grown mainly in North Dakota and Canada.
White Wheat: Grown in the Pacific Northwest; used for noodles and cereals.
Each class responds differently to weather, demand, and regional risks — giving traders multiple ways to diversify or hedge.
Major global producers include:
United States
Russia
Canada
Ukraine
European Union
Australia
India
These regions experience different planting and harvesting calendars — and their weather cycles are often out of sync. This creates trading opportunities year-round.
🛠️ 3. CME Group Wheat Contracts
Wheat futures are traded on the Chicago Board of Trade (CBOT), part of the CME Group.
Here are the two key contracts:
o Standard Wheat
Ticker: ZW
Size = 5,000 bushels
Tick = 0.0025 = $12.50
Margin = ~$1,750
o Micro Wheat
Ticker: MZW
Size = 500 bushels
Tick = 0.0050 = $2.50
Margin = ~$175
Keep in mind that margins are subject to change — always confirm with your broker. Micro contracts are ideal for scaling in/out of trades or learning market structure without large capital risk.
📅 4. Wheat’s Seasonality and Supply Chain
Unlike corn or soybeans, wheat is planted and harvested across multiple seasons depending on the variety and geography.
In the U.S., winter wheat (HRW and SRW) is planted in the fall (September–November) and harvested in early summer (May–July). Spring wheat (HRS) is planted in spring (April–May) and harvested late summer.
Globally, things get even more staggered:
Australia’s wheat is harvested in November–December
Ukraine and Russia harvest in June–August
Argentina’s crop comes off the fields in December–January
This scattered global schedule means news headlines about one country’s weather or war (think Ukraine in 2022) can quickly shift sentiment across the entire futures curve.
📈 5. Who Trades Wheat and Why
Wheat is traded by a wide range of participants — each with their own objectives and strategies. Understanding their behavior can give you an edge in anticipating market moves.
Commercial hedgers:
Farmers lock in prices to protect against adverse weather or market crashes.
Grain elevators and exporters use futures to manage inventory risk.
Flour mills hedge their input costs to protect profit margins.
Speculators:
Hedge funds and CTAs trade wheat based on global macro trends, weather anomalies, or technical setups.
Retail traders increasingly use micro contracts to gain exposure to agricultural markets with lower capital risk.
Spread traders bet on pricing differences between wheat classes or harvest years.
🔍 For retail traders especially, micro contracts like XW open the door to professional markets without oversized exposure.
🧠 6. What Makes Wheat Unique in Futures Markets
Wheat is often considered the most geopolitically sensitive of the major grains. Here’s why:
Price can spike fast — even on rumor alone (e.g., export bans or missile strikes near ports).
Production risks are global — the market reacts not just to the U.S. crop, but to conditions in Russia, Ukraine, and Australia.
Storage and quality matter — protein levels and moisture content affect milling demand.
Unlike corn, wheat doesn’t have a single dominant industrial use (like ethanol). This means food demand is king, and food security often drives policy decisions that affect futures pricing.
📌 7. Summary / Takeaway
Wheat may not get as much media attention as corn or soybeans, but it’s a deeply important — and deeply tradable — market. Its global footprint, class differences, and sensitivity to weather and politics make it a must-know for serious agricultural futures traders.
Whether you're just starting out or looking to diversify your trading playbook, understanding wheat is an essential step. Learn its rhythms, follow its news, and respect the fact that every crop cycle brings a new story to the market.
🧭 This article is part of an ongoing educational series exploring futures trading in agricultural commodities.
📅 Watch for the next release: “Soybeans: The Global Protein Powerhouse.”
When charting futures, the data provided could be delayed. Traders working with the ticker symbols discussed in this idea may prefer to use CME Group real-time data plan on TradingView: tradingview.sweetlogin.com - This consideration is particularly important for shorter-term traders, whereas it may be less critical for those focused on longer-term trading strategies.
General Disclaimer:
The trade ideas presented herein are solely for illustrative purposes forming a part of a case study intended to demonstrate key principles in risk management within the context of the specific market scenarios discussed. These ideas are not to be interpreted as investment recommendations or financial advice. They do not endorse or promote any specific trading strategies, financial products, or services. The information provided is based on data believed to be reliable; however, its accuracy or completeness cannot be guaranteed. Trading in financial markets involves risks, including the potential loss of principal. Each individual should conduct their own research and consult with professional financial advisors before making any investment decisions. The author or publisher of this content bears no responsibility for any actions taken based on the information provided or for any resultant financial or other losses.
The Golden Grain: Trading Corn in Global Markets🟡 1. Introduction
Corn isn’t just something you eat off the cob at a summer barbecue — it’s one of the most widely traded agricultural commodities in the world. Behind every kernel lies a powerful story of food security, global trade, biofuels, and speculative capital.
Whether you’re a farmer managing risk, a trader chasing macro trends, or simply curious about how weather affects global prices, corn futures sit at the crossroads of agriculture and finance. In this article, we’ll explore what makes corn a global economic driver, how it behaves as a futures product, and what traders need to know to approach the corn market intelligently.
🌎 2. Where Corn Grows: Global Powerhouses
Corn is cultivated on every continent except Antarctica, but a handful of countries dominate production and exports.
United States – By far the largest producer and exporter. The “Corn Belt” — spanning Iowa, Illinois, Indiana, Nebraska, and parts of Ohio and Missouri — produces the majority of U.S. corn. U.S. exports also set global benchmarks for pricing.
Brazil & Argentina – These two South American powerhouses are crucial to the global corn supply, especially during the Northern Hemisphere’s off-season.
China – Though a top producer, China consumes most of its own supply and has become a key importer during deficit years.
Corn is typically planted in the U.S. between late April and early June and harvested from September through November. In Brazil, two crops per year are common — including the important safrinha (second crop), harvested mid-year.
Understanding where and when corn is grown is vital. Weather disruptions in any of these regions can ripple through the futures market within hours — or even minutes.
💹 3. Corn as a Futures Market Power Player
Corn is one of the most liquid agricultural futures markets in the world, traded primarily on the CME Group’s CBOT (Chicago Board of Trade). It attracts a diverse set of participants:
Producers and Commercials: Farmers, ethanol refiners, and food manufacturers use corn futures to hedge price risk.
Speculators and Funds: Hedge funds and retail traders speculate on corn price direction, volatility, and seasonal patterns.
Arbitrageurs and Spreads: Traders bet on relative price differences between contracts (e.g., old crop vs. new crop spreads).
The deep liquidity and relatively low tick size make corn accessible, but its price is highly sensitive to weather, government reports (like WASDE), and international trade policies.
🏗️ 4. CME Group Corn Futures: What You Can Trade
The CME Group offers both standard and micro-sized contracts for corn. Here’s a quick overview:
o Standard Corn
Ticker: ZC
Size = 5,000 bushels
Tick = 0.0025 = $12.50
Margin = ~$1,050
o Micro Corn
Ticker: XC
Size = 1,000 bushels
Tick = 0.0050 = $2.50
Margin = ~$105
⚠️ Always confirm margin requirements with your broker. They change with market volatility and exchange updates.
The availability of micro corn contracts has opened the door for smaller traders to manage risk or test strategies without over-leveraging.
📊 5. Historical Price Behavior & Seasonality
Corn is deeply seasonal — and so is its price action.
During planting season (April–May), traders watch weekly USDA crop progress reports and early weather forecasts like hawks. A wet spring can delay planting, leading to tighter supply expectations and early price spikes.
Then comes pollination (July) — the most critical stage. This is when heatwaves or drought can do serious damage to yield potential. If temperatures are unusually high or rainfall is scarce during this window, markets often react with urgency, bidding up futures prices in anticipation of reduced output.
By harvest (September–November), prices often stabilize — especially if production matches expectations. But early frost, wind storms, or excessive rain during harvest can still trigger sharp volatility.
Many experienced traders overlay weather models, soil moisture maps, and historical USDA data to anticipate season-driven price shifts.
Even international factors play a role. For example, when Brazil’s safrinha crop suffers a drought, global corn supply tightens — impacting CME prices even though the crop is thousands of miles away.
🧠 6. What Every New Trader Should Know
If you’re new to corn trading, here are some key principles:
Watch the Weather: It’s not optional. Daily forecasts, drought monitors, and precipitation anomalies can move markets. NOAA, Open-Meteo, and private ag weather services are your friends.
Know the Reports: The WASDE report (World Agricultural Supply and Demand Estimates), USDA Crop Progress, and Prospective Plantings reports can shake up pricing more than you might expect — even if changes seem small.
Mind the Time of Year: Seasonality affects liquidity, volatility, and trader behavior. March–August tends to be the most active period.
Understand Global Demand: The U.S. exports a huge portion of its crop — with China, Mexico, and Japan as major buyers. A tariff tweak or surprise Chinese cancellation can cause wild price swings.
🛠️ Good corn trading is 50% strategy, 50% meteorology.
🧭 This article is part of a broader educational series exploring the relationship between agricultural commodities and weather patterns. In the upcoming pieces, we’ll dive deeper into how temperature and precipitation affect corn, wheat, and soybeans — with real data, charts, and trading insights.
📅 Watch for the next release: “Breadbasket Basics: Trading Wheat Futures.”
When charting futures, the data provided could be delayed. Traders working with the ticker symbols discussed in this idea may prefer to use CME Group real-time data plan on TradingView: tradingview.sweetlogin.com - This consideration is particularly important for shorter-term traders, whereas it may be less critical for those focused on longer-term trading strategies.
General Disclaimer:
The trade ideas presented herein are solely for illustrative purposes forming a part of a case study intended to demonstrate key principles in risk management within the context of the specific market scenarios discussed. These ideas are not to be interpreted as investment recommendations or financial advice. They do not endorse or promote any specific trading strategies, financial products, or services. The information provided is based on data believed to be reliable; however, its accuracy or completeness cannot be guaranteed. Trading in financial markets involves risks, including the potential loss of principal. Each individual should conduct their own research and consult with professional financial advisors before making any investment decisions. The author or publisher of this content bears no responsibility for any actions taken based on the information provided or for any resultant financial or other losses.
Buy, hold, and let those sweet returns melt in your portfolio!Guys, we all know the sector rotational for consumer defensive is now rebounded
regardless the sector rotation or tariffs noise, agribusiness and sugar remains an essential commodity in our daily life.
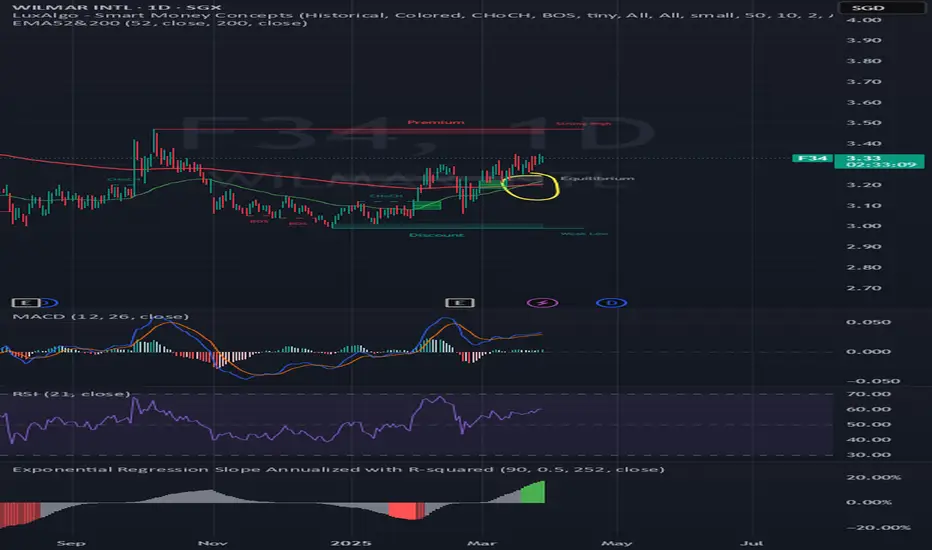
There are strategies that Wilmar has taken for the past 3 years. We have seen the share price is being strongly supported at SG$3.03.
Given the essential nature of sugar, Wilmar’s strategic positioning, strong financials, and resilient consumer demand, this could be an opportune time to buy and hold for long-term gains.
🗝️ Key Investment Considerations:
Strong Technical Support – Wilmar’s share price has consistently held above SG$3.03, indicating a solid support level.
📙 Fundamental Strength – The company has a wide economic moat, benefiting from its integrated agribusiness model.
💰 High Insider Ownership – With a 74.7% stake held by major investors, management has significant “skin in the game.”
SGX:F34
📌 Investment Call: Buy & Hold (24-36 months)
🎯 Target Price: SG$4.46
💰 Potential Upside: 33%
📈 Dividend Yield: ~5.13% (TTM)
Wilmar International (stock symbol: F34.SI) dividend yield (TTM) as of March 27, 2025 : 5.13%
Average dividend yield, last 5 years: 4.1% (including 2024)
W Chart - crossing above zero line for MACD indicator
Options Blueprint Series [Basic]: H&S amid Surging Wheat Supply1. Introduction: Bearish Opportunity in Wheat amid Rising Supply
With the U.S. Grain Stocks Wheat (USGSW) report showing a notable rise in wheat stock levels, a bearish scenario is unfolding for wheat futures. This increase in supply, which could drive prices downward, aligns with a technical setup showing potential for a bearish breakout.
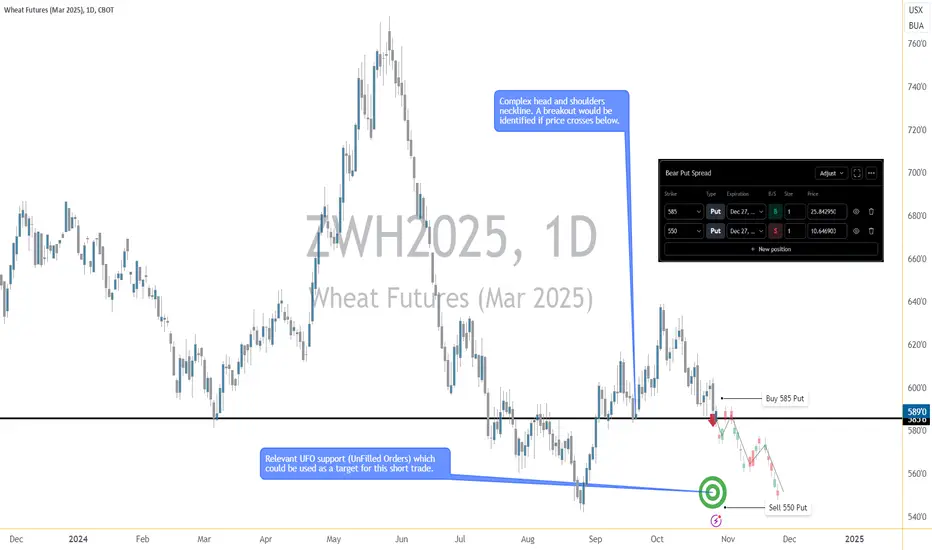
From a technical perspective, Wheat futures exhibit a Complex Head and Shoulders formation, signaling a possible breakdown as prices approach a critical support level. By combining the supply dynamics and technical formation, this article outlines a Bear Put Spread strategy, ideal for capitalizing on this bearish outlook with limited risk.
2. Fundamental Analysis: Rising Wheat Stock Levels
The most recent USGSW report has recorded wheat stock levels breaking upward to 1.98 billion bushels, up from the previous level of 1.779 billion bushels. This shift indicates a higher supply of wheat available in the market, which, in the absence of proportional demand, typically should result in price pressure to the downside.
Higher wheat stock levels often dampen demand sentiment, as markets anticipate reduced scarcity and increased availability. Such fundamentals offer a conducive backdrop for a bearish approach, supporting the downside breakout anticipated in the technical setup.
3. Technical Analysis: Complex Head and Shoulders Formation
The technical landscape for Wheat futures supports the bearish case, with a Complex Head and Shoulders pattern forming on the chart. This pattern is characterized by multiple peaks (heads) flanked by smaller peaks (shoulders), indicating a potential reversal from recent highs.
The critical neckline for this formation sits at 585'6. A break below this level would signal the likelihood of further downside movement. The target for this setup aligns with a UFO support zone at 552'4, which serves as an optimal price point to close the trade if the breakout confirms.
4. Trade Setup: Bear Put Spread on Wheat Futures (Ticker: ZWH2025)
To capitalize on the bearish setup, a Bear Put Spread is employed. This strategy allows for limited downside risk while still offering attractive profit potential. Here are the specifics:
o Contract Details for ZWH2025 (Wheat Futures):
Contract Size: 5,000 bushels
Tick Size: 1/4 of one cent (0.0025) per bushel (equivalent to $12.50 per tick)
Point value of 1 future unit: $50
Point value of 1 option unit: $50
Expiration: December 27, 2024
Margin Requirement: While the exact margin depends on the broker, the requirement typically ranges between $1,500 and $2,000 per futures contract. The margin for a Bear Put Spread in Wheat futures options is limited to the debit paid (15.2 points *$50 = $760).
o Options Strategy: Bear Put Spread
Buy the 585 put option at 25.84 and Sell the 550 put option at 10.64, both expiring on December 27, 2024.
The net debit paid is 25.84 – 10.64 = 15.2 points = $760
This spread provides a capped-risk opportunity for profiting from a downside move in Wheat futures.
o Risk Management:
While stop loss orders can be used, no stop loss is required given the limited-risk nature of the Bear Put Spread. The maximum potential loss is predefined by the cost of the spread.
5. Options Risk Profile Analysis
The Bear Put Spread strategy involves buying a put option at a higher strike price (585) and selling a put option at a lower strike price (550). This configuration:
Maximizes potential profit if Wheat futures drop to or below the 550 level by expiration.
Caps maximum loss at the initial cost of the spread, regardless of how the underlying Wheat futures move.
For this setup, the maximum potential profit is the difference between the strikes (585 - 550) minus the premium paid = 19.80 ($990). The maximum potential loss is the cost of the spread, making it a controlled-risk strategy suited to volatile or downward-trending markets.
6. Trade Execution Plan
Entry: Initiate the Bear Put Spread as Wheat futures break below the 585'6 neckline, confirming the downside breakout.
Target: Close the trade at 552'4, which aligns with a nearby UFO support zone, marking a logical exit point.
7. Risk Management Considerations
Effective risk management is essential in any options strategy, and the Bear Put Spread inherently offers several risk control advantages:
Limited Risk: By buying a put and selling a lower-strike put, the Bear Put Spread creates a defined risk position, capping potential losses at the initial premium paid for the spread.
No Stop Loss Required: With maximum risk predetermined by the cost of the spread, there's no need for a stop loss, which could otherwise be triggered prematurely in a volatile market.
Predefined Entry and Exit: This strategy's effectiveness hinges on precise entry (below the 585'6 neckline) and a clear target at 552'4. By maintaining these predefined parameters, the trade maximizes its alignment with both technical and fundamental setups.
This trade setup offers a balanced approach, allowing for downside exposure with risk under control, making it well-suited for periods of volatility or substantial downward moves.
When charting futures, the data provided could be delayed. Traders working with the ticker symbols discussed in this idea may prefer to use CME Group real-time data plan on TradingView: tradingview.sweetlogin.com - This consideration is particularly important for shorter-term traders, whereas it may be less critical for those focused on longer-term trading strategies. Also, some of the calculations and analytics used in this article have been derived using the QuikStrike® tool available on the CME Group website.
General Disclaimer:
The trade ideas presented herein are solely for illustrative purposes forming a part of a case study intended to demonstrate key principles in risk management within the context of the specific market scenarios discussed. These ideas are not to be interpreted as investment recommendations or financial advice. They do not endorse or promote any specific trading strategies, financial products, or services. The information provided is based on data believed to be reliable; however, its accuracy or completeness cannot be guaranteed. Trading in financial markets involves risks, including the potential loss of principal. Each individual should conduct their own research and consult with professional financial advisors before making any investment decisions. The author or publisher of this content bears no responsibility for any actions taken based on the information provided or for any resultant financial or other losses.
Corn Prices Fizzle on Bumper HarvestCorn prices have fallen 14% since the start of 2023. The latest USDA report points to further downside. Corn prices are expected to fizzle with expectations of a bumper harvest combined with tepid demand.
The USDA expects a record harvest of 15.27 billion bushels. The 2023/24 forecasts signal rising corn supply boosting ending stocks to their highest level since 2016/17.
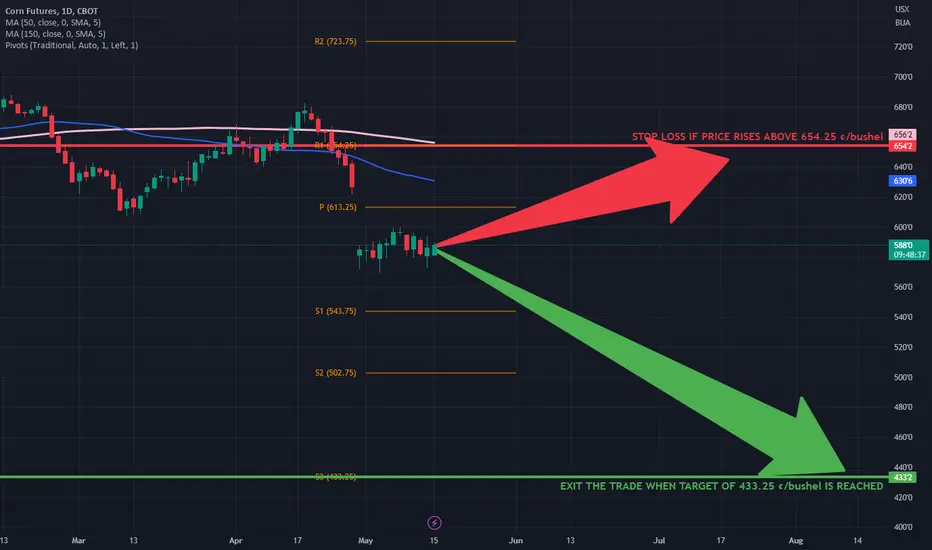
To hedge against falling corn price, this case study proposes a short position using CME Corn Futures (ZCN2023) expiring in July with an entry of 586.25 and a target of 433.25, which is hedged by a stop loss at 654.25, is likely to yield a reward-to-risk ratio of 2.25x.
RECORD CORN HARVEST IS ANTICIPATED RESULTING IN SOARING ENDING STOCKS
WASDE, short for World Agricultural Supply and Demand Estimates, is a monthly report released by the US Department of Agriculture (“USDA”) that tracks the supply and demand for various agricultural commodities.
In the latest WASDE report, released on May 12th, USDA expects a record 15.3 billion bushels of corn to be harvested in the US this year.
The US is the largest producer of corn, representing 32% of total global production. Global corn production is expected to rise 6% YoY in 2023-24.
While production is robust, demand and consumption are not expected to grow as fast. Global demand is expected to rise 3.7% with US consumption expected to climb 3.4%. This will result in an oversupply of corn with soaring inventory levels (i.e., Ending stocks).
Ending stocks represent the supply of corn that is carried over to the next year. They are expected to rise 56% YoY to 2.2 billion bushels, the highest level since 2016-17. This leaves plenty of supply to accommodate any demand expansion.
A bumper harvest in October is expected to cause an oversupply pushing corn prices lower.
Despite the recent decline in corn prices, they remain significantly higher than pre-pandemic levels. With ending stocks now expected to reach pre-pandemic levels, prices will likely follow.
WEATHER MAY UPSET BUMPER HARVEST EXPECTATIONS
The WASDE estimate assumes stable weather conditions as well as demand assumptions regarding China.
Weather conditions play a huge role in final harvested yield. In the current year, drought conditions & intense heat in Argentina led to lower crop yields. With extreme weather events rising globally, it is possible that unfavorable weather may reduce the final US corn output.
China is the largest consumer of corn. With hopes of strong economic recovery still simmering, demand in China may spike higher than USDA expectations.
If supply fails or demand spikes, Corn prices may remain steady or even rise.
Asset Managers and Options Markets are positioning for Corn price to plunge
CFTC’s Commitment of Traders Report shows that asset managers have more than doubled their net short positioning in Corn futures over the last twelve (12) weeks.
Other reportable traders have reduced their net long positioning by almost 50% in the same period. Both indicate rising bearishness about corn prices.
Similar sentiment is reflected in the options market. Although June and July contracts have Put/Call ratio of ~0.85 (more calls than puts), this is before the bumper harvest is expected (August-October). The September and December contracts which expire after the harvest have a Put/Call ratio of ~1.2.
The futures forward curve, which is in backwardation, also shows expectations for prices to drop following the harvest.
TRADE SETUP
Each lot of CME Corn Futures provides exposure to 5,000 bushels of corn. A short position in CME Corn Futures expiring in July (ZCN2023) with an entry of 586.25 and a target of 433.25, which is hedged by a stop loss at 654.25, is likely to yield a reward-to-risk ratio of 2.25x.
• Entry: 586.25 ¢/bushel
• Target: 433.25 ¢/bushel
• Stop: 654.25 ¢/bushel
• Profit at Target: USD 7,650
• Loss at Stop: USD 3,400
• Reward-to-risk: 2.25x
MARKET DATA
CME Real-time Market Data helps identify trading set-ups and express market views better. If you have futures in your trading portfolio, you can check out on CME Group data plans available that suit your trading needs tradingview.sweetlogin.com
DISCLAIMER
This case study is for educational purposes only and does not constitute investment recommendations or advice. Nor are they used to promote any specific products, or services.
Trading or investment ideas cited here are for illustration only, as an integral part of a case study to demonstrate the fundamental concepts in risk management or trading under the market scenarios being discussed. Please read the FULL DISCLAIMER the link to which is provided in our profile description.
Tiny R for Bigly winninglyCould be a killer one - Could be a not so killer one
But you'll know very quick and very small risky here. Tiny tiny tiny
Lets go my bredda - SHOW ME THE BREAD MY BOY
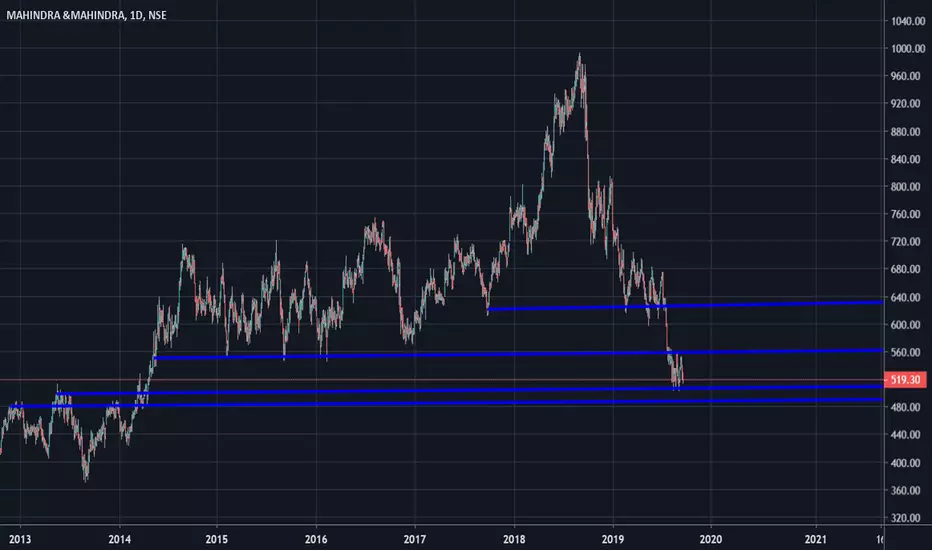
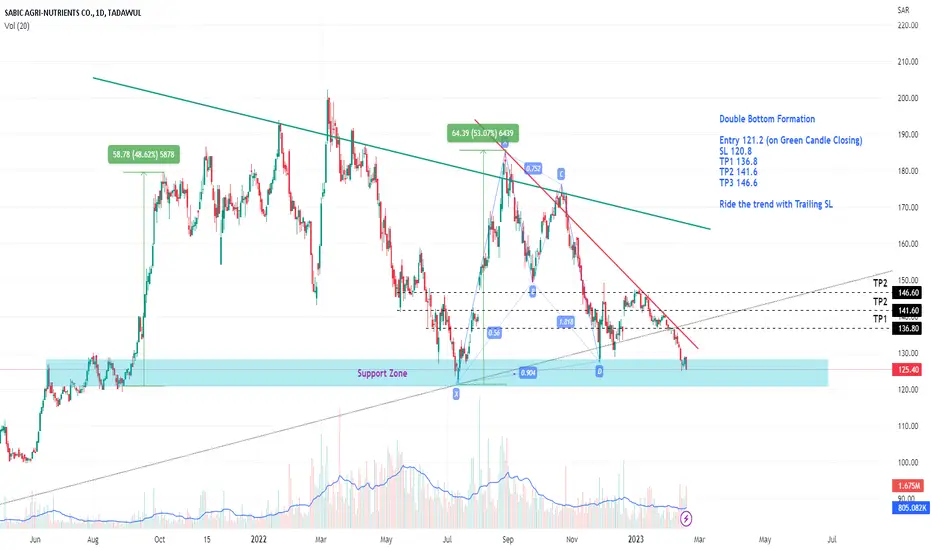
2020: SABIC-Agri (Wait for Double Bottom)Double Bottom Formation
About to touch important Support Zone
Entry 121.2 (on Green Candle Closing)
SL 120.8
TP1 136.8
TP2 141.6
TP3 146.6
Ride the trend with Trailing SL
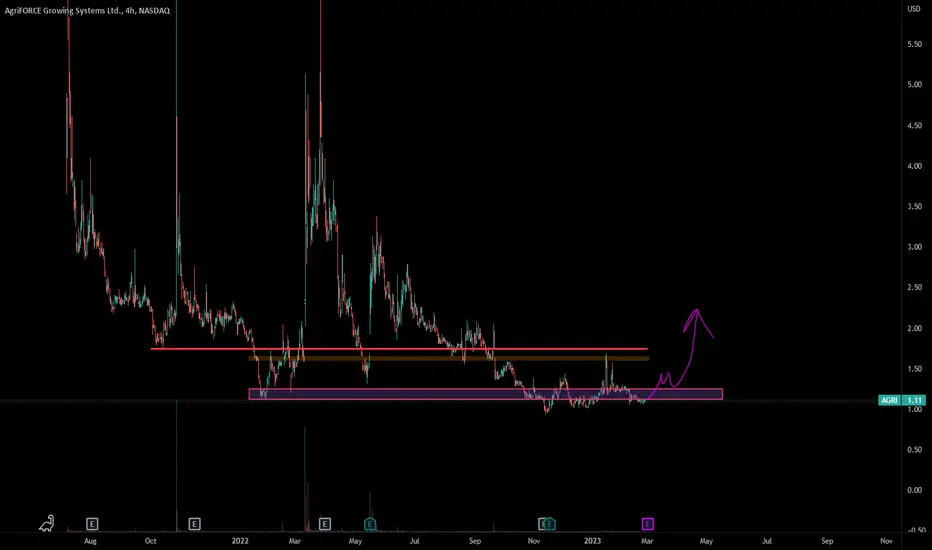
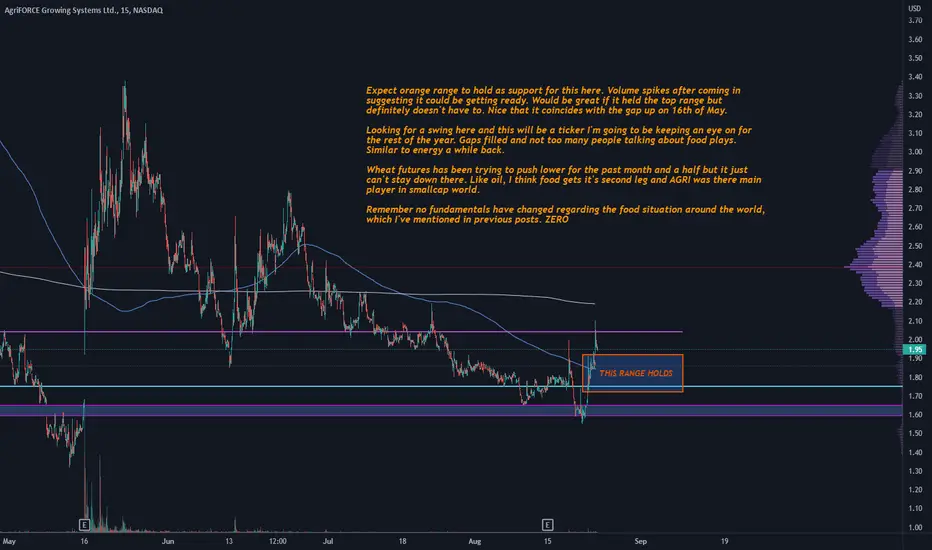
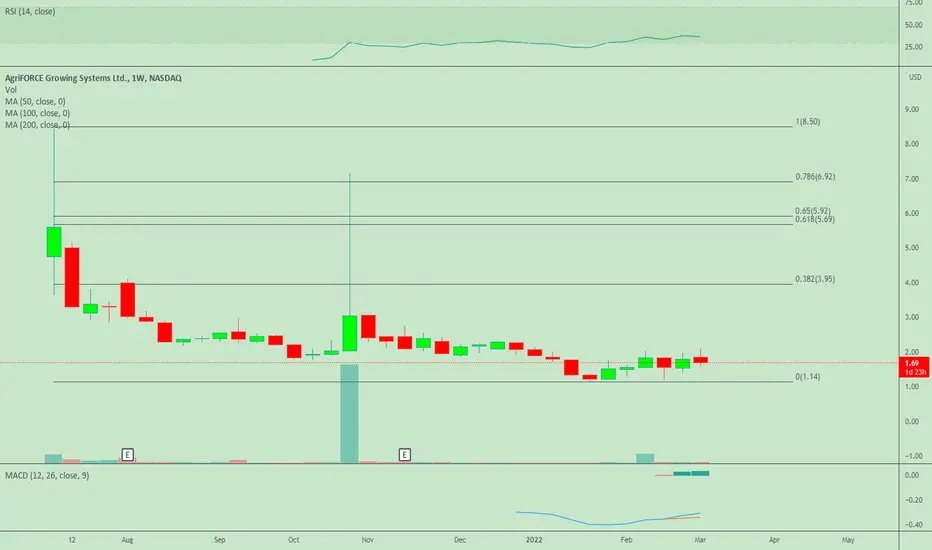
AGRI - Food will come back without a doubt it my mindExpect orange range to hold as support for this here. Volume spikes after coming in suggesting it could be getting ready. Would be great if it held the top range but definitely doesn't have to. Nice that it coincides with the gap up on 16th of May.
Looking for a swing here and this will be a ticker I'm going to be keeping an eye on for the rest of the year. Gaps filled and not too many people talking about food plays. Similar to energy a while back.
Wheat futures has been trying to push lower for the past month and a half but it just can't stay down there. Like oil, I think food gets it's second leg and AGRI was there main player in smallcap world.
Remember no fundamentals have changed regarding the food situation around the world, which I've mentioned in previous posts. ZERO
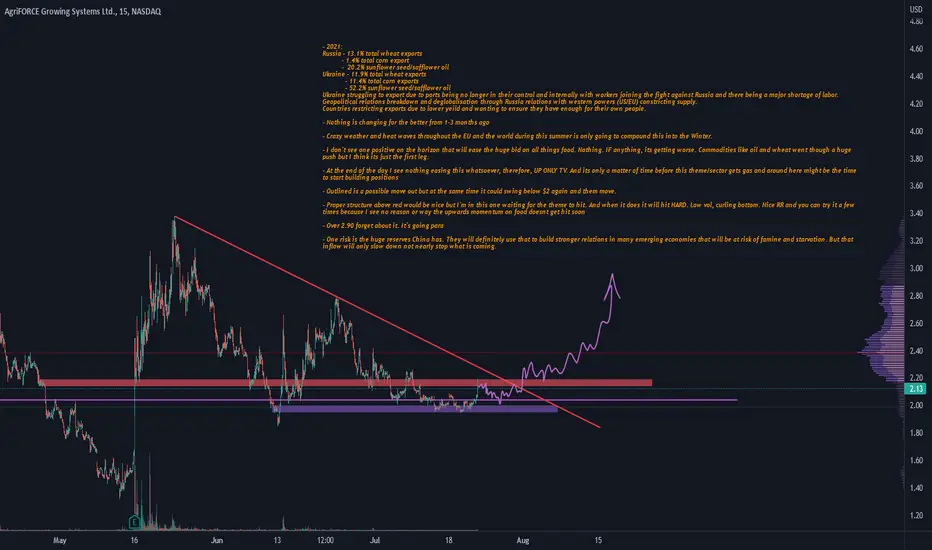
AGRI and all food related. Theme will be back and hard- 2021:
Russia - 13.1% total wheat exports
- 1.4% total corn export
- 20.2% sunflower seed/safflower oil
Ukraine - 11.9% total wheat exports
- 11.4% total corn exports
- 52.2% sunflower seed/safflower oil
Ukraine struggling to export due to ports being no longer in their control and internally with workers joining the fight against Russia and there being a major shortage of labor.
Geopolitical relations breakdown and deglobalisation through Russia relations with western powers (US/EU) constricting supply.
Countries restricting exports due to lower yield and wanting to ensure they have enough for their own people.
- Nothing is changing for the better from 1-3 months ago
- Crazy weather and heat waves throughout the EU and the world during this summer is only going to compound this into the Winter.
- I don't see one positive on the horizon that will ease the huge bid on all things food. Nothing. IF anything, its getting worse. Commodities like oil and wheat went though a huge push but I think its just the first leg.
- At the end of the day I see nothing easing this whatsoever, therefore, UP ONLY TV. And its only a matter of time before this theme/sector gets gas and around here might be the time to start building positions
- Outlined is a possible move out but at the same time it could swing below $2 again and them move.
- Proper structure above red would be nice but I'm in this one waiting for the theme to hit. And when it does it will hit HARD. Low vol, curling bottom. Nice RR and you can try it a few times because I see no reason or way the upwards momentum on food doesn't get hit soon
- Over 2.90 forget about it. It's going para
- One risk is the huge reserves China has. They will definitely use that to build stronger relations in many emerging economies that will be at risk of famine and starvation. But that inflow will only slow down not nearly stop what is coming.
AgriFORCE Growing Systems (USA: $AGRI) To Bloom Spring 2022! 🌷AgriFORCE Growing Systems, Ltd., an agriculture-focused technology company, focuses on the development and acquisition of crop production know-how and intellectual property augmented by advanced AgTech facilities and solutions in North America, Europe, and Asia. The company was formerly known as Canivate Growing Systems Ltd. and changed its name to AgriFORCE Growing Systems Ltd. in November 2019. AgriFORCE Growing Systems, Ltd. was incorporated in 2017 and is headquartered in Vancouver, Canada.
AGRI AgriFORCE Growing Systems Price TargetAGRI was listed on July 7th, at a public offering price of $5.00 per unit. Now the price is only 3.04usd!!!
Shares Float is low, 12.05Mil
AGRI has signed a letter of intent to acquire a leading AgTech European consultancy.
AgTech consultancy had 2020 annual consulting audited revenues of over US$26 million and EBITDA of US$3 million .
it expects revenues of US$28 million for 2021.
purchase price of AgriFORCE is around US$29 million cash and stock.
AGRI has now a mk cap of onlu 45.5mil. with this purchase and AgTech`s added fundamentals, and using also the fibonacci extension tool, my place target for AGRI short term is 11.20usd
I`m looking forward to read your opinion about it.

AGRIAgriFORCE Growing Systems Ltd (NASDAQ:AGRI) Potential bottom play next week. The stock price has fallen hard over the past several weeks and looks ready for a rebound. The technical daily chart above is not only oversold but also shows a stock ready to post a sizable bounce with several key momentum indicators showing positive divergences.

CPO (31 Mar 21) Now Ready To Move Down side Till 990-975MCX CPO (31 Mar 21) Will Move Downside from the level 1049-1060 It may face resistance near 1092-1099. Down side TGT will be near 1010-990-975.
MCX:CPO2!

Bullish continuation Here we see KAL's descending channel breakout accompanied by an ABC correction. A little late on this one but aiming for the target at the previous high for a 70% estimated appreciation.
Good luck and follow me for more!

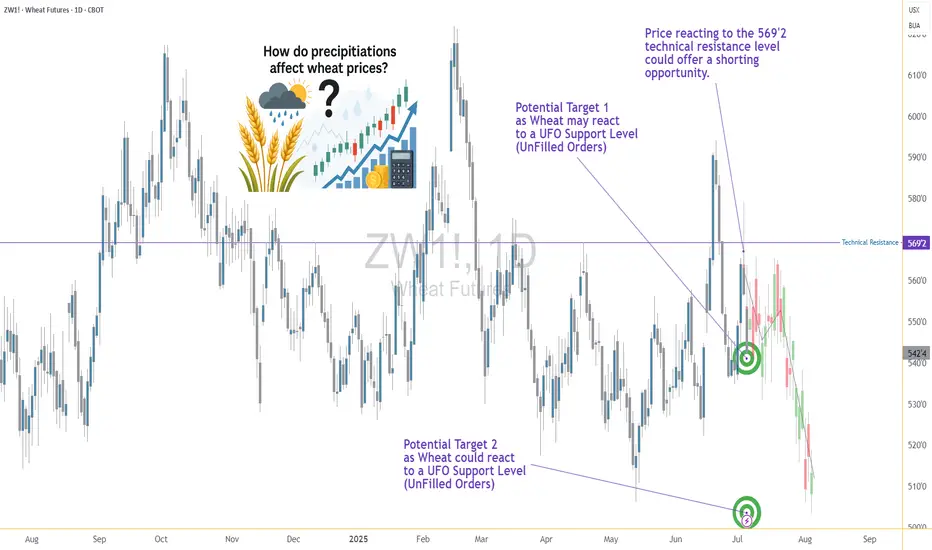
Wheat on the side while riding goldHey, I've been looking at grains a bit and I think wheat could be going down.
On a pullback there is a good r to r.
It is on a global downtrend and it convincingly broke to new lows on the lower TF.
It sort of always goes down around this period
Global trade & weather have a big impact I guess.
Here you can see the past weather: www.timeanddate.com
Here are averages: www.holiday-weather.com
Chicago is in the averages. Most places are below, France has had a freezing summer brrr.
The weather data is obviously run by climate deniers.
The CME website: www.cmegroup.com
The biggest producers of wheat are the same old same old... China USA India Europe South-South-America. And to a lesser extent pretty much everywhere except Africa.
Some of the top biggest exporters are Russia Canada the USA France Argentina Ukraine...
Argentina I think is the biggest net exporter there is in % of what they produce. India is self sufficient, China is barely I think.
I could list all the net exporters but it's easy to remember. It's the white countries.
Basically the most important weathers I think are NA & Europe.
And China news/catastrophic crop ==> boom.
Probably will trend down, hopefully without too much choppy pullbacks.
Would be nice to look at something other than gold here and there.
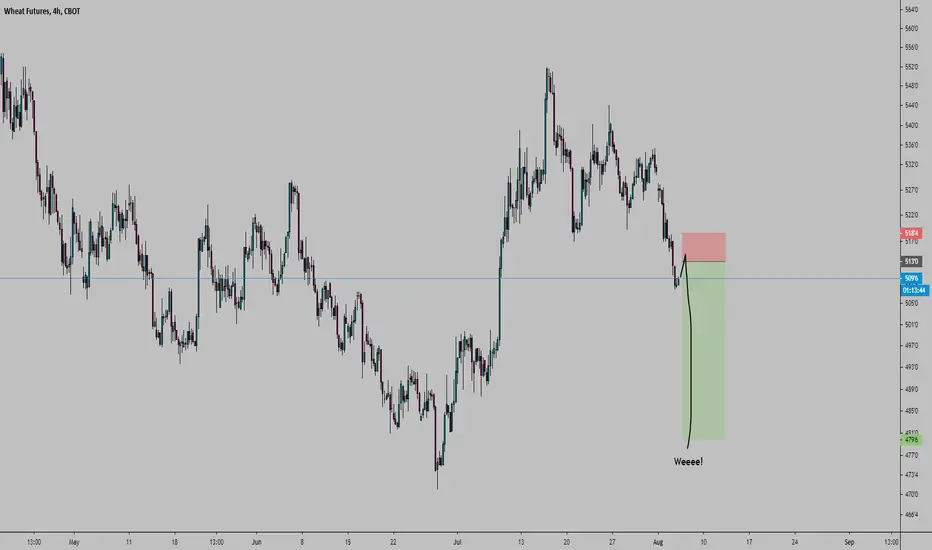
Bearish on grains & wheatBeen a while since I posted about agri.
Price is around its average now, I see no reason for it to skyrocket.
I don't think this little rally is a new trend, I see it as a correction.
And the short term uptrend is probably just noise that kindly comes fill my shorts.
Technically the price around 490-495 is a sweet spot to short this which makes it interesting.
We let the amateurs trade everything to make sure they don't miss out.
Market can stay irrational longer than you stay solvent so use a stop loss.
And also, it's not 100% sure the price is supposed to go down, might be wrong.
So in any case, stop loss (or something else) is good.
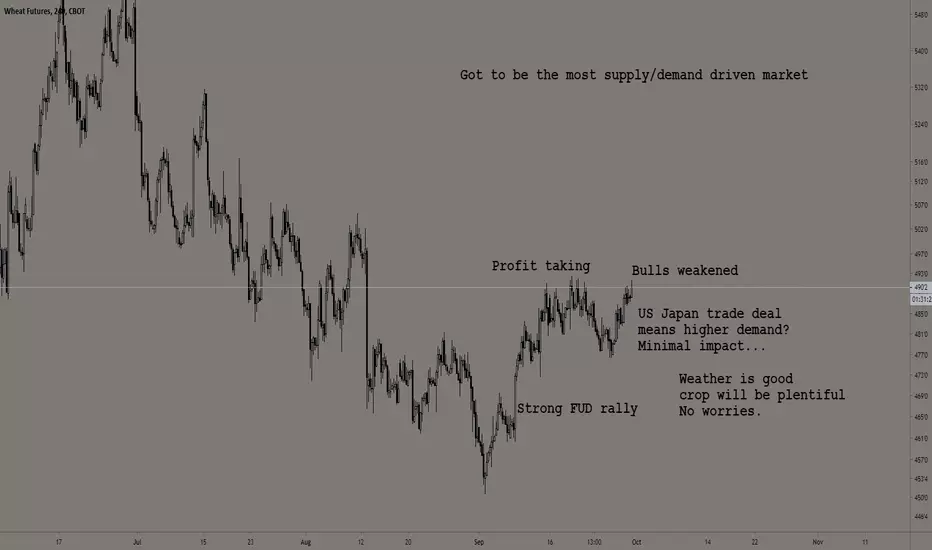
M&M AT 5 YEAR LOW. Buyer Ideology - Is it the time to do Bottom Fishing?
Seller Ideology - Am I trying to catch a Falling Knife?
Are you a buyer or Seller? Let me know.
We will be Buyers for 10 years.
We will be Sellers for 3-6 months.