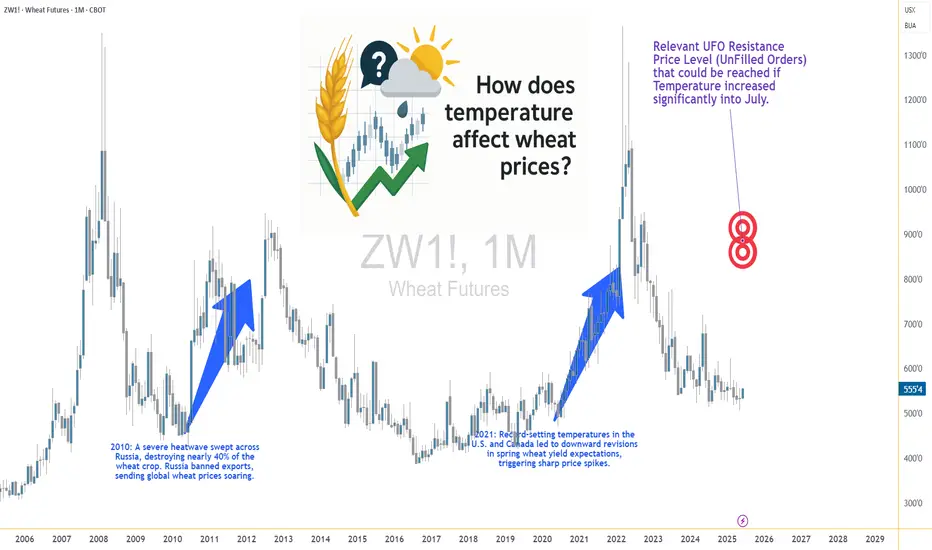
Heatwaves and Wheat: How Temperature Shocks Hit Prices🌾 Section 1: The Wheat–Weather Connection—Or Is It?
If there’s one crop whose success is often tied to the weather forecast, it’s wheat. Or so we thought. For decades, traders and analysts have sounded the alarm at the mere mention of a heatwave in key wheat-producing regions. The logic? Excessive heat during the growing season can impair wheat yields by disrupting pollination, shortening the grain-filling period, or damaging kernel development. A tightening supply should lead to price increases. Simple enough, right?
But here’s where the story takes an unexpected turn.
What happens when we actually analyze the data? Does heat reliably lead to price spikes in the wheat futures market? The short answer: not exactly. In fact, our statistical tests show that temperature may not have the consistent, directional impact on wheat prices that many traders believe it does.
And that insight could change how you think about risk, seasonality, and the role of micro contracts in your wheat trading strategy.
📈 Section 2: The Economics of Wheat—And Its Role in the Futures Market
Wheat isn’t just a breakfast staple—it’s the most widely grown crop in the world. It’s cultivated across North America, Europe, Russia, Ukraine, China, and India, making it a truly global commodity. Because wheat is produced and consumed everywhere, its futures markets reflect a wide array of influences: weather, geopolitics, global demand, and speculative positioning.
The Chicago Board of Trade (CBOT), operated by CME Group, is the main venue for wheat futures trading. It offers two primary wheat contracts:
Standard Wheat Futures (ZW)
Contract Size: 5,000 bushels
Tick Size: 1/4 cent per bushel (0.0025) has a $12.50 per tick impact
Margin Requirement: Approx. $1,700 (subject to change)
Micro Wheat Futures (MZW)
Contract Size: 500 bushels (1/10th the size of the standard contract)
Tick Size: 0.0050 per bushel has a $2.50 per tick impact
Margin Requirement: Approx. $170 (subject to change)
These micro contracts have transformed access to grain futures markets. Retail traders and smaller funds can now gain precise exposure to weather-driven moves in wheat without the capital intensity of the full-size contract.
🌡️ Section 3: Weather Normalization—A Smarter Way to Measure Impact
When analyzing weather, using raw temperature values doesn’t paint the full picture. What’s hot in Canada might be normal in India. To fix this, we calculated temperature percentiles per location over 40+ years of historical weather data.
This gave us three weekly categories:
Below 25th Percentile (Low Temp Weeks)
25th to 75th Percentile (Normal Temp Weeks)
Above 75th Percentile (High Temp Weeks)
Using this approach, we grouped thousands of weeks of wheat futures data and examined how price returns behaved under each condition. This way, we could compare a “hot” week in Ukraine to a “hot” week in the U.S. Midwest—apples to apples.
🔄 Section 4: Data-Driven Temperature Categories and Wheat Returns
To move beyond anecdotes and headlines, we then calculated weekly percent returns for wheat futures (ZW) for each of the three percentile-based categories.
What we found was surprising.
Despite common assumptions that hotter weeks push wheat prices higher, the average returns didn’t significantly increase during high-temperature periods. However, something else did: volatility.
In high-temp weeks, prices swung more violently — up or down — creating wider return distributions. But the direction of these moves lacked consistency. Some heatwaves saw spikes, others fizzled.
This insight matters. It means that extreme heat amplifies risk, even if it doesn't create a reliable directional bias.
Traders should prepare for greater uncertainty during hot weeks — an environment where tools like micro wheat futures (MZW) are especially useful. These contracts let traders scale exposure and control risk in turbulent market conditions tied to unpredictable weather.
🔬 Section 5: Statistical Shock—The t-Test Revelation
To confirm our findings, we ran two-sample t-tests comparing the returns during low vs. high temperature weeks. The goal? To test if the means of the two groups were statistically different.
P-Value (Temp Impact on Wheat Returns): 0.354 (Not Significant)
Conclusion: We cannot reject the hypothesis that average returns during low and high temp weeks are the same.
This result is counterintuitive. It flies in the face of narratives we often hear during weather extremes.
However, our volatility analysis (using boxplots) showed that variance in returns increases significantly during hotter weeks, making them less predictable and more dangerous for leveraged traders.
🧠 Section 6: What Traders Can Learn from This
This analysis highlights a few key lessons:
Narratives aren’t always backed by data. High heat doesn’t always mean high prices.
Volatility increases during weather stress. That’s tradable, but not in the way many assume.
Risk-adjusted exposure matters. Micro wheat futures (MZW) are ideal for navigating weather-driven uncertainty.
Multi-factor analysis is essential. Weather alone doesn’t explain price behavior. Global supply chains, speculative flows, and other crops’ performance all play a role.
This article is part of a growing series where we explore the relationship between weather and agricultural futures. From corn to soybeans to wheat, each crop tells a different story. Watch for the next release—we’ll be digging deeper into more effects and strategies traders can use to capitalize on weather.
When charting futures, the data provided could be delayed. Traders working with the ticker symbols discussed in this idea may prefer to use CME Group real-time data plan on TradingView: tradingview.sweetlogin.com - This consideration is particularly important for shorter-term traders, whereas it may be less critical for those focused on longer-term trading strategies.
General Disclaimer:
The trade ideas presented herein are solely for illustrative purposes forming a part of a case study intended to demonstrate key principles in risk management within the context of the specific market scenarios discussed. These ideas are not to be interpreted as investment recommendations or financial advice. They do not endorse or promote any specific trading strategies, financial products, or services. The information provided is based on data believed to be reliable; however, its accuracy or completeness cannot be guaranteed. Trading in financial markets involves risks, including the potential loss of principal. Each individual should conduct their own research and consult with professional financial advisors before making any investment decisions. The author or publisher of this content bears no responsibility for any actions taken based on the information provided or for any resultant financial or other losses.
Agricultural
Weather and Corn: A Deep Dive into Temperature Impact1. Introduction: Corn and Climate – An Inseparable Relationship
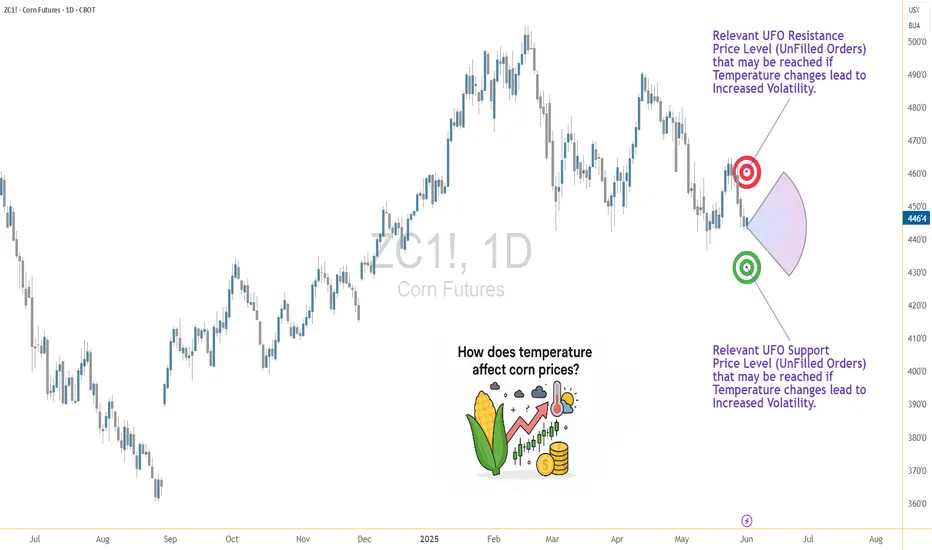
For traders navigating the corn futures market, weather isn't just a background noise—it's a market mover. Few agricultural commodities are as sensitive to environmental variables as corn, especially temperature. Corn is grown across vast regions, and its development is directly tied to how hot or cold the season plays out. This makes weather not just a topic of interest but a core input in any corn trader’s playbook.
In this article, we go beyond conventional wisdom. Instead of simply assuming “hotter equals bullish,” we bring data into the equation—weather data normalized by percentile, matched with price returns on CME Group's corn futures. The results? Useful for anyone trading ZC or MZC contracts.
2. How Temperature Affects Corn Physiology and Yields
At the biological level, corn thrives best in temperatures between 77°F (25°C) and 91°F (33°C) during its growth stages. During pollination—a critical yield-defining window—extreme heat (especially above 95°F / 35°C) can cause irreversible damage. When hot weather coincides with drought, the impact on yields can be catastrophic.
Historical drought years like 2012 and 1988 serve as powerful examples. In 2012, persistent heat and dryness across the US Midwest led to a national yield drop of over 25%, sending futures skyrocketing. But heat doesn't always spell disaster. Timing matters. A heat wave in early June may have little impact. That same wave during tasseling in July? Major consequences.
3. The Market Mechanism: How Traders Respond to Temperature Surprises
Markets are forward-looking. Futures prices don’t just reflect today’s weather—they reflect expectations. A dry June may already be priced in by the time USDA issues its report. This dynamic creates an interesting challenge for traders: separating noise from signal.
During July and August—the critical reproductive phase—temperature updates from NOAA and private forecasters often trigger major moves. Rumors of an incoming heat dome? Corn futures might gap up overnight. But if it fizzles out, retracements can be just as dramatic. Traders who rely on headlines without considering what’s already priced in are often late to the move.
4. Our Analysis: What the Data Reveals About Corn and Temperature
To cut through the fog, we performed a percentile-based analysis using decades of weather and price data. Rather than looking at raw temperatures, we classified each week into temperature “categories”:
Low Temperature Weeks: Bottom 25% of the historical distribution
Normal Temperature Weeks: Middle 50%
High Temperature Weeks: Top 25%
We then analyzed weekly percentage returns for the corn futures contract (ZC) in each category. The outcome? On average, high-temperature weeks showed higher volatility—but not always higher returns. In fact, the data revealed that some extreme heat periods were already fully priced in, limiting upside.
5. Statistically Significant or Not? T-Tests and Interpretation
To test whether the temperature categories had statistically significant impacts on weekly returns, we ran a t-test comparing the “Low” vs. “High” temperature groups. The result: highly significant. Corn returns during high-temperature weeks were, on average, notably different than those during cooler weeks, with a p-value far below 0.01 (4.10854357245787E-13).
This tells us that traders can't ignore temperature anomalies. Extreme heat does more than influence the narrative—it materially shifts price behavior. That said, the direction of this shift isn't always bullish. Sometimes, high heat correlates with selling, especially if it’s viewed as destructive beyond repair.
6. Strategic Takeaways for Corn Traders
Traders can use this information in several ways:
Anticipatory Positioning: Use temperature forecasts to adjust exposure ahead of key USDA reports.
Risk Management: Understand that volatility spikes in extreme temperature conditions and plan stops accordingly.
Calendar Sensitivity: Prioritize weather signals more heavily in July than in May, when crops are less vulnerable.
Combining weather percentile models with weekly return expectations can elevate a trader’s edge beyond gut feel.
7. CME Group Corn Futures and Micro Corn Contracts
Corn traders have options when it comes to accessing this market. The flagship ZC futures contract from CME Group represents 5,000 bushels of corn and is widely used by commercial hedgers and speculators alike. For those seeking more precision or lower capital requirements, the recently launched Micro Corn Futures (MZC) represent just 1/10th the size.
This fractional sizing makes temperature-driven strategies more accessible to retail traders, allowing them to deploy seasonal or event-based trades without excessive risk exposure.
Here are some quick key points to remember:
Tick size for ZC is ¼ cent (0.0025) per bushel, equating to $12.50 per tick.
For MZC, each tick is 0.0050 equating to $2.50 per tick.
Standard ZC initial margin is approximately $1,000 and MZC margins are around $100 per contract, though this can vary by broker.
8. Wrapping Up: Temperature's Role in a Complex Equation
While temperature is a key driver in corn futures, it doesn't act in isolation. Precipitation, global demand, currency fluctuations, and government policies also play crucial roles. However, by quantifying the impact of extreme temperatures, traders gain a potential edge in anticipating market behavior.
Future articles will expand this framework to include precipitation, international weather events, and multi-variable models.
This article is part of a broader series exploring how weather impacts the corn, wheat, and soybean futures markets. Stay tuned for the next release, which builds directly on these insights.
When charting futures, the data provided could be delayed. Traders working with the ticker symbols discussed in this idea may prefer to use CME Group real-time data plan on TradingView: tradingview.sweetlogin.com - This consideration is particularly important for shorter-term traders, whereas it may be less critical for those focused on longer-term trading strategies.
General Disclaimer:
The trade ideas presented herein are solely for illustrative purposes forming a part of a case study intended to demonstrate key principles in risk management within the context of the specific market scenarios discussed. These ideas are not to be interpreted as investment recommendations or financial advice. They do not endorse or promote any specific trading strategies, financial products, or services. The information provided is based on data believed to be reliable; however, its accuracy or completeness cannot be guaranteed. Trading in financial markets involves risks, including the potential loss of principal. Each individual should conduct their own research and consult with professional financial advisors before making any investment decisions. The author or publisher of this content bears no responsibility for any actions taken based on the information provided or for any resultant financial or other losses.
Can Rice Solve Global Challenges?Rice, a staple that feeds half the world's population, is navigating through an era marked by market turbulence, international rivalries, and groundbreaking innovation. In Japan, an unprecedented governmental intervention has been enacted to stabilize soaring rice prices, showcasing the delicate balance between supply, demand, and consumer welfare. By releasing nearly 210,000 tonnes of rice reserves, Japan aims to quell the price surge exacerbated by climatic extremes and supply chain disruptions, reflecting a broader narrative on how nations can manage food security in the face of environmental challenges.
Meanwhile, the global rice landscape is being reshaped by geopolitical maneuvers, particularly in the contest over Basmati rice. Pakistan's recent diplomatic victories in securing recognition for its Basmati in key markets underline the economic and cultural significance of rice varieties, challenging us to reconsider how heritage, origin, and trade laws intertwine in modern commerce. This development affects market shares and prompts a reflection on the importance of intellectual property in agriculture.
On the technological frontier, Chinese scientists are redefining rice's nutritional profile through gene editing, introducing Coenzyme Q10 into this traditional grain. This leap forward in biofortification could revolutionize plant-based diets, offering a sustainable solution to nutritional deficiencies. It invites us to ponder how far science can go in enhancing our food's health benefits while maintaining its cultural essence.
Finally, Vietnam's volatile export market dynamics serve as a reminder of the commodity's cyclical nature. With prices falling from their peak, the industry's resilience is tested, pushing for strategic adjustments in market expansion and financial resilience. This scenario challenges stakeholders to innovate in market strategies and support systems, ensuring that rice continues to be a stable, accessible food source worldwide. Together, these narratives paint a picture of rice not just as a simple grain but as a complex player in global economics, politics, and science.
Options Blueprint Series [Basic]: Corn Futures and PPI InsightsIntroduction to Corn Futures Market Sentiment
Corn Futures are capturing the interest of traders as technical indicators and economic fundamentals align in a potential bullish setup. Currently, the Corn Producer Price Index (PPI) shows a Commodity Channel Index (CCI) bullish crossover, indicating a possible uptrend in prices. Corn Futures have followed suit with an earlier CCI bullish crossover, adding strength to the view that Corn prices could see upward momentum in the coming months.
As Corn Futures reflect early signals of a shift in market sentiment, this article explores a straightforward yet effective Bull Call Spread strategy using June 2025 options. By leveraging these CCI signals and key resistance levels, traders could position themselves to benefit from a potential rise in Corn prices while maintaining a controlled risk profile.
Corn Futures Contract Specifications and Margin Requirements
Understanding the specifications of Corn Futures is essential for managing both position size and margin requirements effectively. Here’s a quick breakdown:
Price Tick Size: The minimum fluctuation is 0.0025 cents per bushel, equivalent to $12.50 per tick.
Margin Requirement: Approximately $1,000 per contract, although this can vary based on broker and market conditions.
Analysis of Key Indicators and Market Setup
Two primary indicators support the bullish case for Corn Futures: the CCI bullish crossover in both the Corn Futures and the Corn PPI. The CCI, a momentum-based indicator, identifies potential trend reversals by highlighting overbought and oversold conditions. The recent CCI bullish crossover in Corn Futures suggests early buying pressure, while the subsequent crossover in the Corn PPI confirms this trend on the economic front.
This alignment between technical and economic indicators provides a potentially unique opportunity for options traders to capture potential upward movement, particularly as Corn prices approach critical resistance levels in front of a potential breakout.
Identifying Key Resistance Levels for Corn Futures
Resistance levels play a crucial role in setting realistic targets and managing expectations. In the current Corn Futures landscape, the primary resistance level for the front contract is observed around 550. For our target contract, ZCN2025 (July 2025), this resistance translates to approximately 485 due to the effects of contango/backwardation.
These resistance levels serve as benchmarks for setting exit targets in a Bull Call Spread. If Corn prices rally towards this zone, it could provide a favorable exit opportunity while maintaining a controlled risk-to-reward structure.
The Bull Call Spread Strategy Setup
In this setup, we employ a Bull Call Spread using options with a June 20, 2025, expiration date. This strategy is ideal for capturing moderate upside movement while limiting downside risk through a capped loss. Here’s the specific setup:
Long Position: Buy the 460 Call for a premium of 25.41.
Short Position: Sell the 490 Call for a premium of 15.87.
By buying the 460 Call and simultaneously selling the 490 Call, we establish a Bull Call Spread that allows us to benefit from price increases up to the 490 strike level. This setup reduces the net cost of the trade while capping the profit potential at the 490 strike price, aligning with our outlook based on resistance levels.
Net Premium (Cost): 25.41−15.87=9.54.
Reward-to-Risk Analysis
A Bull Call Spread provides a straightforward way to define both maximum profit and loss at the outset. Here’s a closer look:
Maximum Profit: Achieved if Corn Futures price rises to or above the 490 strike level at expiration = (490−460)−9.54=20.46.
Maximum Loss: Limited to the net premium paid = 9.54.
Breakeven Point: 469.54, calculated by adding the net premium to the 460 strike.
This structure results in a reward-to-risk ratio of approximately 2.14:1.
Forward-Looking Trade Plan and Execution Strategy
This Bull Call Spread strategy is structured with specific entry and exit conditions in mind:
Entry Condition: Triggered once the ZC1! (continuous Corn Futures contract) surpasses the prior month’s high at 434'2. This confirmation aligns the technical breakout with the ongoing bullish trend indicated by the CCI and PPI crossovers.
Target Exit: Based on the resistance level, the target for this trade is 485 on the ZCN2025 contract. Reaching this level would allow for a strategic exit with a maximum profit potential.
Alternative Exit: If Corn Futures prices fail to sustain the breakout or if technical indicators weaken significantly, an early exit can be considered to limit losses or preserve gains.
By setting these clear parameters, the trade plan maintains discipline, helping traders avoid reactive decision-making and align with the predefined strategy.
Risk Management Essentials
Effective risk management is crucial, especially when trading options. Here are some best practices:
Stop-Loss Strategy: For options traders, a stop-loss can be set based on a percentage of the premium paid or by monitoring underlying futures price action.
Position Sizing: Limit the size of the position relative to the account balance to avoid overexposure. This is especially relevant for volatile markets like Corn.
Discipline and Emotional Control: Stick to the plan, avoid emotional reactions to market noise, and adhere to entry and exit conditions.
Risk management ensures that even if the trade does not perform as expected, losses are limited and capital is preserved for future opportunities.
When charting futures, the data provided could be delayed. Traders working with the ticker symbols discussed in this idea may prefer to use CME Group real-time data plan on TradingView: tradingview.sweetlogin.com - This consideration is particularly important for shorter-term traders, whereas it may be less critical for those focused on longer-term trading strategies. Also, some of the calculations and analytics used in this article have been derived using the QuikStrike® tool available on the CME Group website.
General Disclaimer:
The trade ideas presented herein are solely for illustrative purposes forming a part of a case study intended to demonstrate key principles in risk management within the context of the specific market scenarios discussed. These ideas are not to be interpreted as investment recommendations or financial advice. They do not endorse or promote any specific trading strategies, financial products, or services. The information provided is based on data believed to be reliable; however, its accuracy or completeness cannot be guaranteed. Trading in financial markets involves risks, including the potential loss of principal. Each individual should conduct their own research and consult with professional financial advisors before making any investment decisions. The author or publisher of this content bears no responsibility for any actions taken based on the information provided or for any resultant financial or other losses.

The jury is still out on the impact of El NiñoWeather has always been a key factor influencing the outlook for major commodities, especially agricultural commodities. The arrival of El Niño in June 2023 has led to a wide divergence in the performance across agricultural commodities. As discussed in our previous blog “What does El Niño’s return mean for commodities?”, the effects of El Niño include specific wind patterns across the Pacific Ocean, heavy rain in South America, and droughts in Australia and parts of Asia including India and Indonesia. This is why certain commodities such as cocoa, sugar, soybean oil and grains tend to depict a price positive environment following an El Niño phenomena. So far in 2023 – cocoa, sugar and cotton have been key beneficiaries of the El Niño weather phenomena whilst wheat, corn and soybeans have posted a weaker performance.
How is the El Niño evolving?
With the National Oceanic Atmospheric Administration (NOAA) forecasting more than a 95% probability of El Niño continuing through the Northern Hemisphere winter through January - March 2024 , chances are high that we continue to see further weather abnormalities over the coming months. There is now around a 71% chance that this event peaks as a strong El Niño this winter1.
The main El Niño monitoring metric showed the average sea surface temperature in the central and eastern equatorial Pacific Ocean—was 1.3˚Celsius (2.3˚Fahrenheit) above the long-term average in August, up from 1˚C in July1. The whole ocean (Pacific, Atlantic, Indian, Artic and Southern Ocean ) was over 1˚C above the 20th-century average in August, the first time that’s happened in the 174-year record2.
An important aspect of ocean changes is the sea level height. Presently there is a strong ocean sea level rise in the easterly tropical Pacific, a clear sign that El Niño is active3. The changes in the ocean heat content are mainly due to the expansion and rise of the strong subsurface warm pool. This also causes the sea level height to increase, usually associated with warmer waters.
Agricultural commodities price response to El Niño will vary
The growing of agricultural products is sensitive to weather patterns. For some crops, El Niño could boost production, while for others it could damage production. This is because the drift in warm water across the Pacific moves’ evaporation and rain such that Southeast Asia and Australia tend to get drier while Peru and Ecuador tend to receive more precipitation. Should the weather event intensify, it could be a significant catalyst for price gains in cocoa, soybean oil, sugar, and grains as discussed in “What does El Niño’s return mean for commodities?” blog.
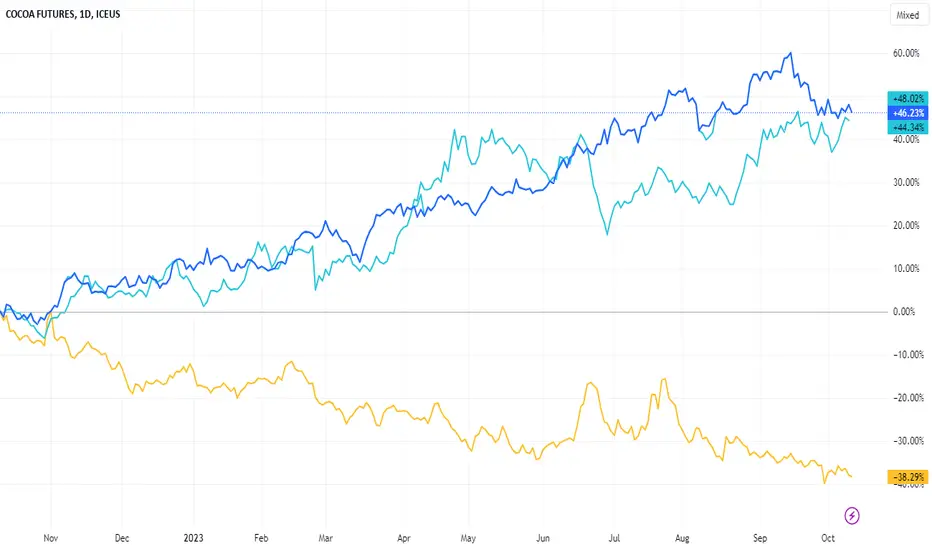
Cocoa and sugar lead the commodity scoreboard in El Niño ’s slipstream
Cocoa has been an important beneficiary of the El Niño. The concentration of supply in West Africa, nearly 70% of global supply4, underlines the outsized impact of the region’s weather patterns on the world’s cocoa supplies and prices. The emerging El Niño is likely to hamper the next main crop that begins in October as it tends to bring dry and hot conditions to West Africa. This comes at a time when heavy rains in West Africa have triggered the Cocoa Swollen Shoot Virus Disease (CSSVD) and the spread of Black pod diseases. The diseases alongside the high cost of inputs, have not spared the two leading producers (i.e., Côte d’Ivoire and Ghana) and affected their volume of production5. Despite high cocoa prices, demand evident from cocoa grinding continues to rise in Asia and the US6.
Sugar has also benefitted from the emergence of El Niño as lower rainfall in Asia, namely India and Thailand have resulted in lower sugar production. However, we expect further upside for sugar prices to be capped as Brazil (the world’s largest producer and exporter) is likely to fill the gap. Production in Brazil’s main Centre- South (CS) growing region between the start of the crop year in April and mid-August already amounted to 22.7mn tons, which is up 22% over the same period last year7. What’s more, the sugar mix increased to 51.1% in H1 September, up from 50.7% in H2 August signalling that Brazilian mills continue to favour sugar production over ethanol amidst higher sugar prices5. Extreme weather conditions in China have reduced domestic supplies. China is also planning to release 1.3mn tons of sugar from its reserves, to increase domestic supplies and stabilise prices4.
Wheat prices stand to benefit as key producers to face the impact of El Niño
On the other end of the spectrum, grains (namely wheat, corn and soybeans) continued to struggle as the United States Department of Agriculture (USDA) outlined a more bearish outlook for corn while bullish for wheat. The corn harvest is progressing well with 15% of the crop harvested, up from 11% at the same stage last year and also above the five-year average of 13%8. Moscow’s revocation of the secure grain’s corridor through the Black Sea, alongside the Russian attacks on key infrastructure along the Danube River in Ukraine, have lowered grains exports from Ukraine by 25% over the prior year. Yet wheat prices have fallen sharply this year as Russia’s record crop is enabling it to ship huge volumes to world markets.
The Grain Industry Association of Western Australia has likewise reduced its crop forecast for the region by 1.5 million tons to 8.5 million tons. Most of Australia is expected to face warm and dry conditions over the next three months9, so further downward revisions are on the cards. Argentinian farmers are also battling with a drought. The Buenos Aires Grain Exchange has already warned that the crop in 2023/24 could be impaired if there is no rainfall in the near future. As the prospects for the wheat crop amongst major producer countries are becoming increasingly weak, we expect wheat to benefit from these rising tailwinds.
Conclusion
There has been a wide divergence within the commodity linked Exchange Traded Funds (ETF) flows since the start of the year. Agriculture linked ETFs have seen US$458mn worth of outflows while energy linked commodity ETFs raked in US$1.2Bn worth of inflows10. Agriculture linked commodity ETFs likely faced outflows owing to profit taking. We continue to expect plenty of upside in select agricultural commodities as the impact of the El Niño is likely to intensify over the upcoming winter.
This material is prepared by WisdomTree and its affiliates and is not intended to be relied upon as a forecast, research or investment advice, and is not a recommendation, offer or solicitation to buy or sell any securities or to adopt any investment strategy. The opinions expressed are as of the date of production and may change as subsequent conditions vary. The information and opinions contained in this material are derived from proprietary and non-proprietary sources. As such, no warranty of accuracy or reliability is given and no responsibility arising in any other way for errors and omissions (including responsibility to any person by reason of negligence) is accepted by WisdomTree, nor any affiliate, nor any of their officers, employees or agents. Reliance upon information in this material is at the sole discretion of the reader. Past performance is not a reliable indicator of future performance.
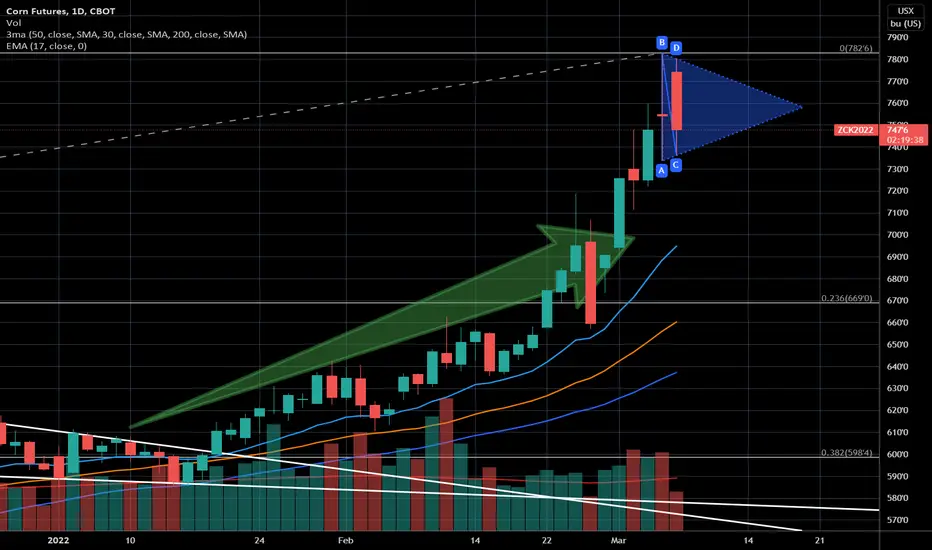
➡Ready for the following corn level? 💥I'm still invested with the rest of my original position long in corn, but I'm ready to scale out completely. But just now, I've noticed that the highs and lows from yesterday and today COULD form a beautiful symmetric triangle. So in this uptrend, this could be a chart pattern that indicates a continuation of the existing trend in corn.
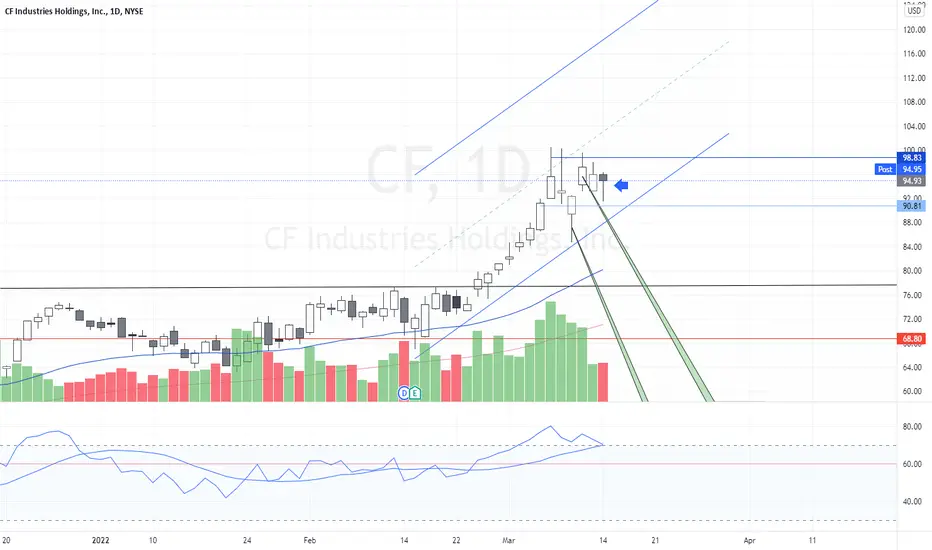
Position is open CF CF Industries Holdings, Inc. manufactures and sells hydrogen and nitrogen products for energy, fertilizer, emissions abatement, and other industrial activities worldwide. Its principal products include anhydrous ammonia, granular urea, urea ammonium nitrate, and ammonium nitrate products. The company also offers diesel exhaust fluid, urea liquor, nitric acid, and aqua ammonia products; and compound fertilizer products with nitrogen, phosphorus, and potassium.
It primarily serves cooperatives, independent fertilizer distributors, traders, wholesalers, and industrial users. The company was founded in 1946 and is headquartered in Deerfield, Illinois.
COCOA is tapping on the resistance of recent trading rangeNIB (cocoa ETN) is pushing against the top of the trading range. Cocoa has been consolidating for around two month now. Since I am long term bullish on agricultural commodities such as cocoa, if/when the top of the range is taken out, I expect quick run up as most of these commodities tend to have unidirectional run. First target is $32.80 range and next is the yellow down trend line. When and if that trend line is taken, I expect bigger upward move.
Have a good trade everyone,
T.

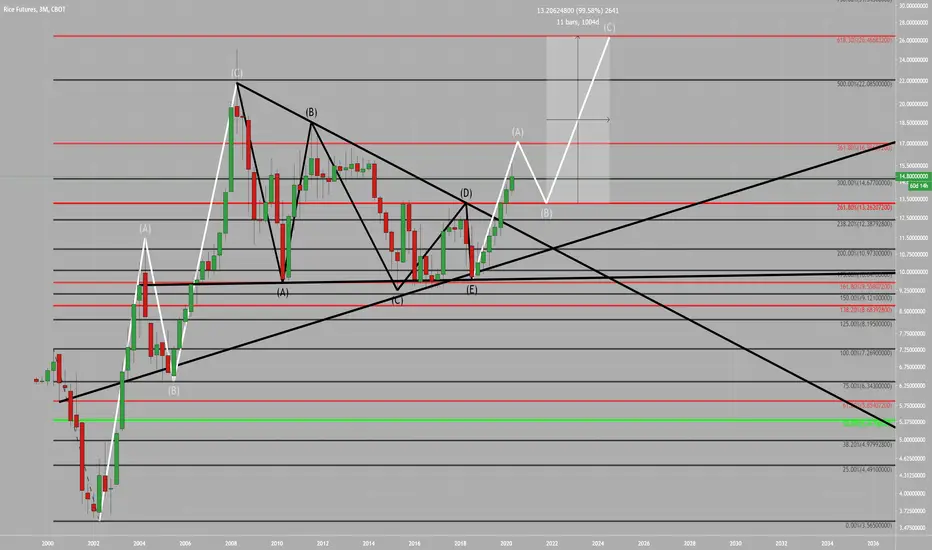
Rice Futures Breakout and Wave CountA major 3 wave followed by a triangular consolidation followed by another major 3 wave?
Rice is a basic human commodity needed by many to survive; interesting that it is rising despite the fact that many other agricultural commodities like soy and corn are falling.
Much Love
GL HF
xoxo
snoop