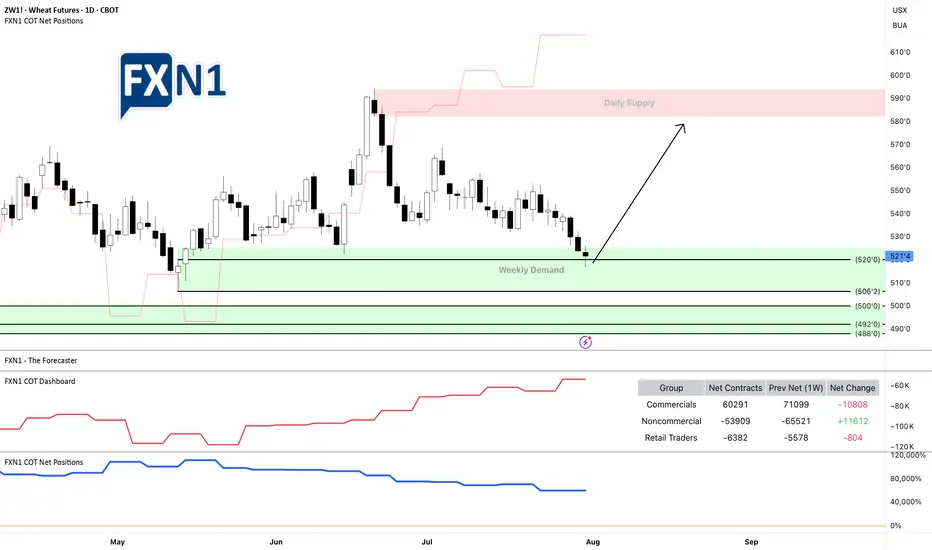
Is Wheat ZW1 Ready for a Long Trade? Key Demand Area InsightsThe futures of Wheat ZW1! are reaching a weekly demand zone, where we observe non-commercials going long and retail traders holding short positions. This could present a potential setup for a long trade. Note: There is another demand area below, but the positions of commercials are less clear compared to non-commercials and retail traders.
Always manage your risk carefully if you agree with my analysis, and be sure to develop your own trading plan.
✅ Please share your thoughts about ZW1! in the comments section below and HIT LIKE if you appreciate my analysis. Don't forget to FOLLOW ME; you will help us a lot with this small contribution.
Agricultural Commodities
COTTON QUICK TRADE: Low Risk, High Reward Setup!🚨 COTTON HEIST ALERT: Bullish Bank Robbery in Progress! (CFD/Commodity Raid Plan) 🚨
Thief Trader’s Master Loot Strategy – Long Entry, Escape Before the Cops Arrive!
🌟 Greetings, Fellow Market Bandits! 🌟
Hola! Bonjour! Hallo! Marhaba! 🤑💸 Money Makers & Midnight Robbers, it’s time to execute the COTTON COMMODITY HEIST with precision. Based on 🔥Thief Trading Style Analysis🔥, this is your VIP invite to the biggest bullish swipe of the season.
🔓 THE VAULT IS OPEN – ENTRY PLAN (LONG RAID)
📈 "Break the Lock & Loot!"
Ideal Entry: Buy limit orders within 15-30min pullbacks (swing lows/highs).
Pro Thief Move: Layer your entries (DCA-style) for maximum stealth.
Aggressive Robbers: Charge in directly if liquidity is high.
🚨 STOP-LOSS (ESCAPE ROUTE)
🛑 "Hide Your Loot or Get Busted!"
Place SL below the nearest swing low (5H MA @ 65.20).
Adjust based on your risk tolerance & loot size (multiple orders = tighter escape).
🎯 TARGET: CASH OUT BEFORE THE COPS ARRIVE!
🏴☠️ Take Profit Zone: 70.00 (or escape earlier if the market turns shaky!)
Scalpers: Trailing SL = your best ally. Stick to LONG-ONLY quick hits!
Swing Bandits: Ride the wave but don’t get greedy—exit before the pullback trap!
🔥 WHY THIS HEIST WILL WORK (BULLISH CATALYSTS)
🧵 Cotton’s Price Surge Fueled By:
Supply Squeeze (Storage/Inventory Data 📉).
COT Report Shows Big Money Going Long 🏦.
Seasonal Trends + Macro Sentiment Shift ☀️📈.
Intermarket Signals Aligning (Commodity Supercycle?).
(Full analysis? Check the FUNDAMENTALS & KLICKK! 👉🔗)
⚠️ WARNING: NEWS TRAPS & VOLATILITY AHEAD
📰 "Cops (News Events) Can Crash the Party!"
Avoid new trades during high-impact news (liquidity dries up = slippage risk!).
Lock profits with trailing stops—don’t let the market reverse-steal your gains!
💥 BOOST THIS HEIST – STRONGER GANG = MORE LOOT!
💖 "Smash the 👍 LIKE button to support the crew!"
More boosts = more heist plans (next target: OIL? GOLD? STOCKS?).
Daily profit raids await—follow & stay tuned! 🤝
🚀 See you at the escape zone, bandits!💨
🎯 FINAL THIEF TRADER RULE:
"Steal Fast, Exit Faster—No Prison Trades!" 🏃♂️💨
CORN Heist: Steal Short Profits Before Bulls React!🚨 CORN HEIST ALERT: Bearish Raid Ahead! 🚨 Swipe the Loot Before Cops Arrive! 🌽🔻
🌟 Attention, Market Bandits & Profit Pirates! 🌟
🔥 Thief Trading Intel Report 🔥
The 🌽 CORN CFD market is setting up for a bearish heist—time to short-swipe the loot before the bulls rally their defenses! Police barricade (resistance) is holding strong, but oversold conditions + consolidation hint at a trend reversal trap. High-risk, high-reward—just how we like it!
🎯 Heist Strategy (Swing/Day Trade)
Entry (Bearish Raid) 🏴☠️
"Vault’s unlocked! Swipe shorts at any price—OR set sell limits *near 15M/30M pullbacks for a cleaner steal!"*
Stop Loss (Escape Route) 🛑
Thief’s SL at nearest 4H swing high (4.170)—adjust based on your risk tolerance & lot size.
Pro Tip: Tighten SL if trading multiple orders!
Target (Profit Escape) 🎯
3.920 (or bail early if cops (bulls) show up!)
🌽 Market Snapshot: Why CORN is Ripe for a Raid
Neutral trend leaning bearish—consolidation breakout likely!
Key Drivers:
Macro pressure (USD strength, crop reports)
COT data hinting at big players positioning short
Seasonal trends favoring downside
Want full intel? 🔍 Check COT reports & intermarket analysis!
🚨 Trading Alerts (Avoid the Cops!)
News = Volatility Trap! 📰🚔
Avoid new trades during high-impact news.
Trailing stops to lock profits on running heists!
💥 Boost This Heist! 💥
"Like & boost this idea to fuel our next raid! More steals = more profits for the gang! 🏴☠️💰
Stay tuned—another heist drops soon! 🚀🤝
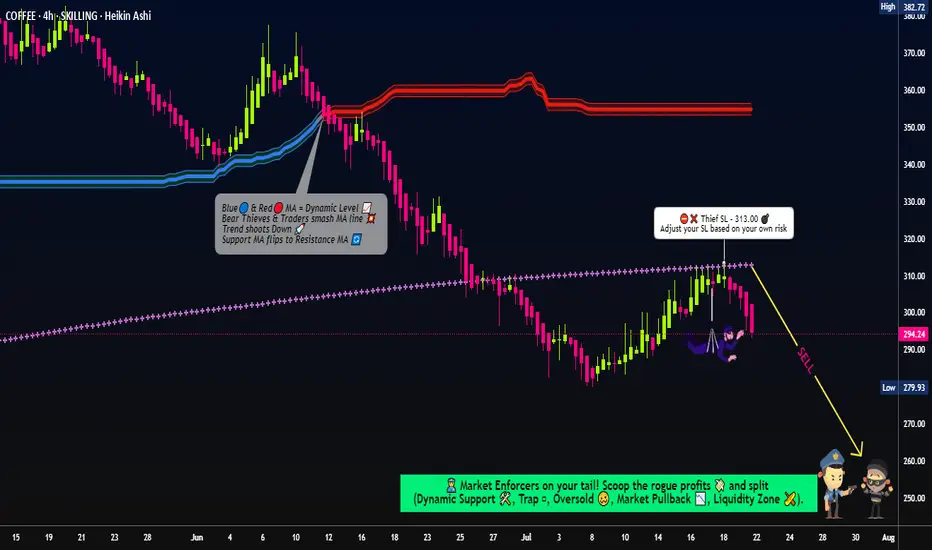
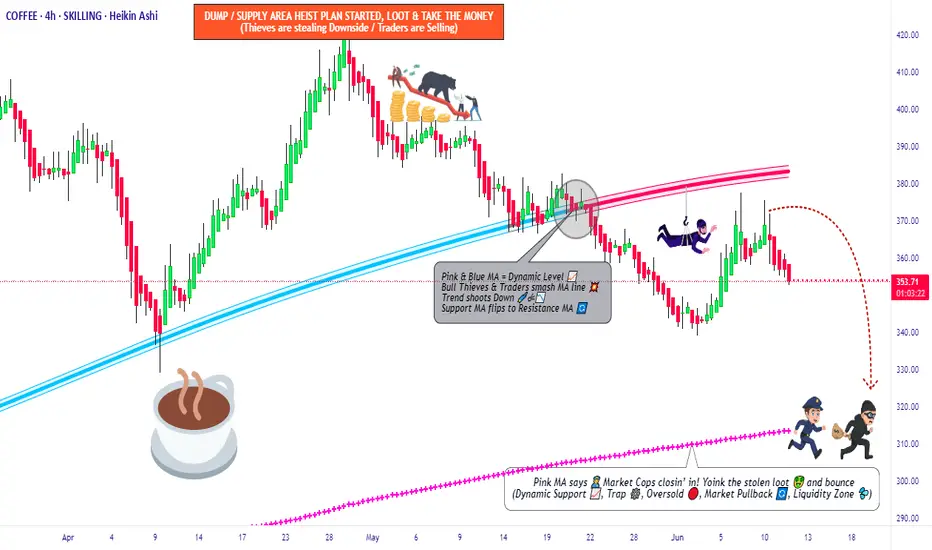
“COFFEE CFD Smash-and-Grab: Thieves’ Swing Trade Blueprint!"🚨☕ The Great "COFFEE" Market Heist 🚨💰
🌟Hi! Hola! Ola! Bonjour! Hallo! Marhaba!🌟
⚔️Dear Money Makers & Robbers, 🤑💸✈️
Get ready for the ultimate COFFEE Commodities CFD Market Heist! Based on our 🔥Thief Trading Style combining technical and fundamental analysis, here’s our master plan to snatch profits from the market vault.
💥 The Master Plan:
📉 Entry:
“The vault is wide open! Swipe the bearish loot at any price—our heist is on!”
💸 Use sell limit orders on the 15- or 30-minute timeframe, at the nearest swing high or low levels to lock in the perfect robbery spot. Thief (I"AM) using multiple limit orders (DCA / layering strategy style method of entries).
🛑 Stop Loss:
📌 Set your Thief SL at the nearest or swing high level of candle wick on the 4H timeframe (~313.00) to keep your loot safe.
📌 Adjust SL based on your trade risk, lot size, and multiple entry plan—don’t let the cops catch you!
🎯 Target:
Aim for 260.00 or escape before the target—take the loot and run!
👀 Scalpers’ Tip:
Only scalp on the Short Side! If you’ve got deep pockets, jump in big; otherwise, join swing traders to ride the heist. Use trailing SL to protect your loot.
💣 Market Vibes:
The “COFFEE” CFD market is trapped in bearish territory, fueled by:
🔎 Risky levels
🔎 Oversold zones
🔎 Consolidation
🔎 Trend reversal
🔎 Traps near levels where bullish robbers get strong.
📰🗞️ The Big Picture:
Check out the Fundamentals, Macro, COT Report, Quantitative Analysis, Sentimental Outlook, Intermarket Analysis, and Future Trend Targets to stay one step ahead! 👉👉👉
⚠️ Trading Alert:
News releases can rock the market vault!
🚨 Avoid new trades during big news
🚨 Use trailing SL to lock profits and guard your loot.
💥 Hit the Boost Button!
Supporting our Robbery Plan helps us all steal money with ease! 💰💵 Boost our robbery team’s strength, and trade with the Thief Trading Style to cash in every day. 💪🏆🤝🚀🎉
Stay tuned for our next heist plan—until then, keep those profits safe and stay sharp! 🤑🐱👤🤩
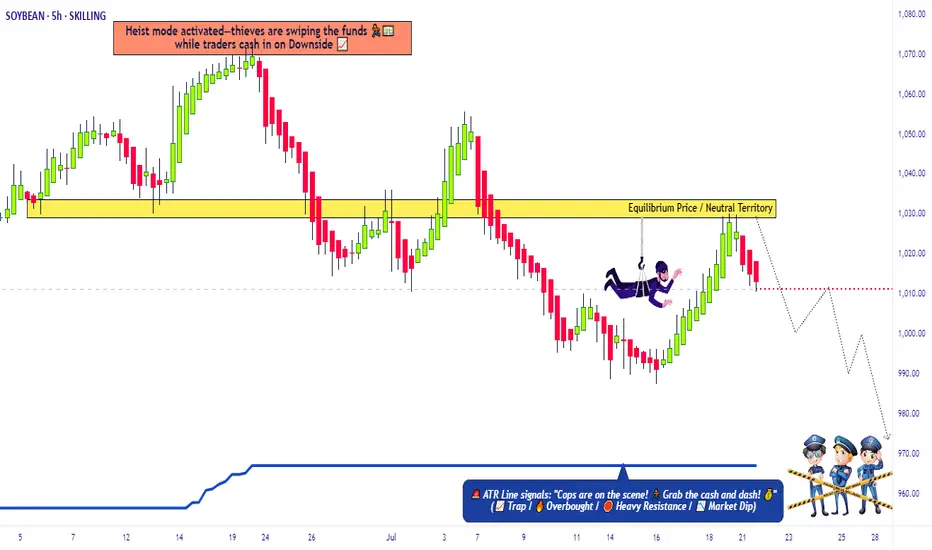
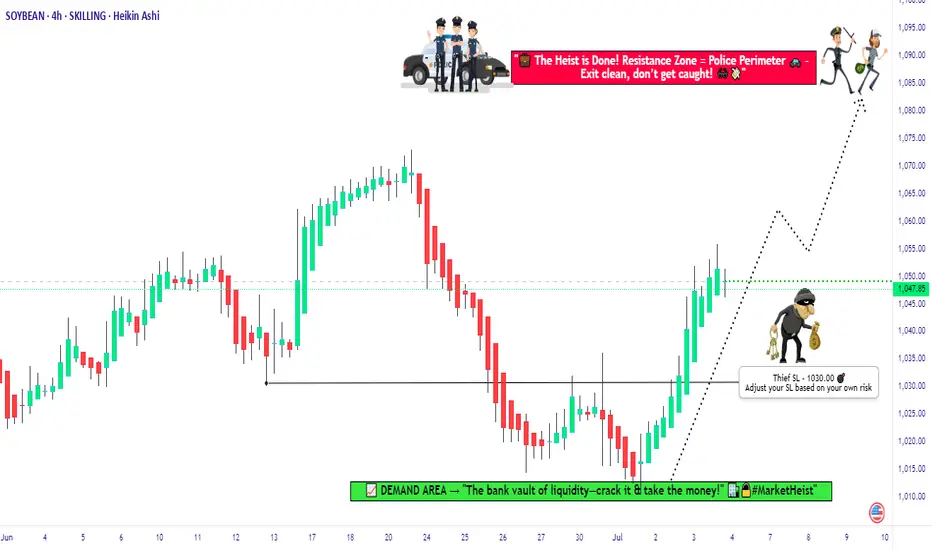
SoyBeans Price Reversal – Time to Swipe Bearish Profits🔓 Operation SoyBeans: Vault Breach Underway! 💼🌾
🌟Hi! Hola! Ola! Bonjour! Hallo! Marhaba!🌟
Calling All Market Bandits, Scalping Buccaneers & Swinging Looters 🕵️♂️💰💣
We've marked our next robbery target—the "SoyBeans" Commodities CFD Market.
This isn’t just a trade, it’s an orchestrated heist built off Thief Trading intelligence: a mix of technical traps, fundamental cues, and criminal market psychology. 🧠💸
🔎 🎯 Entry Point - Where the Safe Cracks Open:
The vault is wide open—grab bearish loot at any price!
But for maximum stealth, layer in buy limit orders on the pullback using the 15m or 30m timeframe near swing highs/lows.
(We thieves call this: DCA under the radar.) 🕳️📉
🛡️ 🚨Stop Loss - Our Escape Hatch:
Set SL at the nearest 4H candle wick swing high (1040.00).
Customize it based on your loot size (lot size), order count, & risk appetite.
A smart thief knows when to vanish! 🏃♂️💨
🏁 💰Target - The Vault Cash-Out Point:
Main Heist Target: 970.00
Or exit early if the cops (volatility) show up! 🚔🎯
💡 Scalper’s Note - Quick Grab & Dash:
If you’ve got a heavy bag 💼💸, scalp short aggressively.
If not, roll with the swing crew—use trailing SLs to lock the loot and flee clean. 💨📦
📉 Thief Insight – Why We're Robbing This Vault:
"SoyBeans" showing bearish breakdowns due to:
📰 COT Positioning
📦 Inventory & Storage Data
🕰️ Seasonal Weakness
💭 Sentiment Drift
🔗 Intermarket Signals
Get the full scoop—go dig deeper into your own thief intelligence sources. 📚🕵️♂️
⚠️ Stay Alert – Market Mayhem Incoming!
News drops = surveillance upgrades. Avoid new trades during major releases.
Protect running loot with tight trailing SLs—guard your stolen goods! 🛑🗞️📉
❤️🔥 Show Some Love to the Robbery Crew!
💥Smash that BOOST button💥 to fuel the Thief Army.
Together, we rob smarter. 💰🚀
🔔 Stay Tuned, Looters:
Another heist is being planned. Don't miss the next setup.
Money is out there… we just have to take it the thief way. 🧠💎
📜 Disclaimer:
This plan is for chart criminals in training 📉🕵️♂️ – not personalized financial advice.
Always assess your own risks before raiding any market vault.
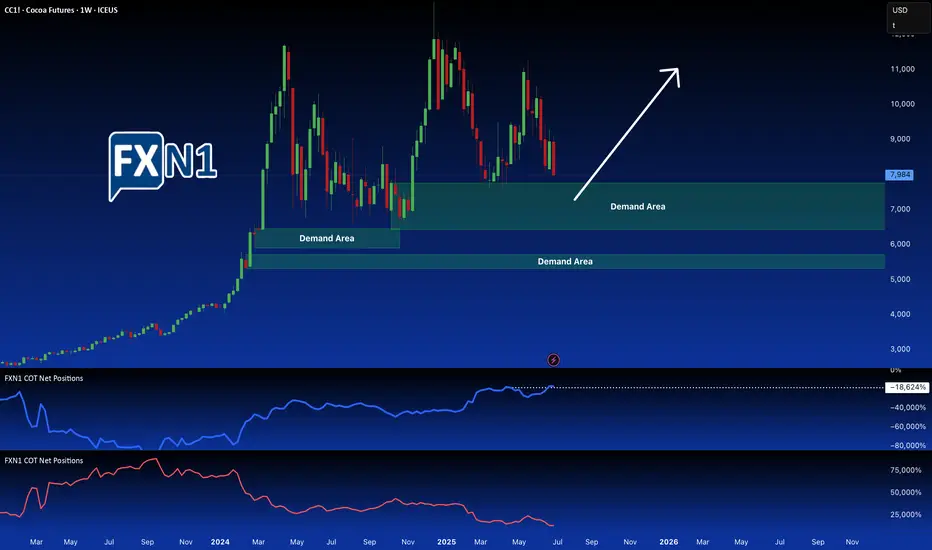
Cocoa Futures: CC1! Potential Pullback at Familiar Supply ZoneCocoa futures (CC1) are approaching a key demand zone previously tested in March 2025. This area, highlighted on the chart, presents a potential for a pullback, fueled by likely buy orders from commercial traders, as indicated by bullish sentiment evident in the latest Commitment of Traders (COT) report. We're watching for a reversal pattern within these highlighted zones, signaling a shift from the current upward trend. This anticipated pullback, driven by commercial market participation, could offer a compelling entry point for traders looking to capitalize on a potential reversal in the agricultural commodity.
✅ Please share your thoughts about CC1! in the comments section below and HIT LIKE if you appreciate my analysis. Don't forget to FOLLOW ME; you will help us a lot with this small contribution.
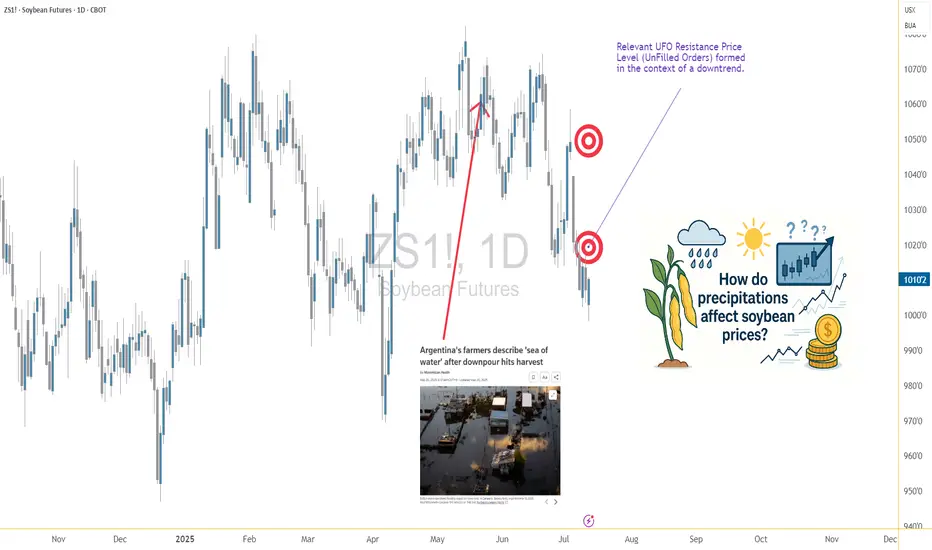
Soybeans and Rain: Moisture’s Market Impact on the Bean Trade1. Introduction: Moisture & Market Momentum
Soybeans, often referred to as “the oilseed king,” are a cornerstone of global agriculture. As a leading source of protein for both humans and animals, their price fluctuations affect industries ranging from food production to biofuels. One key variable traders often monitor? Rainfall. 🌧️
Moisture plays a critical role in soybean development, influencing yield and quality from the moment the seed is sown. It’s no surprise that many market participants assume a strong correlation between rainfall and price behavior. But is that assumption truly supported by data?
In this article, we analyze how varying precipitation levels impact weekly soybean futures returns. As you'll see, the results might not be as clear-cut as you’d expect—but they still offer meaningful insights.
2. Biological Realities: Soybeans’ Water Needs
Soybeans thrive under specific conditions. While they’re generally resilient, rainfall—or the lack thereof—can tip the balance between bumper harvests and disappointing yields.
During early vegetative stages, sufficient moisture ensures healthy root development. Later, during the pod-fill phase, rainfall becomes even more essential. Too little water at this point leads to incomplete pods or aborted seeds. On the flip side, too much rain can invite fungal diseases and delay harvests, especially in lower-lying regions.
In countries like Brazil and Argentina, soybean fields often face seasonal extremes, while the U.S. Midwest typically enjoys more consistent conditions—though droughts and floods have both hit the Corn Belt in recent years. These environmental realities create natural volatility in both yield and pricing expectations.
3. Methodology: How We Analyzed Weather vs. Futures
To explore the potential connection between rainfall and soybean futures prices, we collected weekly weather data for major soybean-growing cities across the globe. Each week’s precipitation was categorized using a normalized percentile system:
Low Rainfall: below the 25th percentile
Normal Rainfall: between the 25th and 75th percentiles
High Rainfall: above the 75th percentile
We then matched this data against weekly returns of standard soybean futures (ZS) and micro soybean futures (MZS), both traded on the CME Group.
This allowed us to compare average price behavior in different rainfall scenarios—and test whether there was any statistically significant difference between dry and wet weeks.
4. Statistical Findings: Is There a Signal in the Noise?
When examining the data, the initial visual impression from boxplots was underwhelming—return distributions across rainfall categories looked surprisingly similar. However, a deeper dive showed that the difference in mean returns between low and high precipitation weeks was statistically significant, with a p-value around 0.0013.
What does that mean for traders? While the signal may not be obvious to the naked eye, statistically, rainfall extremes do impact market behavior. However, the magnitude of impact remains modest—enough to be part of your strategy but not enough to drive decisions in isolation.
Soybean prices appear to be influenced by a mosaic of factors, with precipitation being just one tile in that complex picture.
5. Charting the Relationship: Visual Evidence
While statistical tests gave us the green light on significance, we know traders love to “see” the story too. Boxplots of weekly soybean futures returns segmented by rainfall categories offered a subtle narrative:
Low-precipitation weeks showed slightly higher average returns and tighter interquartile ranges.
High-precipitation weeks had broader return distributions and more frequent downside outliers.
Normal weeks exhibited relatively stable behavior, reinforcing the idea that the market reacts most during extremes.
This kind of visualization may not scream alpha at first glance, but it reinforces the idea that precipitation events—particularly dry spells—tend to nudge prices upward, possibly as market participants price in production risk.
6. Trading Implications: Positioning Around Weather
Here’s where things get practical. While weather alone won’t dictate every trading decision, it can be a key filter in a broader strategy. For soybean traders, rainfall data can help inform:
Bias assessment: Low-precipitation weeks may suggest bullish tendencies.
Risk control: Expect wider return distributions in high-precip weeks—adjust stops or contract sizing accordingly.
Event trading: Pair weather anomalies with technical signals like trendline breaks or volume surges for potential setups.
It’s also worth noting that weekly weather forecasts from reputable sources can serve as a forward-looking indicator, giving traders a head start before the market fully reacts.
7. Margin Efficiency with Micro Soybeans
For traders looking to scale into soybean exposure without the capital intensity of full contracts, the CME Group’s micro-sized futures offer a compelling alternative.
📌 Contract Specs for Soybean Futures (ZS):
Symbol: ZS
Contract size: 5,000 bushels
Tick size: 1/4 of one cent (0.0025) per bushel = $12.50
Initial margin: ~$2,100 (varies by broker and volatility)
📌 Micro Soybean Futures (MZS):
Symbol: MZS
Contract size: 500 bushels
Tick size: 0.0050 per bushel = $2.50
Initial margin: ~$210
These smaller contracts are perfect for strategy testing, risk scaling, or layering exposure around key macro events like WASDE reports or weather disruptions. For traders aiming to build weather-aligned positions, MZS is a powerful tool to balance conviction with capital efficiency.
8. Wrapping It All Together
Rain matters. Not just in fields, but in futures prices too. While soybean markets may not overreact to every drizzle or downpour, extreme rainfall conditions—especially drought—can leave noticeable footprints on price action.
For traders, this means opportunity. By incorporating precipitation metrics into your workflow, you unlock a new layer of context. One that doesn’t replace technical or fundamental analysis, but enhances both.
And remember: this article is just one piece of a larger exploration into how weather affects the commodity markets. Make sure you also read prior installments.
When charting futures, the data provided could be delayed. Traders working with the ticker symbols discussed in this idea may prefer to use CME Group real-time data plan on TradingView: tradingview.sweetlogin.com - This consideration is particularly important for shorter-term traders, whereas it may be less critical for those focused on longer-term trading strategies.
General Disclaimer:
The trade ideas presented herein are solely for illustrative purposes forming a part of a case study intended to demonstrate key principles in risk management within the context of the specific market scenarios discussed. These ideas are not to be interpreted as investment recommendations or financial advice. They do not endorse or promote any specific trading strategies, financial products, or services. The information provided is based on data believed to be reliable; however, its accuracy or completeness cannot be guaranteed. Trading in financial markets involves risks, including the potential loss of principal. Each individual should conduct their own research and consult with professional financial advisors before making any investment decisions. The author or publisher of this content bears no responsibility for any actions taken based on the information provided or for any resultant financial or other losses.
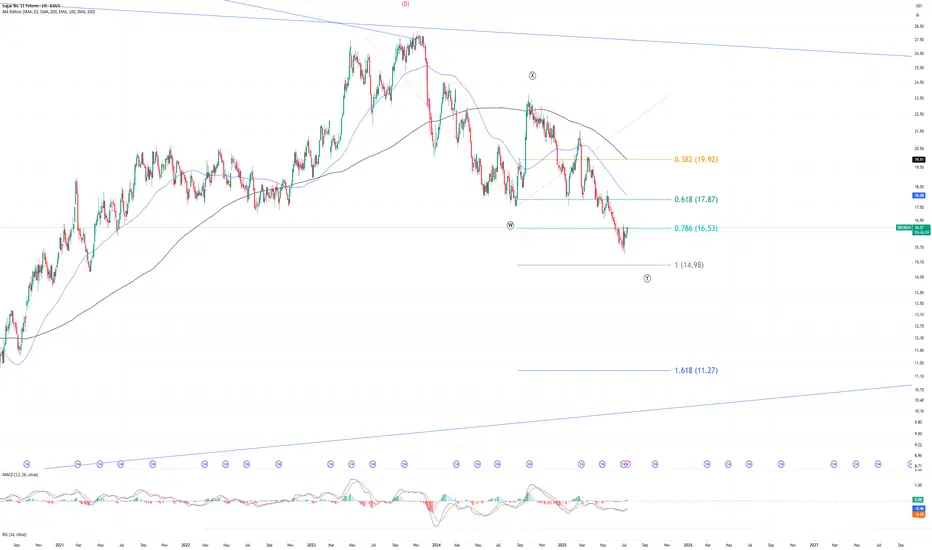
Sugar is entering into bullish marketSugar is entering a bull market. I expect a recovery this week or two. The minimum wave equality norm has been fulfilled, so we may see multi-year bullish growth. But we need to be careful not to fall into another, final low at $13-11.
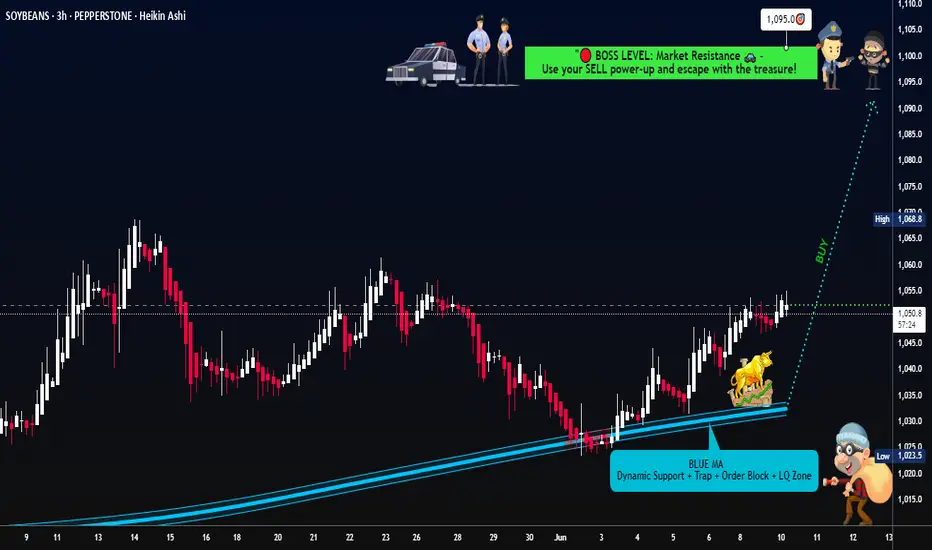
Soybean Breakout – Time to Steal Profits!🚨 "SOYBEAN HEIST ALERT: Bullish Loot Ahead! 🎯💰 (Thief Trading Strategy)"
🌟 Greetings, Market Pirates & Profit Raiders! 🌟
"The vault is unlocked—time to plunder the 🌱🍃SOYBEAN CFD market! Here’s your master plan for a smooth heist."
🔎 TRADE SETUP (Thief Edition)
Entry 📈: "Buy the dip or chase the breakout—bullish momentum is ripe for stealing!"
Pro Tip: Use buy limits near 15-30min pullbacks (swing lows/highs) for optimal theft.
Stop Loss 🛑: "Hide your loot!" Set SL at nearest 4H swing low (1030.00). Adjust based on your risk appetite.
Target 🎯: 1085.0 — or escape early if bears ambush!
⚡ SCALPERS’ NOTE:
"Only long scalps allowed! Rich? Raid now. Poor? Join swing thieves & trail your SL!"
🔥 WHY SOYBEAN? (Bullish Catalysts)
Technicals + fundamentals align for a bullish heist.
Check: COT reports, seasonals, macro trends, and intermarket signals (links below 👇).
⚠️ WARNING: NEWS = VOLATILITY
Avoid new trades during major news.
Trailing SLs = your escape rope! Lock profits before the cops (bears) arrive.
💎 BOOST THIS HEIST!
"Smash 👍 LIKE, hit 🔔 FOLLOW, and share the loot! Your support fuels our next raid."
🎯 Final Tip: "Profit is yours—take it and vanish! 🏴☠️"
📢 Stay tuned for the next heist! "Market thieves never sleep…" 😉
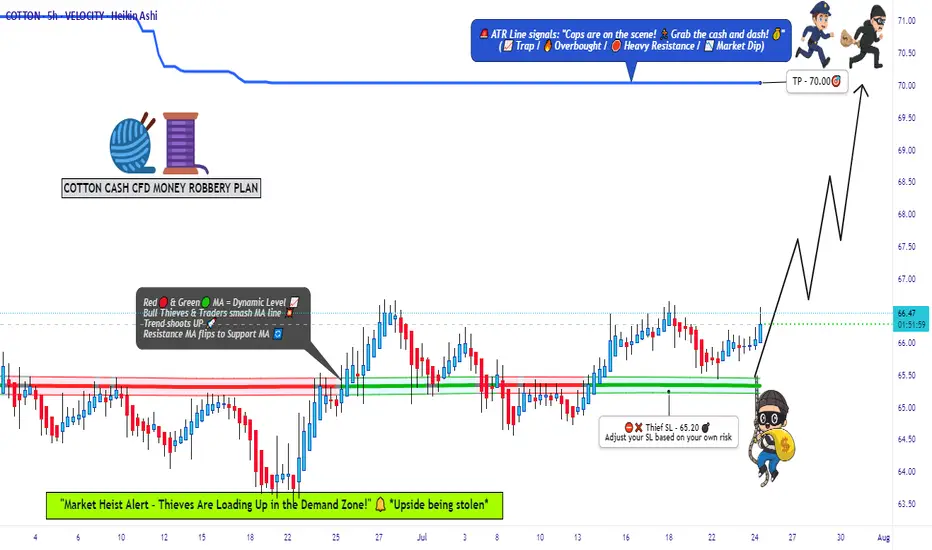
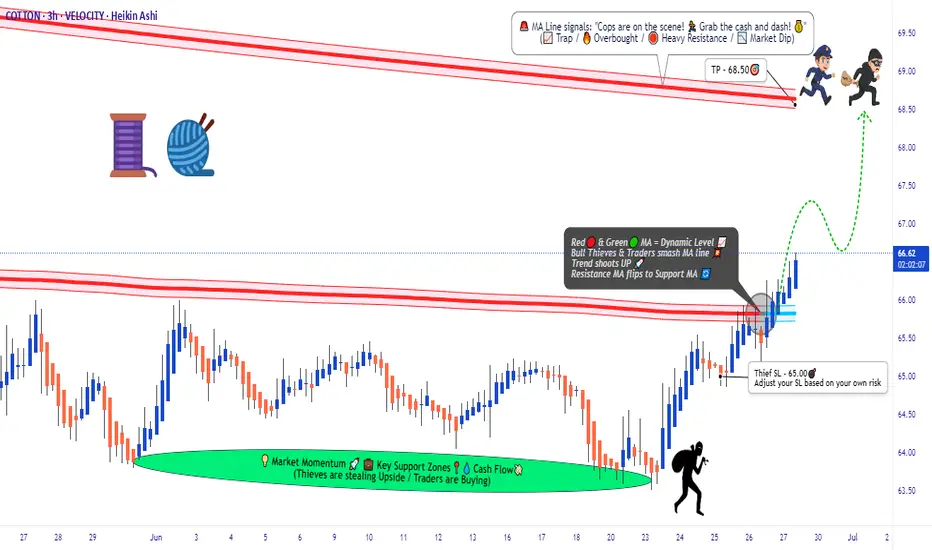
"COTTON CFD HEIST: Bullish Loot Before the Trap!"🔥 COTTON CFD HEIST: Bullish Loot & Escape Before the Trap! 🚨💰
🌟 Attention Market Robbers & Profit Pirates! 🌟
(Hola! Bonjour! Hallo! Marhaba!)
🔎 Strategy Based on THIEF TRADING ANALYSIS (Technical + Fundamental):
We’re staging a bullish heist on the 🧵 COTTON CFD market—time to grab the loot and exit before the bears ambush us near the Dangerous Red Zone (key resistance). Overbought? Maybe. A trap? Likely. But thieves don’t overstay—we escape with profits!
📌 ENTRY (Bullish Vault is Open!):
"SWIPE THE LOOT!" – Buy at current price OR set buy limits (15m/30m pullbacks).
Pro Tip: Strong hands enter now; cautious robbers wait for dips.
⛔ STOP LOSS (Safety Net):
Thief’s Rule: Set SL below nearest 4H swing low wick (~65.00).
Adjust based on your risk tolerance & position size.
🎯 TARGETS (Escape Routes):
Take Profit @ 68.50
Bail early if momentum fades! (Don’t be greedy—real thieves lock in gains.)
⚡ SCALPERS NOTE:
Longs only! Use trailing stops to protect profits.
No money? Join swing traders—this heist is teamwork!
📢 FUNDAMENTAL BACKUP:
Bullish drivers: COT Report, Macro Trends, Geopolitics, Seasonals.
Full analysis herre: 👉🔗 🌍📊
🚨 TRADING ALERTS:
News = Volatility! Avoid new trades during high-impact events.
Trailing SLs save heists. Lock profits before the market turns.
💥 BOOST THIS PLAN → STRONGER ROBBERY SQUAD → MORE GAINS!
(Like & Share to help us steal the market’s money daily! 🏴☠️💸)
Next heist coming soon—stay tuned, thieves! 🤫🚀
Coffee Trade Analysis - Fx Dollars - {11/07/2025}Educational Analysis says that Coffee (Commodity) may give trend Trading opportunities from this range, according to my technical analysis.
Broker - NA
So, my analysis is based on a top-down approach from weekly to trend range to internal trend range.
So my analysis comprises of two structures: 1) Break of structure on weekly range and 2) Trading Range to fill the remaining fair value gap
Let's see what this Commodity brings to the table for us in the future.
Please check the comment section to see how this turned out.
DISCLAIMER:-
This is not an entry signal. THIS IS FOR EDUCATIONAL PURPOSES ONLY.
I HAVE NO CONCERNS WITH YOUR PROFIT OR LOSS,
Happy Trading, Fx Dollars.

Quick take o sugar futuresThe technical picture is starting to look quite interesting. Let's see if seasonality will kick in as well. Let's dig in.
MARKETSCOM:SUGAR
ICEUS:SB1!
Let us know what you think in the comments below.
Thank you.
75.2% of retail investor accounts lose money when trading CFDs with this provider. You should consider whether you understand how CFDs work and whether you can afford to take the high risk of losing your money. Past performance is not necessarily indicative of future results. The value of investments may fall as well as rise and the investor may not get back the amount initially invested. This content is not intended for nor applicable to residents of the UK. Cryptocurrency CFDs and spread bets are restricted in the UK for all retail clients.

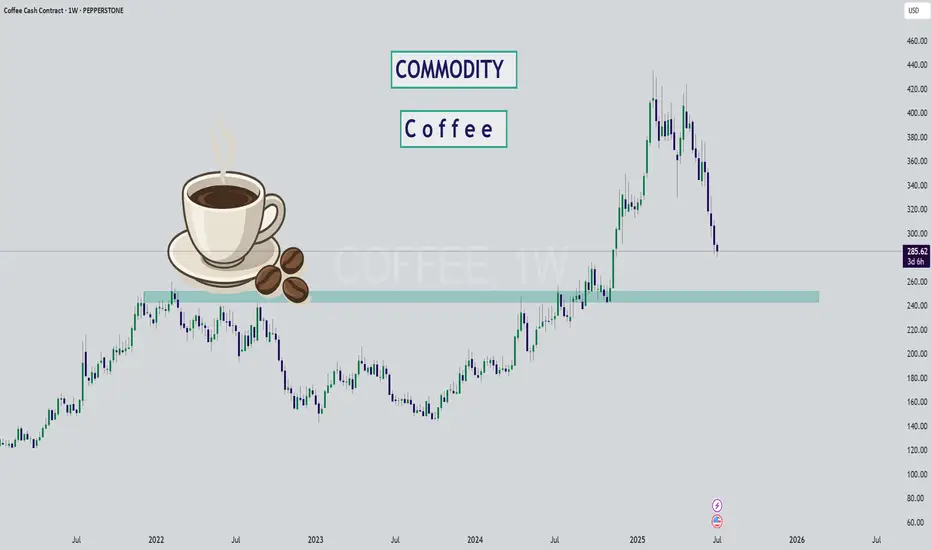
COFFEE - My Commodity of ChoiceI've laid out a plan I'm looking at on one of my favorite commodities - COFFEE ☕😍
What makes it so hard is the predictability of the weather - nearly impossible for the future. However, it is odd to see that the price still bonces at key support and resistance zones, almost like any "stock". Which tells me regular market trading still applies despite the odd weather event.
The reason Coffee has fallen so hard over the past few months is supply - due to extremely favorable weather conditions, coffee supply is more than demand. Resulting, as market dynamics goes, in a drop of price.
It's unfortunate though that my favorite pack of beans at the supermarket has not gone down - weird how that works 🙄 I like a medium roast, Columbia single origin.
It's dropped -33% already, but I can clearly see the market structure entering bearish phase after the bullish phase, peak (the new high) and now likely a multi-month bearish season. The question is just where the price can bottom for such a well loved commodity.
I looked at past cycles, not too long ago we dropped roughly 44% during the bearish cycle, taking 2-3 years to move into accumulation before another impulse wave up. That places a target for entry exactly in the highlighted zone around $250ish.
But I wouldn't get too greedy on my favorite commodity, buying orders can't be too low either. This would likely have to be a multiyear hold. Pepperstone sells coffee on cash contract but I usually do futures. Pity that I didn't get in sooner, bullish cycles is also at least a 2 year journey. I'll sell when the weather is bad 😅
Next up? Chocolate for sure...
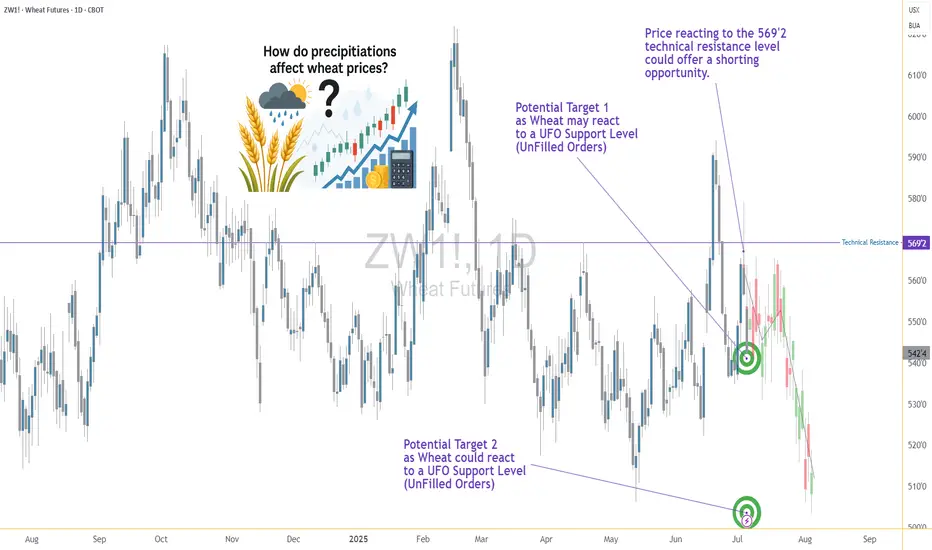
Rain or Ruin? Analyzing Wheat Prices During Precip Extremes1. Introduction: When Rain Means Risk for Wheat Traders
Rain is life for wheat crops—until it isn’t. In the world of agriculture, water is essential, but extremes in precipitation can cause just as much harm as droughts. For traders in the wheat futures market, understanding this relationship between rainfall and price action is not just useful—it’s essential.
Wheat is a crop with a long growth cycle, grown across diverse geographies like the U.S. Plains, the Canadian Prairies, Russia, and Ukraine. Each region has its own precipitation rhythm, and any disruption can ripple through the global supply chain. The question is: can weather signals—especially rainfall—be used to predict market behavior?
This article dives into that question using a data-driven lens. We categorized precipitation data and measured how wheat futures returns responded to different rainfall environments. The results? Revealing, and at times, counterintuitive.
2. The Role of Rainfall in Wheat Production
Wheat, especially spring and winter varieties, is particularly sensitive to soil moisture levels at key phases like germination, tillering, and heading. Too little rain in early development and the crop can fail to establish. Too much rain close to harvest? Risk of disease, sprouting, and quality degradation.
Traders have long known that unexpected wet or dry weeks can trigger speculative surges or hedging activity. But how do these events influence actual futures returns?
Before answering that, we need to translate rain into something traders can use: categories based on historical norms.
3. Methodology: Categorizing Rainfall and Measuring Market Response
To understand how wheat prices respond to different levels of rainfall, we analyzed weekly precipitation data across global wheat-producing regions. We normalized the data using percentiles:
Low Precipitation: Below the 25th percentile
Normal Precipitation: Between the 25th and 75th percentiles
High Precipitation: Above the 75th percentile
We then matched this categorized weather data with weekly returns from wheat futures (symbol: ZW) to explore if price behavior systematically varied depending on how wet or dry a week had been.
To test significance, we used a simple t-test comparing the mean returns of low-precip and high-precip weeks. The p-value (6.995E-06) revealed a compelling result: yes, there is a statistically significant difference.
4. Results: High Rainfall, Higher Price Volatility
The data confirms that weeks with extreme rainfall—especially those with high precipitation—often align with more volatile wheat price movements.
But here’s the twist: while low-precip weeks didn’t consistently show bullish returns, high-precip weeks correlated with negative or erratic returns. That makes sense when you think about harvest delays, rot, and declining grain quality.
Traders watching forecasts for excessive rainfall should consider the implications for grain availability and price stabilization mechanisms. This is where speculative plays or hedging via options and standard or micro futures contracts can become especially useful.
5. Interpreting the Volatility: Why the Market Reacts to Rain
Why does excessive rain lead to such uneven price behavior?
The answer lies in uncertainty. Heavy rainfall often introduces multiple variables into the equation: planting delays, logistical bottlenecks, and downgraded wheat quality due to fungal infections. For example, a wet harvest can reduce protein content, pushing millers to seek alternatives—altering both demand and supply expectations simultaneously.
This dual-sided pressure—reduced high-quality yield and uncertain export capability—tends to shake market confidence. Traders respond not just to the supply data but also to how much trust they place in the supply pipeline itself.
6. Futures Contracts: Navigating Risk with Position Size Control
Traders looking to participate in wheat price action have two main CME-listed options:
Standard Wheat Futures (ZW)
Contract Size: 5,000 bushels
Tick Size: 1/4 cent per bushel (0.0025) has a $12.50 per tick impact
Margin Requirement: Approx. $1,700 (subject to change)
Micro Wheat Futures (MZW)
Contract Size: 500 bushels (1/10th the size of the standard contract)
Tick Size: 0.0050 per bushel has a $2.50 per tick impact
Margin Requirement: Approx. $170 (subject to change)
Micro contracts like MZW offer a lower-cost, lower-risk way to trade wheat volatility—perfect for sizing into weather-related trades with precision or managing risk in a more granular fashion. Many traders use these contracts to test strategies during seasonal transitions or while responding to forecast-driven setups.
7. Visual Evidence: Price Behavior by Precipitation Category
To visually represent our findings, we used box plots to show wheat weekly returns grouped by precipitation category:
The shape of these distributions is revealing. High-precipitation weeks not only show lower average returns but also a wider range of possible outcomes—underscoring the role that rainfall extremes play in price volatility rather than just directional bias.
We are also complementing this visual with a weather map that shows real-time precipitation patterns in major wheat-growing regions. This could help traders align weather anomalies with trading opportunities.
8. Final Thoughts: The Forecast Beyond Forecasts
Precipitation isn’t just an agricultural concern—it’s a market catalyst.
Our analysis shows that rainfall extremes, particularly heavy rain, create meaningful signals for wheat traders. The price response is less about direction and more about uncertainty and volatility, which is equally important when structuring trades.
If you’re serious about trading wheat futures, don’t just watch the charts—watch the clouds.
This article is one piece in our broader series on how weather influences ag futures. Stay tuned for the next one, where we continue to decode the atmosphere’s impact on the markets.
When charting futures, the data provided could be delayed. Traders working with the ticker symbols discussed in this idea may prefer to use CME Group real-time data plan on TradingView: tradingview.sweetlogin.com - This consideration is particularly important for shorter-term traders, whereas it may be less critical for those focused on longer-term trading strategies.
General Disclaimer:
The trade ideas presented herein are solely for illustrative purposes forming a part of a case study intended to demonstrate key principles in risk management within the context of the specific market scenarios discussed. These ideas are not to be interpreted as investment recommendations or financial advice. They do not endorse or promote any specific trading strategies, financial products, or services. The information provided is based on data believed to be reliable; however, its accuracy or completeness cannot be guaranteed. Trading in financial markets involves risks, including the potential loss of principal. Each individual should conduct their own research and consult with professional financial advisors before making any investment decisions. The author or publisher of this content bears no responsibility for any actions taken based on the information provided or for any resultant financial or other losses.
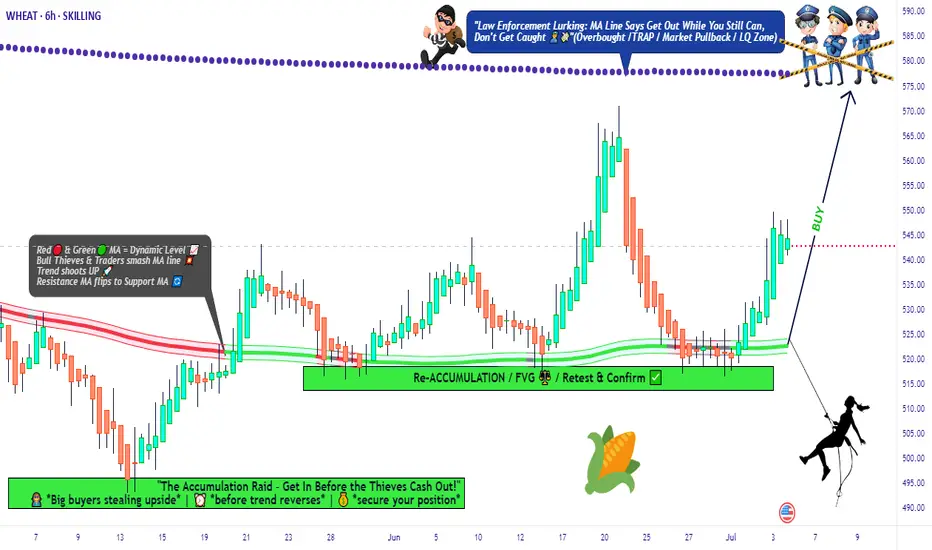
Rob the Wheat Market Before the Trend Escapes!🏴☠️Wheat Vault Breach: Sweet Profit Heist in Progress!🍫💰
(Thief Trader’s Swing/Day Plan – Only Bulls Allowed)
🌟Hi! Hola! Ola! Bonjour! Hallo! Marhaba!🌟
Dear Money Makers & Robbers, 🤑 💰💸✈️
We’ve cracked the code to the 🏉"WHEAT"🏉 Commodities CFD market, and now it’s time to launch a high-stakes heist based on 🔥Thief Trading style technical + fundamental analysis🔥.
🎯 Mission Objective: Infiltrate the overbought zone, where traps are set, robbers are lurking, and the market’s about to turn. The plan? Ride the bullish wave, loot the Red Zone, and vanish with sweet profits. 🏆💸
🔓 Entry Point:
"The vault is wide open!"
Buy at will — loot that bullish treasure!
⏱️ Best tactic: Set buy limits on the 15M or 30M swing low/high zones. Set alerts and stay sharp.
🛑 Stop Loss:
SL = Nearest 6H Swing Low below the MA line (520.00)
🔐 Protect your stash. Use risk-adjusted SL based on trade size and number of entries.
🎯 Target:
575.00 or escape early if the pressure builds!
⚔️ Scalper’s Note:
Only steal on the long side.
💰 Big money = Go direct
💼 Small bags = Team up with swing traders
📉 Use trailing SLs to guard your gains.
🔥Wheat Market is Bullish – Why?
☑️ Fundamentals
☑️ Macroeconomics
☑️ COT Report
☑️ Sentiment Signals
☑️ Intermarket Vibes
☑️ Seasonal Patterns
☑️ Trend Forecasts & Target Levels
👉 Dive into the data: 🔗🔗🔗
⚠️ Trading Alerts:
News releases = Danger zones!
❌ No new entries during news
✅ Trailing SL to protect ongoing raids
💥 Smash the Boost Button 💥
Support this Thief Plan and keep our crew winning daily.
💪 Rob with confidence. Win with consistency.
🎉 Thief Trading Style = Your daily cash machine.
💣Stay tuned for the next robbery blueprint!
— Your Friendly Market Criminal, 🐱👤
Rob the Cocoa Market Before the Trend Escapes🏴☠️Cocoa Vault Breach: Sweet Profit Heist in Progress!🍫💰
(Thief Trader’s Swing/Day Plan – Only Bulls Allowed)
🌟Hi! Hola! Ola! Bonjour! Hallo! Marhaba!🌟
Dear Money Makers & Robbers, 🤑 💰💸✈️
We’ve cracked the code to the 🏉"COCOA"🏉 Commodities CFD market, and now it’s time to launch a high-stakes heist based on 🔥Thief Trading style technical + fundamental analysis🔥.
🎯 Mission Objective: Infiltrate the overbought zone, where traps are set, robbers are lurking, and the market’s about to turn. The plan? Ride the bullish wave, loot the Red Zone, and vanish with sweet profits. 🏆💸
🔓 Entry Point:
"The vault is wide open!"
Buy at will — loot that bullish treasure!
⏱️ Best tactic: Set buy limits on the 15M or 30M swing low/high zones. Set alerts and stay sharp.
🛑 Stop Loss:
SL = Nearest 4H Swing Low
🔐 Protect your stash. Use risk-adjusted SL based on trade size and number of entries.
🎯 Target:
11,300 or escape early if the pressure builds!
⚔️ Scalper’s Note:
Only steal on the long side.
💰 Big money = Go direct
💼 Small bags = Team up with swing traders
📉 Use trailing SLs to guard your gains.
🔥Cocoa Market is Bullish – Why?
☑️ Fundamentals
☑️ Macroeconomics
☑️ COT Report
☑️ Sentiment Signals
☑️ Intermarket Vibes
☑️ Seasonal Patterns
☑️ Trend Forecasts & Target Levels
👉 Dive into the data: 🔗🔗🔗
⚠️ Trading Alerts:
News releases = Danger zones!
❌ No new entries during news
✅ Trailing SL to protect ongoing raids
💥 Smash the Boost Button 💥
Support this Thief Plan and keep our crew winning daily.
💪 Rob with confidence. Win with consistency.
🎉 Thief Trading Style = Your daily cash machine.
💣Stay tuned for the next robbery blueprint!
— Your Friendly Market Criminal, 🐱👤

“COFFEE CFD Smash-and-Grab: Thieves’ Swing Trade Blueprint!"🚨☕ The Great "COFFEE" Market Heist 🚨💰
🌟Hi! Hola! Ola! Bonjour! Hallo! Marhaba!🌟
⚔️Dear Money Makers & Robbers, 🤑💸✈️
Get ready for the ultimate COFFEE Commodities CFD Market Heist! Based on our 🔥Thief Trading Style combining technical and fundamental analysis, here’s our master plan to snatch profits from the market vault.
💥 The Master Plan:
📉 Entry:
“The vault is wide open! Swipe the bearish loot at any price—our heist is on!”
💸 Use sell limit orders on the 15- or 30-minute timeframe, at the nearest swing high or low levels to lock in the perfect robbery spot.
🛑 Stop Loss:
📌 Set your Thief SL at the nearest or swing high/low on the 4H timeframe (~380.00) to keep your loot safe.
📌 Adjust SL based on your trade risk, lot size, and multiple entry plan—don’t let the cops catch you!
🎯 Target:
Aim for 315.00 or escape before the target—take the loot and run!
👀 Scalpers’ Tip:
Only scalp on the Short Side! If you’ve got deep pockets, jump in big; otherwise, join swing traders to ride the heist. Use trailing SL to protect your loot.
💣 Market Vibes:
The “COFFEE” CFD market is trapped in bearish territory, fueled by:
🔎 Risky levels
🔎 Oversold zones
🔎 Consolidation
🔎 Trend reversal
🔎 Traps near levels where bullish robbers get strong.
📰🗞️ The Big Picture:
Check out the Fundamentals, Macro, COT Report, Quantitative Analysis, Sentimental Outlook, Intermarket Analysis, and Future Trend Targets to stay one step ahead! 👉👉👉🔗 (Check our bi0 for liinks!)
⚠️ Trading Alert:
News releases can rock the market vault!
🚨 Avoid new trades during big news
🚨 Use trailing SL to lock profits and guard your loot.
💥 Hit the Boost Button!
Supporting our Robbery Plan helps us all steal money with ease! 💰💵 Boost our robbery team’s strength, and trade with the Thief Trading Style to cash in every day. 💪🏆🤝🚀🎉
Stay tuned for our next heist plan—until then, keep those profits safe and stay sharp! 🤑🐱👤🤩
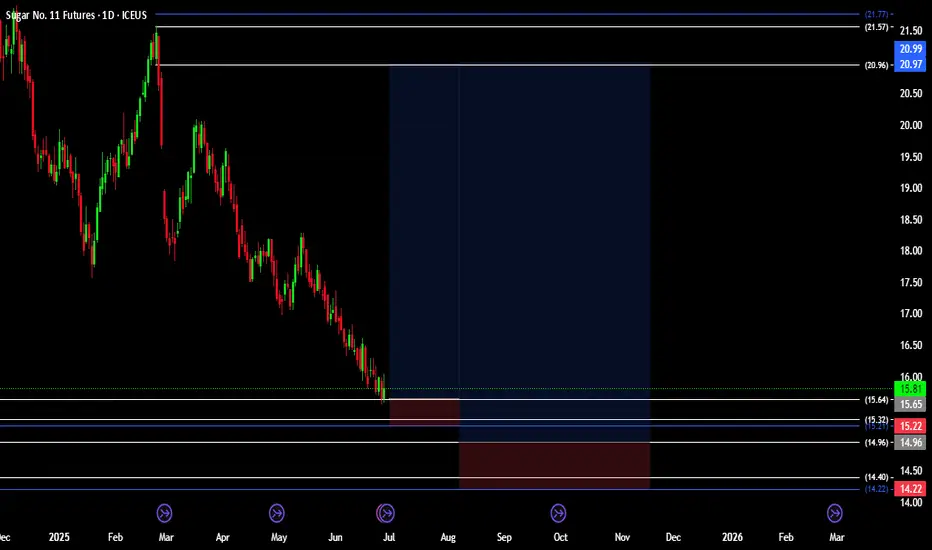
Positioning Buy idea on Sugar (SB1!)Based on :
- Cot at extremes potential reversal
- Seasonality and quantitative analysis
- 2 Demand zones
Stealing from bears: soybean long setup!🚨 THE GREAT SOYBEAN HEIST: Bullish Raid Plan (Swing/Day Trade) 🏴☠️💸
🌟 ATTENTION, MARKET BANDITS & MONEY SNATCHERS! 🌟
(Hola! Oi! Bonjour! Salaam! Guten Tag!)
🔥 Using the ruthless Thief Trading Strategy (TA + FA), we’re executing a bullish raid on the SOYBEAN Commodities CFD Market! Time to steal profits from the bears before they wake up! 🥷💨
🎯 MASTER HEIST PLAN (BULLISH RAID)
📈 Entry Point (Buy Limit/Market):
"The vault is unlocked—grab the bullish loot at any price!"
🔹 *For precision heists, set buy limits near pullbacks (15M/30M).*
🔹 ALERT: Set price alerts to catch the perfect steal!
🛑 Stop Loss (Escape Route):
📌 Thief SL at nearest swing low (3H timeframe) – 1030.0
📌 Adjust SL based on your risk tolerance & position size.
🎯 Profit Target (Escape Before Bears Strike Back):
💥 1095.0 (or exit early if the trap snaps shut!)
🧲 Scalper’s Bonus:
Only scalp LONG!
Big wallets? Go all-in! Small wallets? Swing-trade the robbery!
Use trailing SL to lock profits and escape clean!
🌱 MARKET TREND: BULLISH (BEAR TRAP SET!)
Overbought? Maybe. But the real trap is where bearish robbers get slaughtered.
High risk = High reward—only for cold-blooded traders!
📡 FUNDAMENTAL INTEL (DON’T SKIP THIS!)
🔗 Full reports (COT, Macro, Seasonals, Sentiment, Intermarket Analysis) in our biio!
🚨 TRADING ALERT: NEWS = DANGER ZONE!
❌ Avoid new trades during news!
🔐 Use trailing stops to lock profits & escape alive!
💥 BOOST THIS HEIST! (HELP US ROB THE MARKET!)
🔥 Hit LIKE & FOLLOW to strengthen our robbery squad!
💰 More heists = More profits. Stay tuned for the next raid!
🐱👤 See you in the shadows, bandits! 🤑🚀
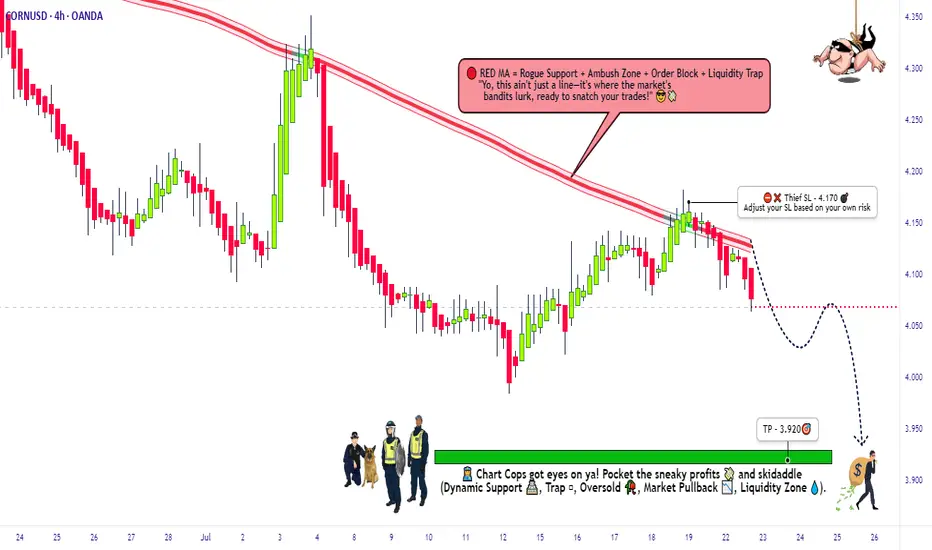
THE GREAT CORN GRAB! (Bearish CFD Heist)🌽 THE CORN HEIST: Bearish Raid Plan (Swing/Day Trade) 🚨💰
🌟 Attention, Market Robbers & Money Makers! 🌟
(Hola! Oi! Bonjour! Hallo! Marhaba!)
🔥 Based on the ruthless Thief Trading Style (TA + FA), we’re plotting a bearish heist on the CORN Commodities CFD Market! Time to short like a bandit and escape with profits before the bulls catch us! 🏴☠️💸
🎯 MASTER HEIST PLAN (BEARISH RAID)
Entry Point (Sell Limit / Market):
"The vault is open—swipe the bearish loot at any price!"
🔹 *For safer heists, set sell limits near pullbacks (15M/30M).*
Stop Loss (Escape Route):
📌 Thief SL at nearest swing high (1D timeframe) – 4.4000
📌 Adjust SL based on risk, lot size, & multiple orders.
Profit Target (Escape Before Cops Arrive):
🎯 4.1000 (or exit early if the trap snaps shut!)
🌽 MARKET TREND: NEUTRAL (BEARISH OPPORTUNITY!)
Consolidation zone = Thief’s playground!
Oversold? Maybe. But the real trap is where bullish robbers get slaughtered.
High risk = High reward—only for cold-blooded traders!
📡 FUNDAMENTAL INTEL (DON’T SKIP THIS!)
🔗 Get full reports (COT, Macro, Seasonals, Sentiment, Intermarket Analysis) in our bio0!
🚨 TRADING ALERT: NEWS = DANGER ZONE!
❌ Avoid new trades during news!
🔐 Use trailing stops to lock profits & escape alive!
💥 BOOST THIS HEIST! (HELP US ROB THE MARKET!)
🔥 Hit LIKE & FOLLOW to strengthen our robbery squad!
💸 More heists = More profits. Stay tuned for the next raid!
🐱👤 See you in the shadows, bandits! 🤑🚀

Soybeans and Heat: Subtle Signals in a Volatile Market1. Introduction
Soybeans aren't just a staple in livestock feed and global cuisine—they’re also a major commodity in futures markets, commanding serious attention from hedgers and speculators alike. With growing demand from China, unpredictable yields in South America, and increasing climatic instability, the behavior of soybean prices often reflects a deeper interplay of supply chain stress and environmental variability.
Among the many weather variables, temperature remains one of the most closely watched. It’s no secret that extreme heat can harm crops. But what’s less obvious is this: Does high temperature truly move the soybean market in measurable ways?
As we’ll explore, the answer is yes—but with a twist. Our deep dive into decades of data reveals a story of statistical significance, but not dramatic deviation. In other words, the signal is there, but you need to know where—and how—to look.
2. Soybeans and Climate Sensitivity
The soybean plant’s sensitivity to heat is well documented. During its flowering and pod-setting stages, typically mid-to-late summer in the U.S., soybean yields are highly vulnerable to weather fluctuations. Excessive heat during these windows—particularly above 30ºC (86ºF)—can impair pod development, lower seed count, and accelerate moisture loss from the soil.
The optimal range for soybean development tends to hover between 20ºC to 30ºC (68ºF to 86ºF). Within this window, the plant thrives—assuming adequate rainfall and no pest infestations. Go beyond it for long enough, and physiological stress builds up. This is precisely the kind of risk that traders price into futures markets, often preemptively based on forecasts.
Yet, trader psychology is just as important as crop biology. Weather alerts—especially heatwaves—often drive speculative trading. The market may anticipate stress well before actual yield reports come out. This behavior is where we see the beginnings of correlation between temperature and market movement.
3. Quantifying Weather Impact on Soybean Futures
To test how meaningful these heat-driven narratives are, we categorized weekly temperatures into three buckets:
Low: Below the 25th percentile of weekly temperature readings
Normal: Between the 25th and 75th percentile
High: Above the 75th percentile
We then calculated weekly returns of Soybean Futures (ZS) across these categories. The results?
Despite the modest visual differences in distribution, the statistical analysis revealed a clear pattern: Returns during high-temperature weeks were significantly different from those during low-temperature weeks, with a p-value of 3.7e-11.
This means the likelihood of such a difference occurring by chance is effectively zero. But here’s the catch—the difference in mean return was present, yes, but not huge. And visually, the boxplots showed overlapping quartiles. This disconnect between statistical and visual clarity is exactly what makes this insight subtle, yet valuable.
4. What the Data Really Tells Us
At first glance, the boxplots comparing soybean futures returns across temperature categories don’t scream “market-moving force.” The medians of weekly returns during Low, Normal, and High temperature periods are closely clustered. The interquartile ranges (IQRs) overlap significantly. Outliers are present in every category.
So why the statistical significance?
It’s a matter of consistency across time. The soybean market doesn’t suddenly explode every time it gets hot—but across hundreds of data points, there’s a slightly more favorable distribution of returns during hotter weeks. It’s not dramatic, but it’s reliable enough to warrant strategic awareness.
This is where experienced traders can sharpen their edge. If you’re already using technical analysis, seasonal patterns, or supply-demand forecasts, this weather-based nuance can serve as a quiet confirmation or subtle filter.
5. Why This Still Matters for Traders
In markets like soybeans, where prices can respond to multiple fundamental factors—currency shifts, export numbers, oilseed competition—small weather patterns might seem like background noise. But when viewed statistically, these small effects can become the grain of edge that separates average positioning from smart exposure.
For example:
Volatility tends to rise during high-heat weeks, even when average return shifts are small.
Institutional players may rebalance positions based on crop health assumptions before USDA reports arrive.
Weather trading algos can push prices slightly more aggressively during risk-prone periods.
In short, traders don’t need weather to predict price. But by knowing what weather has historically meant, they can adjust sizing, bias, or timing with greater precision.
6. Contract Specs: Standard vs. Micro Soybeans
Accessing the soybean futures market doesn’t have to require big institutional capital. With the launch of Micro Soybean Futures (MZS), traders can participate at a more granular scale.
Here are the current CME Group specs:
📌 Contract Specs for Soybean Futures (ZS):
Symbol: ZS
Contract size: 5,000 bushels
Tick size: 1/4 of one cent (0.0025) per bushel = $12.50
Initial margin: ~$2,100 (varies by broker and volatility)
📌 Micro Soybean Futures (MZS):
Symbol: MZS
Contract size: 500 bushels
Tick size: 0.0050 per bushel = $2.50
Initial margin: ~$210
The micro-sized contract allows traders to scale into positions, especially when exploring signals like weather impact. It also enables more nuanced strategies—such as partial hedges or volatility exposure—without the capital intensity of full-size contracts.
7. Conclusion: A Nuanced Edge for Weather-Aware Traders
When it comes to soybeans and temperature, the story isn’t one of obvious crashes or dramatic spikes. It’s a story of consistent, statistically measurable edges that can quietly inform better trading behavior.
Yes, the return differences may look small on a chart. But over time, in leveraged markets with seasonality and fundamental noise, even a few extra basis points in your favor—combined with smarter sizing and timing—can shift your performance curve meaningfully.
Using tools like Micro Soybean Futures, and being aware of technical frameworks, traders can efficiently adapt to subtle but reliable signals like temperature-based volatility.
And remember: this article is just one piece in a multi-part series exploring the intersection of weather and agricultural trading. The next piece might just provide the missing link to complete your edge. Stay tuned. 🌾📈
When charting futures, the data provided could be delayed. Traders working with the ticker symbols discussed in this idea may prefer to use CME Group real-time data plan on TradingView: tradingview.sweetlogin.com - This consideration is particularly important for shorter-term traders, whereas it may be less critical for those focused on longer-term trading strategies.
General Disclaimer:
The trade ideas presented herein are solely for illustrative purposes forming a part of a case study intended to demonstrate key principles in risk management within the context of the specific market scenarios discussed. These ideas are not to be interpreted as investment recommendations or financial advice. They do not endorse or promote any specific trading strategies, financial products, or services. The information provided is based on data believed to be reliable; however, its accuracy or completeness cannot be guaranteed. Trading in financial markets involves risks, including the potential loss of principal. Each individual should conduct their own research and consult with professional financial advisors before making any investment decisions. The author or publisher of this content bears no responsibility for any actions taken based on the information provided or for any resultant financial or other losses.
ZCU25 CORN... It ALWAYS comes down to cornAND I'M BACK AND DUMBER THAN EVER
Listen up Honkies, this trade has a 93% probability based on the historical data over the last 30 years. So I bet Muhammad my 3rd ex-wife and a half of my second step child. The reason this trade works is easy! We all have felt and understand FUD (Fear, Uncertainty, and Doubt) and how the market reacts, I understood this on my second ex-wife when she got a boyfriend. So in late June pollination season occurs with corn and the yield is unknown for the next year, this is a very simple way of looking at the agricultural industry and how the market corrects. The trade is set up in two stages in order to maximize profit. The first stage, with the FUD in pollination season typically results in a 15-20% drop, I split the difference at 17% lets make it easier than my first divorce. This usually occurs around June 26th and can extend to July 17th. Around July 15th to the 20th the projected yield is shared and the market recorrects to the upside as the numbers represented due to the FUD don't represent the price action in the futures market, and because the futures market is speculatory (Adult Gambling) the degens will pump the contracts up looking for a quick buck like my third wife. Now in order to not go broke while you're trying to buy your ex wife's boyfriend's son a new car, you need to hedge the contract in a calendar spread aka intra-commodity spread, so do the opposite in combination on the march 2026 corn contract as the maintance is lower and the price action isn't there due to open interest in the market, so let that contract ride if it goes against you. SO! you short the ZCU25 while longing the ZCH26, then offset the contracts when direction changes and long ZCU25 and short ZCH26, it's as easy as 1,2,8. Had to repost this forgot the Tags my bad.
"all I need is one trade to pay all the alimony for this year."
-KewlKat

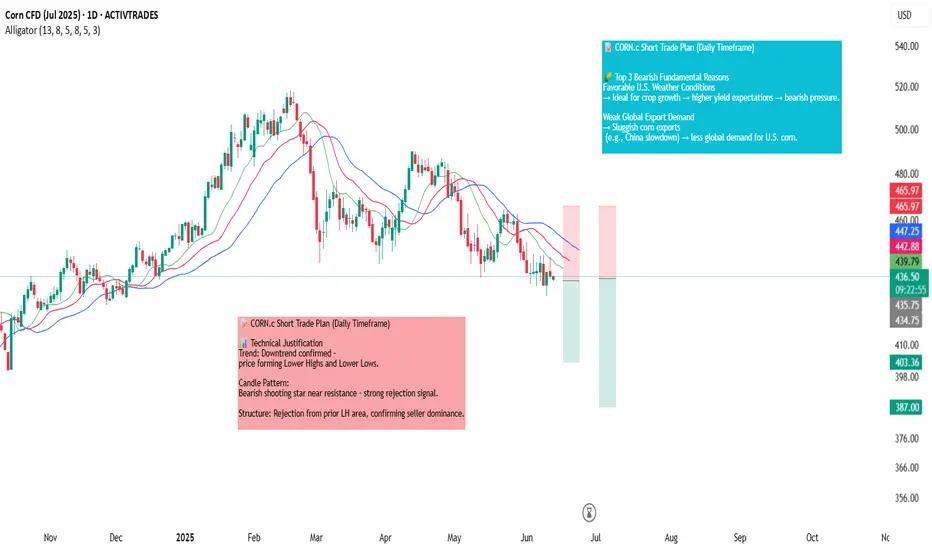
CORN.c CORN.c Short Trade Plan (Daily Timeframe)
📍 Trade Setup
Direction: Short
Entry: Instant / Current Market Price (CMP)
Stop Loss (SL): 465.97
Take Profit 1 (TP1): 403.36 (≈ 1:1 Risk-Reward)
Take Profit 2 (TP2): 387.00 (≈ 1:1.5 Risk-Reward)
📊 Technical Justification
Trend: Downtrend confirmed – price forming Lower Highs and Lower Lows.
Candle Pattern: Bearish shooting star near resistance – strong rejection signal.
🌽 Top 3 Bearish Fundamental Reasons
Favorable U.S. Weather Conditions
→ Ideal for crop growth → higher yield expectations → bearish pressure.
Weak Global Export Demand
→ Sluggish corn exports (e.g., China slowdown) → less global demand for U.S. corn.
Strong U.S. Dollar
→ Makes U.S. corn more expensive internationally → lowers export competitiveness.
🎯 Risk Management & Execution Plan
Risk-Reward (TP1): ~1:1
Risk-Reward (TP2): ~1:1.5
📌 Once TP1 is hit:
✅ Move SL to Entry (Breakeven) to protect capital and ride remaining position to TP2.