Corn Futures ( ZC1! ), H4 Potential for Bearish Momentum Title: Corn Futures ( ZC1! ), H4 Potential for Bearish Momentum
Type: Bearish Momentum
Resistance: 680.50
Pivot: 661.40
Support: 669.50
Preferred Case: Corn fell below the first resistance level at 680.50, where the 50% and 38.2% Fibonacci lines are placed. If the bearish trend continues, price could reach the first support level at 669.4, which is nearby the 78.6% Fibonacci line.
Alternative scenario: Price may retrace back up to the first resistance level at 680.4.
Fundamentals: There are no major news.
Agricultural Commodities

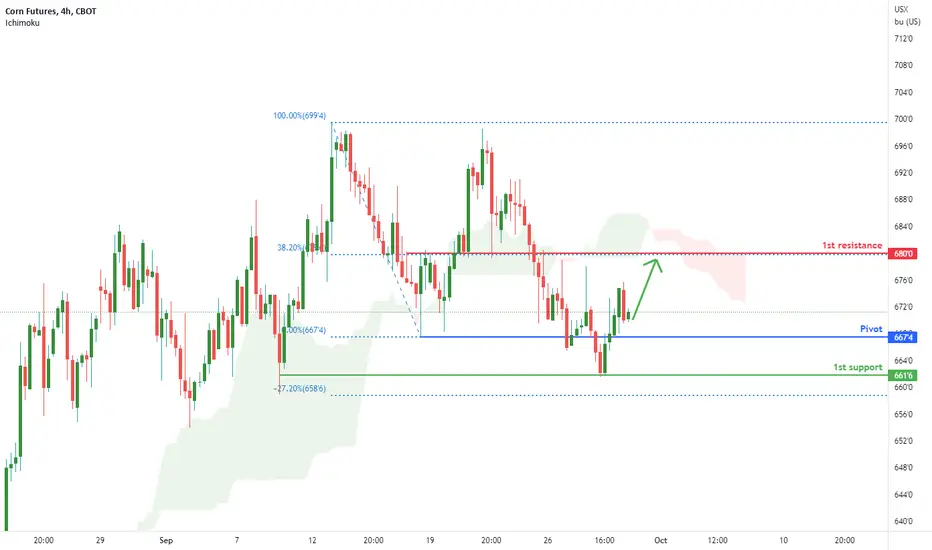
Corn Futures ( ZC1! ), H4 Potential for Bullish Momentum Title: Corn Futures ( ZC1! ), H4 Potential for Bullish Momentum
Type: Bullish Momentum
Resistance: 698.00
Pivot: 661.40
Support: 661.50
Preferred Case: Corn has been rising since September 28, 2022. The price is above the ichimoku cloud, adding to the bullish market bias. Price is currently consolidating along the 50% and 38.2% Fibonacci lines, which mark the first support level at 680.4. If the bullish momentum continues, price may move towards the first resistance level at 698.0, which contains two 100% Fibonacci lines.
Alternative scenario: Price may break through the first support and continue to fall towards 661.4, the pivot point and previous swing low.
Fundamentals: There are no major news.
Wednesday is decision day - spx bonds wheat gold dxy btcSPX is bullish over 3750, bonds I can't tell what is going on there but under 125 would be bad for bulls, Wheat, looks good still in channel, Gold also looks good although the dollar may rally again to 116, BTC could drop hard but it would be a buy for me. GOod luck

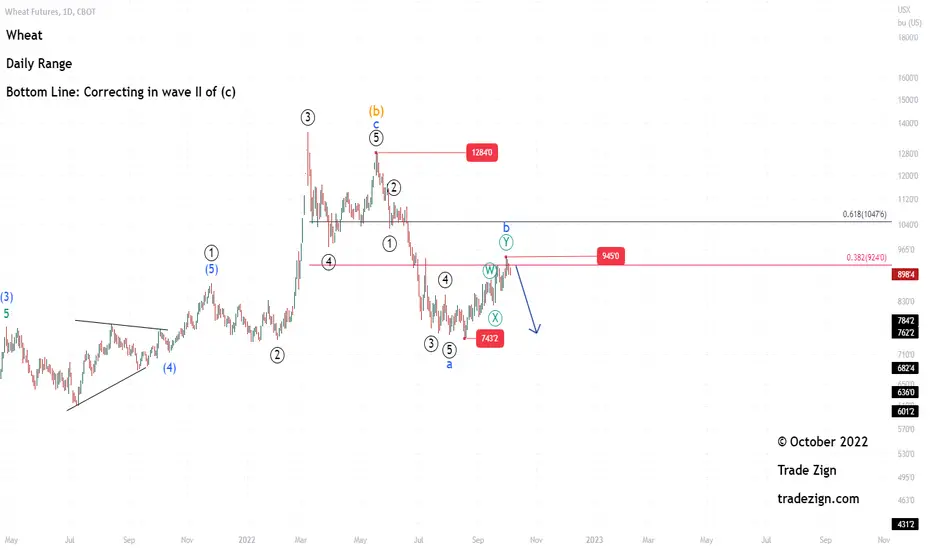
Commodity Wheat idea (05/10/2022)wheat
Completion of wave y of the compound binary wave, and completion of wave b at prices 945 We expect wheat to decline in the coming period after ending the correction pattern as we explained, and we expect a decline as prices are less than the decisive point 945, which is the crucial point. Important, a point for the next period and the beginning of the wave retreat
Corn Futures ( ZC1! ), H4 Potential for Bullish Momentum Title: Corn Futures ( ZC1! ), H4 Potential for Bullish Momentum
Type: Bullish Momentum
Resistance: 698.00
Pivot: 661.40
Support: 661.50
Preferred Case: Corn has been on a bullish trend since September 28, 2022. Price is above the ichimoku cloud, which denotes a bullish market, adding to this confluence. Price reversed course through the first support level at 680.4, which is marked by the 50% and 38.2% Fibonacci lines. Expect price to continue moving upwards approaching the first barrier at 698.0, which is where two of the 100% Fibonacci lines are situated, if this bullish momentum persists.
Alternative scenario: The first support, at 680.4, may be where corn reverses back down. Price may then continue to fall toward the pivot point and prior swing low at 661.4 from there.
Fundamentals: There are no major news.

Took a long at the GP on soybeansSoybeans is looking decent with a nice bounce off of the GP and a technical swing failure of the local lows. The price must close above the parallel channel for me to hold this long.

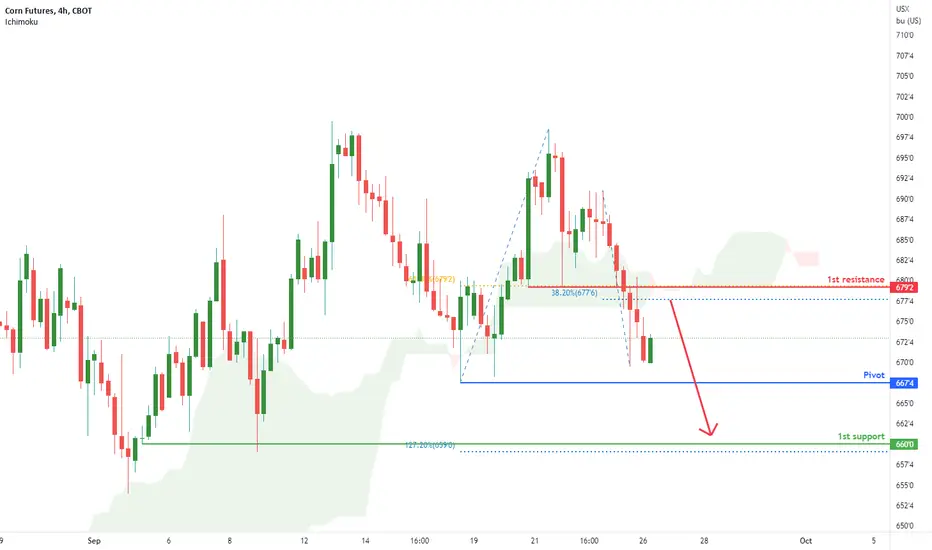
Corn Futures ( ZC1! ), H4 Potential for Bearish Momentum Title: Corn Futures ( ZC1! ), H4 Potential for Bearish Momentum
Type: Bearish Momentum
Resistance: 691.0
Pivot: 661.40
Support: 675.60
Preferred Case: The H4 price is in a downward trend. Price breached and closed below the first resistance level at 691.00. Price could potentially reverse back down to the pivot line and 20% retracement level at 661.40.
Alternative scenario: If the bullish momentum continues, price will move to 688.0, where the 23.6% Fibonacci line is located.
Fundamentals: There are no major news.

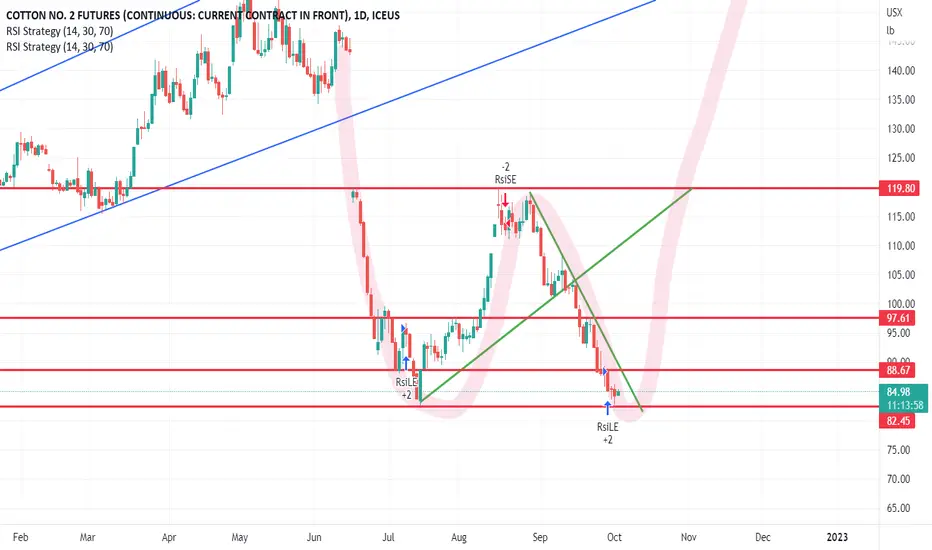
cotton
double bottom formation
after double bottom formation we can expect to increase the price till 143 dolars
Forecast SUGAR#FOOD #SUGAR
Cheap sugar is only in our dreams.
At the moment, the accumulation phase is nearing its end. The technical figure "flag" begins to be traced, the exit of the market from which, according to the canon, should take place upwards.
The first target will be the resistance level ~24.
Its breakdown will send futures with a high degree of probability to cross the global level at 39, which is approximately x2 from current prices.
This is possible if the world system plunges into hyperinflation, the signal for which is already given by the actions of central banks (yesterday's post on the Bank of England).
Under such a scenario, it would be wise to buy food and essentials at current prices.

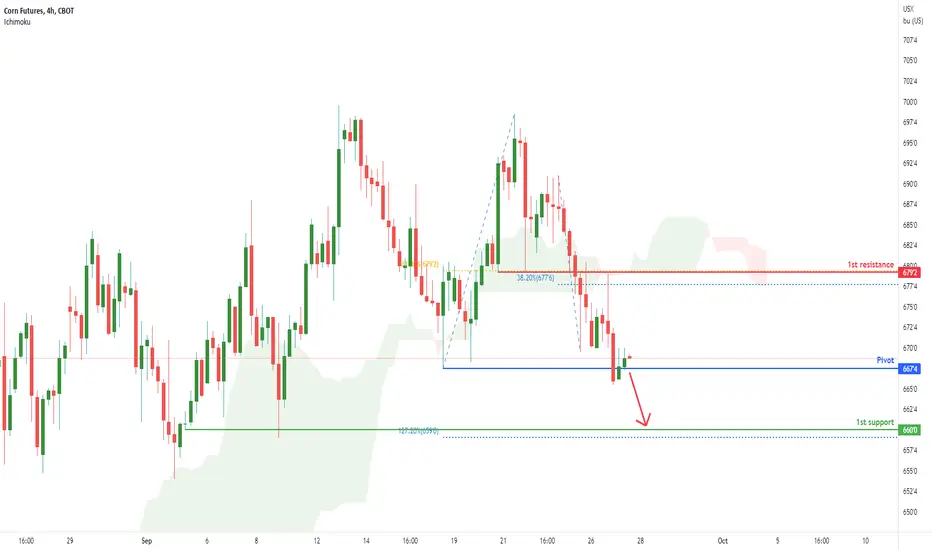
Corn Futures ( ZC1! ), H4 Potential for Bearish Momentum Title: Corn Futures ( ZC1! ), H4 Potential for Bearish Momentum
Type: Bearish Momentum
Resistance: 691.0
Pivot: 661.40
Support: 675.60
Preferred Case: The overall price on the H4 is bullish. Furthermore, the price is above the Ichimoku cloud, indicating that the market is bullish. Price attempted but failed to breach the first resistance level at 691.00. Price responded with a massive rejection wick. Price could potentially reverse back down to the first support level at 675.6, which also happens to be the 61.8% Fibonacci retracement line.
Alternative scenario: If bullish momentum continues, expect price to move towards 705.6, which contains the -27.2% Fibonacci expansion line and the 127.2% Fibonacci extension line.
Fundamentals: There are no major news.

Corn Futures ( ZC1! ), H4 Potential for Bullish Momentum Title: Corn Futures ( ZC1! ), H4 Potential for Bullish Momentum
Type: Bullish Momentum
Resistance: 6.900
Pivot: 667.50
Support: 6.310
Preferred Case: On the H4, the overall price is bearish. In addition, the price is below the Ichimoku cloud, indicating a bear market. Price attempted but failed to break through the Pivot at 667.500 overnight. Price could potentially reverse up to the first resistance level at 6.900, where the 38.2% Fibonacci line is located.
Alternative scenario: If bearish momentum persists, expect price to continue falling towards the first support level at 6.310, where the larger 78.6% Fibonacci line is located.
Fundamentals: There is no major news.

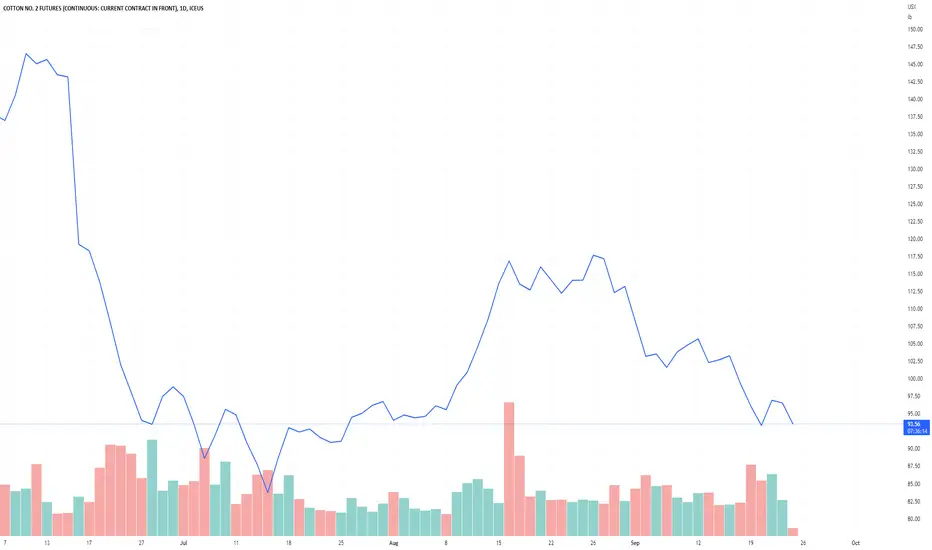
Cotton Prices Look Primed for More Losses Ahead Cotton prices make a decisive break below an area of resistance turned to support, which dates back to February 2021. The move sets prices up for a test of the 90 psychological level as the Relative Strength Index (RSI) tracks deeper into oversold conditions.

Commodity soybean idea (29/09/2022)soybean
We expect a decline in the soybean commodity in the coming period because trading is below the critical point of 1509. Currently, the continuation of the decline in wave ((iii)), which may reach prices 1373 or 1302 before rising again.

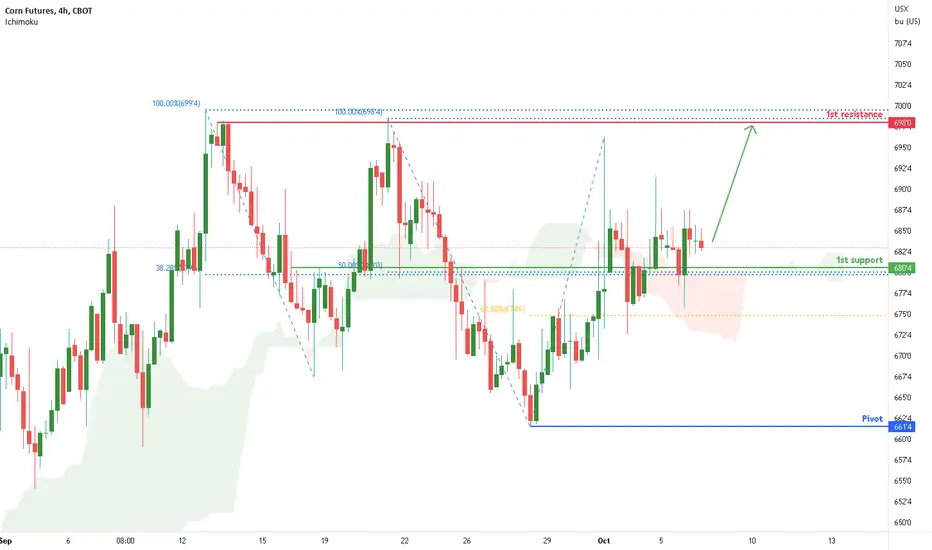
Corn Futures ( ZC1! ), H4 Potential for Bullish Momentum Title: Corn Futures ( ZC1! ), H4 Potential for Bullish Momentum
Type: Bullish Momentum
Resistance: 680.00
Pivot: 667.50
Support: 661.75
Preferred Case: On the H4, the overall price is bearish. In addition, the price is below the Ichimoku cloud, indicating a bear market. Price has broken through the Pivot at 667.4, which corresponds to the previous swing low. Price also rebounded from the first support and rose above the first pivot. Price may maintain its short-term bullish momentum and move towards the first resistance level at 680.0, where the 38.2% Fibonacci line is located.
Alternative scenario: The price could reverse and head back down to the first support level at 661.75, where the -27.2% Fibonacci expansion is located.
Fundamsentals: There is no major news.
Wednesday notes - SPX Wheat Gold DXY DAX Bonds etc.Some pre market commentary, SPX - expecting a bear trap after open, then higher. Wheat may be affected by the hurricane in Florida, Bonds hit an important fib extension, Gold looks promising if it can get over 1675 resistance, DXY also looks like it may pullback - BTC could still move to lower 18000 area before a move up (would align with one more low in equities) but it doesn't have to go down that far. Dax has broken monthly trendline, expect a retest over the coming weeks.
I forgot oil - looks good for a strong bounce here, pullbacks are likely bought.
OK good luck!

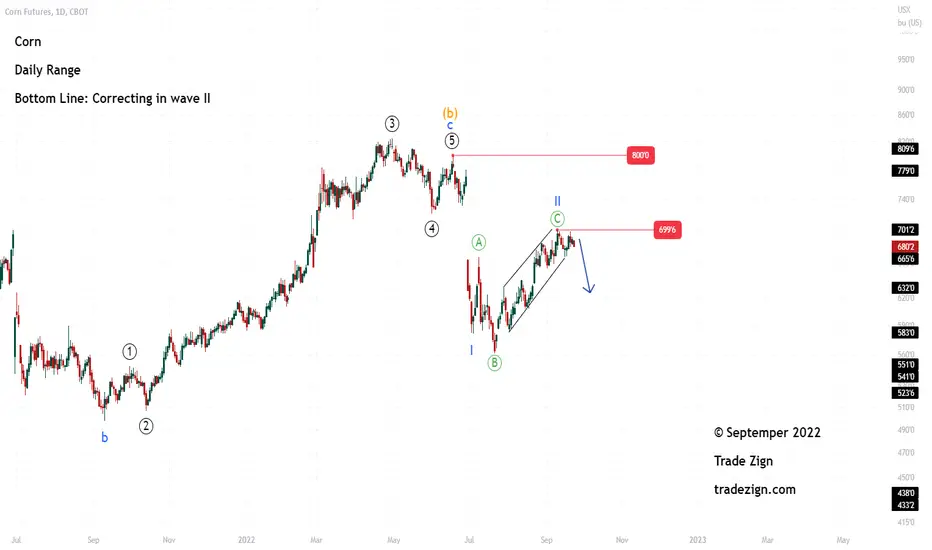
Commodity Corn idea (28/09/2022)corn
We expect a drop in corn grains in the coming period and the end of the rise in wave ((C)) of wave II and the beginning of the decline in wave III targeting. prices of 585 and the decline depend on the decisive point 699

Corn Futures ( ZC1! ), H4 Potential for Bearish Momentum Title: Corn Futures ( ZC1! ), H4 Potential for Bearish Momentum
Type: Bearish Momentum
Resistance: 6.900
Pivot: 667.50
Support: 6.310
Preferred Case: Overall price is bearish on the H4. To add on confluence, the price is also below the Ichimoku cloud which indicates a bear market. Price has broken through the 1st resistance at 6.900 where the 161.8% and 127.2% Fibonacci extension lines are. If this bearish momentum continues, expect price to continue heading towards the 1st support at 6.310 where the larger 78.6% Fibonacci line lies.
Alternative scenario: Alternatively, the price may go back up through the 1st resistance and head towards the pivot at 7.630
Fundamentals: No major news

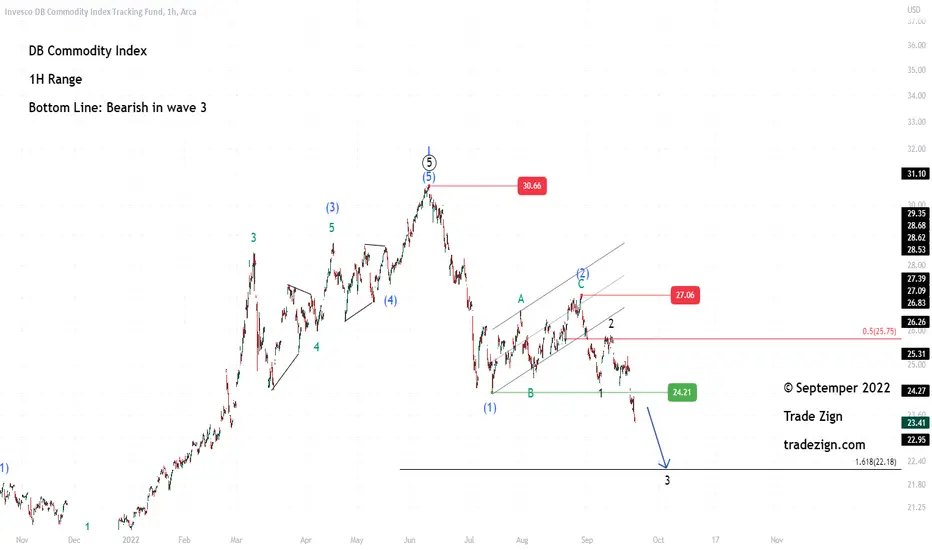
DB. commodity index idea (27/09/2022)DB. commodity index
We expect the index to continue declining because prices are below the 27.05 resistance point, and wave (2) has already ended and started falling in waves (3). We expect prices to drop to 1.618% at 22.18, but currently, we expect the correction to continue to 61% at 26.06 to end wave 2 before descending again.
Corn Futures ( ZC1! ), H4 Potential for Bearish MomentumTitle: Corn Futures ( ZC1! ), H4 Potential for Bearish Momentum
Type: Bearish Momentum
Resistance: 679.25
Pivot: 667.50
Support: 660.00
Preferred Case: Overall price is bearish on the H4 with a retail double top formed. Price is also below the Ichimoku cloud which indicates a bear market. Price has broken through and closed the pivot at 667.4 where the previous swing low is. Expecting price to continue this bearish momentum and head towards the 1st support at 660.0 where the 127.2% Fibonacci extension line is.
Alternative scenario: Alternatively, the price may reflect off the pivot back up towards the 1st resistance
Fundamentals: No major news
Commodity Cacao idea (26/09/2022)cocoa
After the decline and breaking the bottom of 2313, the commodity became to decline in the coming period, and we expect the completion of the ((E)) leg at lower levels that may reach the level of 90% before the rebound and reversal and the decisive point 2092

Corn Futures ( ZC1! ), H4 Potential for Bearish Momentum Title: Corn Futures ( ZC1! ), H4 Potential for Bearish Momentum
Type: Bearish Momentum
Resistance: 679.25
Pivot: 667.50
Support: 660.00
Preferred Case: Overall price is bearish on the H4 with a retail double top formed. Price has broken through the 1st resistance at 679.25 where the 61.8% Fibonacci line is. Price could possibly retrace back up towards 677.6 where the 38.2% Fibonacci line and 1st resistance lie before heading down, breaking the pivot at 667.5 and then moving towards 1st support at 660.00 where the 127.2% Fibonacci extension line is.
Alternative scenario: Alternatively, the price may continue heading down towards the pivot before bouncing back up towards the 1st resistance.
Fundamentals: No major news
Supply bull vs. demand bear clouds cotton's outlookCotton prices have been very volatile in 2022. The three-month implied volatility on cotton is currently at 43.7% fast approaching the levels last seen in 2011. A pickup in volatility has historically been an important indicator of a change in trend.
Back in 2011, Texas (the biggest growing cotton state in the US) witnessed the driest year on record. The reason for the drought was the weather anomaly La Nina. The La Nina results in an abnormal cooling of waters in the equatorial Pacific Ocean that is linked to severe droughts in the southwestern parts of the US. In the wake of the drought, the US Department of Agriculture (USDA) cut its estimate of 2011/12 cotton production by 1mn bales to 17mn bales. Cotton prices reached a record 215.151 USD/lbs in response.
Drought plaguing US’s biggest cotton growing state
We are seeing history repeat itself with a persistent drought in Texas this year. The National Oceanic and Atmospheric Administration sees a 72% chance of La Nina between November and January raising the odds for a rare third-straight La Nina to form across the Pacific. USDA has slashed its supply projections for global cotton ending stocks by 1.5mn bales in 2022/23. Production is lowered nearly 3.1mn bales whilst consumption is reduced by 800,000 bales. US producers increased their cotton acreage by 11% this season to 5.05m hectares. But, with the drought becoming more severe over the last couple of months, the USDA expects that the harvested area won’t exceed 2.89m ha. The abandonment of 43%, if confirmed, will be by far the highest since USDA records began in 1960. Owing to historically high abandonment in the US Southwest region, US production estimates are forecast to reach their lowest level since 2009/10.
The US is the world’s largest exporter of cotton, having more than 27% share of the world export market. That implies that the fall in US production will dampen the world trade surplus, putting pressure on declining inventories.
Harsh climate conditions amongst key cotton producers threaten supply
Unpredictable weather patterns have been challenging the cotton crop outlook in other key producer countries as well. Drought is hitting China’s cotton crop in the Xinjiang province, which grows majority of the country’s crop. In China, ending stocks are estimated at 36.2 million bales in 2022/23, the lowest in 4 years2. Australia, Brazil, and Pakistan experienced untimely rains that have reduced a large share of their grades. The World’s stocks to use ratio at 68.25% is at its lowest in five years highlighting the constraints on supply with respect to demand.
Cotton’s demand outlook set to weaken amidst slowing global economy
Cotton consumption is likely to weaken amidst a challenging macroeconomic backdrop. Europe is on the brink of a recession and the European consumer will be exposed to soaring energy costs. Meanwhile the US consumer’s spending pattern is shifting away from goods to services. In China, the economic headwinds are multifaceted – from a weaking property market, intermittent covid lockdowns alongside supply shortages to strategically imported goods. The outlook for apparel and textile consumption looks tricky. Consumption in 2022/23 is projected lower than a month ago in the US, Pakistan, Vietnam, Turkey, and Bangladesh3.
Conclusion
Supporting prices higher has been the 25.8%4 rise in speculative positioning over the past month. A 12% unwind in short positioning alongside a 10% build up in long positioning underscores the improvement in sentiment towards the cotton markets. The front end of the cotton futures curve remains in backwardation with a positive roll yield of 3.2% versus 8.5% a month back. Evidently the supply situation remains tight however amidst a tougher macroeconomic environment cotton prices are likely to walk a tight rope. In order for cotton prices to stage a sustained move higher we will need to see an improvement in demand.
Sources
1 Source: Bloomberg as of 4 March 2011
2 Cotton Outlook August 2022, Economic Research Service
3 United States Department of Agriculture
4 Source: CFTC, from 19 July 2022 to 16 August 2022
This material is prepared by WisdomTree and its affiliates and is not intended to be relied upon as a forecast, research or investment advice, and is not a recommendation, offer or solicitation to buy or sell any securities or to adopt any investment strategy. The opinions expressed are as of the date of production and may change as subsequent conditions vary. The information and opinions contained in this material are derived from proprietary and non-proprietary sources. As such, no warranty of accuracy or reliability is given and no responsibility arising in any other way for errors and omissions (including responsibility to any person by reason of negligence) is accepted by WisdomTree, nor any affiliate, nor any of their officers, employees or agents. Reliance upon information in this material is at the sole discretion of the reader. Past performance is not a reliable indicator of future performance.
Commodity Corn idea (23/09/2022)Corn
The decline continues, since trading is less than the top of the B wave at 699.75 prices, and this decline continues to lower to the end of the III wave, targeting 585.75 prices in the medium term as well as in the long term