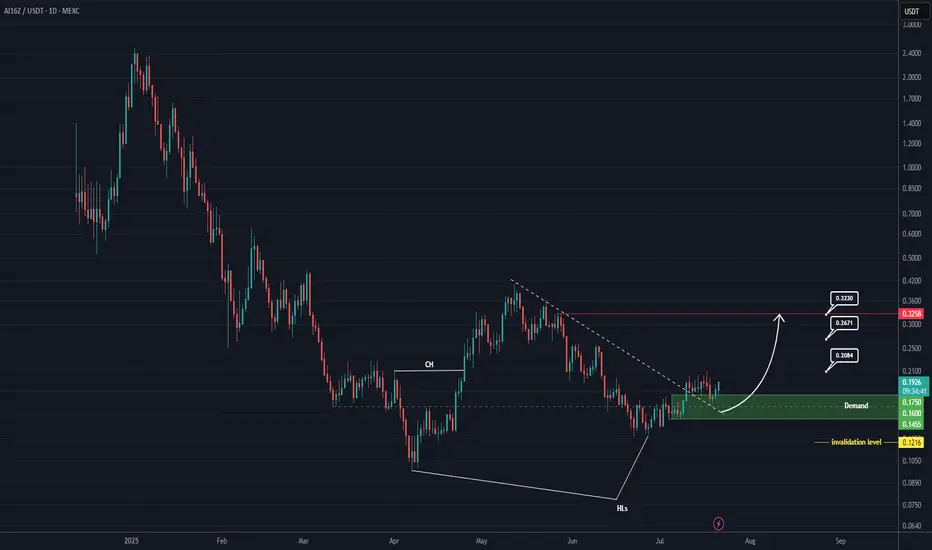
AI16Z Analysis (1D)Given the bullish CH, the breakout of the trendline, and the formation of a support zone, it appears that this token is aiming to move toward the targets marked on the chart.
Additionally, a double bottom pattern is visible at the lows, and higher lows have been recorded for this asset.
A daily candle closing below the invalidation level would invalidate this analysis.
For risk management, please don't forget stop loss and capital management
When we reach the first target, save some profit and then change the stop to entry
Comment if you have any questions
Thank You
Ai16zbtc
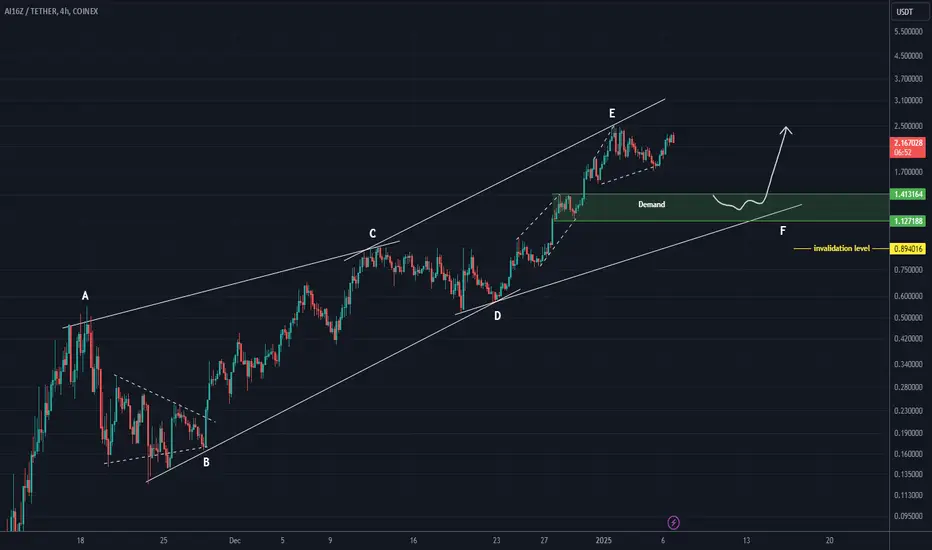
AI16Z ANALYSIS (4H)The AI16Z symbol appears to be within a large diametric pattern, currently at the end of wave E.
For a rebuy, it's crucial to execute this on a support zone, especially for assets that have experienced significant pumps.
Based on the structure, if the price reaches the entry zone, we can look for buy/long positions around the green area.
The target could be the top of wave E, but if you achieve reasonable profit, consider securing your gains.
A daily candle close below the invalidation level will invalidate this analysis.
For risk management, please don't forget stop loss and capital management
Comment if you have any questions
Thank You