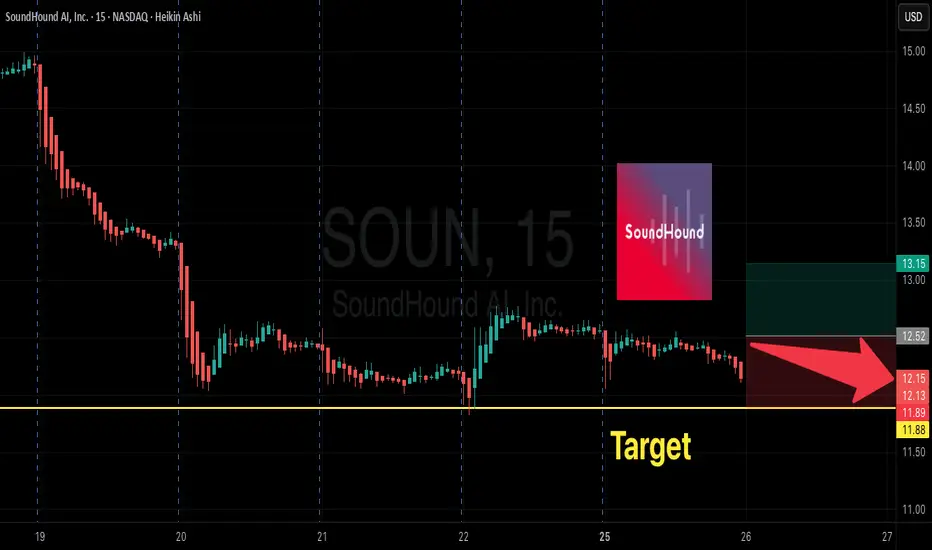
SOUN Bearish Swing Play | \$12P Sept 5
# 🔻 SOUN Bearish Swing Play | \$12P Sept 5 🚨
📊 **Consensus Bias**: Moderately BEARISH (5–10d swing)
✅ Daily RSI <45 + negative MACD
✅ Short-term momentum strongly negative (5d/10d)
✅ \$12 Put OI + liquidity support strike
⚠️ Weakness: Volume only average (no capitulation), options flow neutral (C/P \~1.0)
---
### 💡 Trade Setup
* 🎯 **Instrument**: SOUN
* 🔀 **Direction**: PUT (long put / bearish)
* 💵 **Strike**: \$12.00
* 📅 **Expiry**: 2025-09-05 (11d)
* 💰 **Entry**: \$0.55 (ask)
* 🛑 **Stop**: \$0.37 (\~33% risk)
* 🎯 **Targets**:
• +50% → \$0.83 (scale)
• +100% → \$1.10 (main target)
---
### ⚡ Risk / Notes
* Small size only (1 contract \~1–2% risk)
* Theta burn in final week — exit early if momentum fades
* Watch for failed breakdowns (volume too weak = false move)
---
🔥 **Bottom Line**: Models converge on bearish momentum → \$12 PUT Sept 5 is the cleanest strike. Trade small, tight stop, ride momentum for a 5–10 day bearish swing.
---
### 📌 Tags
\#SOUN #OptionsTrading #SwingTrade #Bearish 📉🔥
Aianalysis
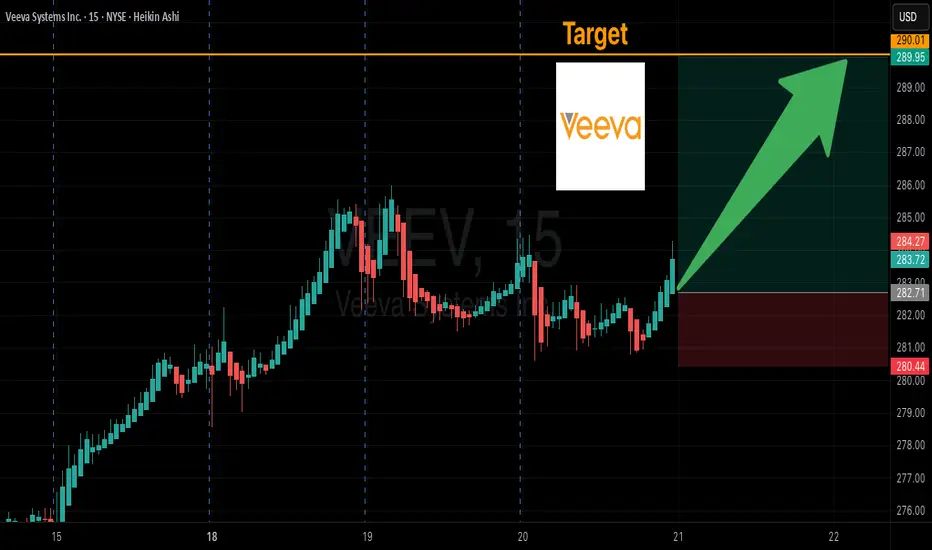
VEEV Call Play: Riding the Smart Money Flow
## 🚀 VEEV Weekly Options Setup (Aug 20, 2025) 🚀
📊 **Market Outlook:**
* ✅ Options Flow: **61 Calls vs 4 Puts → C/P Ratio = 15.25** 💥
* 📉 RSI: **Daily = 49.5 (rising)** | **Weekly = 61.0 (falling)** → mixed 📊
* 📊 Volume: **0.9x last week** → weaker conviction
* 🏦 Overall Sentiment: **Moderately Bullish** 🌟
---
💡 **TRADE IDEA:**
* 🎯 **Instrument:** VEEV
* 🟢 **Direction:** CALL (LONG)
* 🎯 **Strike:** \$290.00
* 💵 **Entry Price:** \$9.90
* 📅 **Expiry:** 2025-09-19
* 🛑 **Stop Loss:** \$5.35 (−50%)
* 🎯 **Profit Target:** \$14.03 → \$21.40 (+30% to +100%)
* ⏰ **Entry Timing:** Market Open
* 💪 **Confidence:** 65%
---
⚠️ **Risks to Watch:**
* ⚡ Weak volume = less upside fuel
* 🌍 Macro news impact
* 📉 **Close < \$273 = cut trade fast**
---
🔥 **Hashtags for Reach** 🔥
\#VEEV #OptionsFlow #TradingSetup #StockMarket #SwingTrade #OptionsTrading #TradingView #BullishMomentum #SmartMoneyFlow #CallOptions
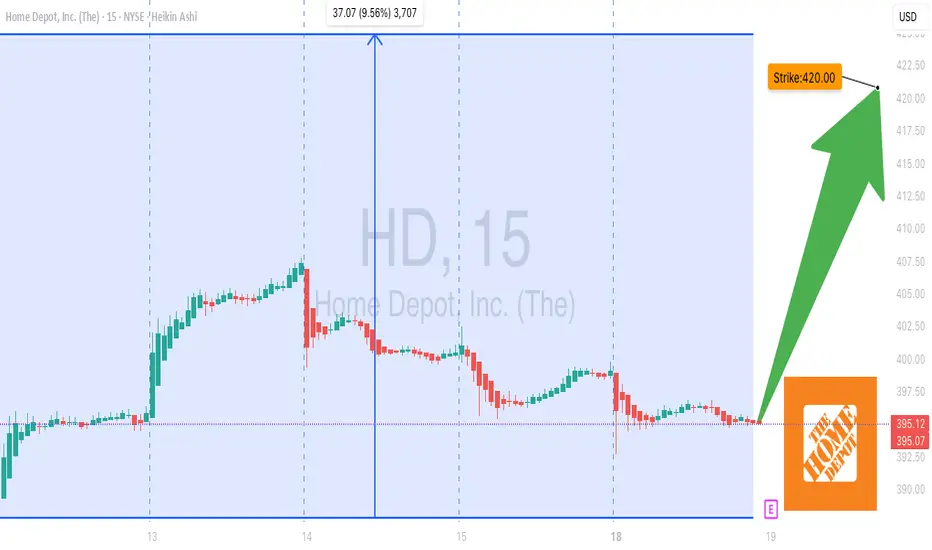
Home Depot 420C Call Setup– Big Move Expected on Earnings
# 🛠️ HD Earnings Options Play – 8/22 BMO
📊 **Market Context**
* Revenue Growth: +9.4% TTM 📈
* Gross Margin: 33.3%, Operating Margin: 12.9%, Profit Margin: 9%
* Forward EPS: \$15.60, Consensus Buy Rating
* Technical Momentum: +7.7% price drift past 2 weeks, key support \$380 / resistance \$420
* Options Flow: Call-heavy volume at \$420 strike, moderate bullish skew
* IV Rank: 65%, priced for \~3.5% post-earnings move
---
## 🎯 Trade Setup (Pre-Earnings Call)
* **Instrument**: HD
* **Direction**: CALL (LONG)
* **Strike**: \$420.00
* **Expiry**: 2025-08-22
* **Entry Price**: \$0.83
* **Profit Target**: \$3.32 (\~300% potential)
* **Stop Loss**: \$0.42 (50% of premium)
* **Size**: 2 contracts
* **Confidence**: 75%
* **Entry Timing**: Pre-earnings close
* **Earnings Date/Time**: 8/22 BMO
* **Expected Move**: \$5.00
---
## 🧠 Key Notes & Risk Management
* **Position Sizing**: Limit exposure to manageable portfolio risk
* **Exit Scenarios**:
* Profit Target → \$1.66 or \$3.32
* Stop Loss → \$0.42
* Time Exit → Close within 2 hours post-earnings if neither triggered
* **Gamma & Volatility Risk**: Moderate due to pre-earnings timing
---
# ⚡ HD 420C EARNINGS PLAY ⚡
🎯 Entry: \$0.83 → Target: \$3.32
🛑 Stop: \$0.42
📅 Exp: 8/22 BMO
📈 Bias: Moderate Bullish (75%) 🐂
---
📊 **TRADE DETAILS JSON**
```json
{
"instrument": "HD",
"direction": "call",
"strike": 420.00,
"expiry": "2025-08-22",
"confidence": 75,
"profit_target": 3.32,
"stop_loss": 0.42,
"size": 2,
"entry_price": 0.83,
"entry_timing": "pre_earnings_close",
"earnings_date": "2025-08-22",
"earnings_time": "BMO",
"expected_move": 5.0,
"iv_rank": 0.65,
"signal_publish_time": "2025-08-18 14:00:30 UTC-04:00"
}
```
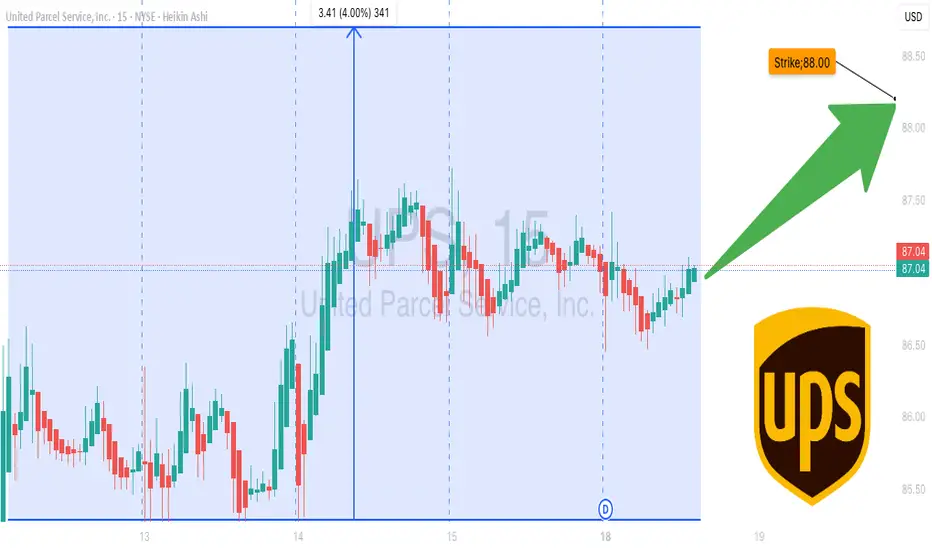
UPS Momentum Trade: Buy $88C → Target 100%+ Return by Friday
# 🚚 UPS Weekly Options Setup (8/18 – 8/22)
🔥 **Institutional Flow Signals a Bullish Week** 🔥
All major AI reports (xAI, DeepSeek, Google, Anthropic) are calling **MODERATE BULLISH**, backed by:
* 📊 **Call/Put Ratio = 3.47** → Strong institutional bias
* 📉 **VIX < 22** → Premiums favorable for long calls
* ⚠️ **RSI Bearish** → Risk of reversal, so keep stops tight
---
## 🎯 Trade Setup
* **Instrument**: UPS
* **Direction**: CALL (LONG)
* **Strike**: \$88.00
* **Expiry**: 2025-08-22
* **Entry**: \$0.92
* **Stop Loss**: \$0.46 (-50%)
* **Target**: \$1.38 – \$1.84 (+50% to +100%)
* **Confidence**: 65%
* **Timing**: Enter at open → Exit by Thursday (avoid gamma burn!)
---
## 📈 Breakeven @ Expiry
👉 \$88.92 (Strike + Premium)
UPS must close above **\$88.92 by 8/22** for profit at expiry.
But plan is **exit early** on IV move → don’t hold into Friday risk!
---
## 🧠 Key Risks
* Macro shock headlines 📰
* RSI weakness → possible fakeouts ⚠️
* Volatility spike → premium whipsaw 🎢
---
# ⚡ UPS 88C WEEKLY PLAY ⚡
🎯 In: \$0.92 → Out: \$1.38–\$1.84
🛑 Stop: \$0.46
📅 Exp: 8/22
📈 Flow > RSI → Betting with the whales 🐋
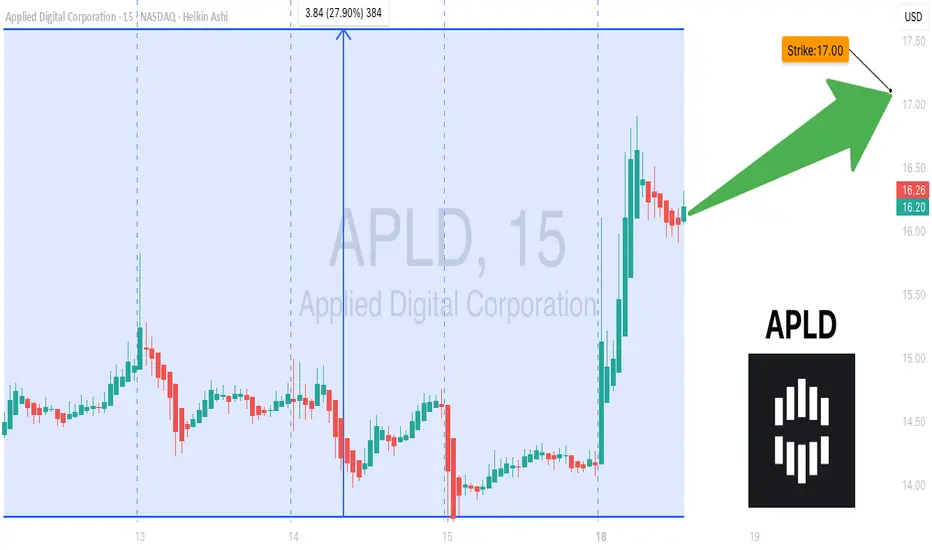
APLD Gamma Squeeze Watch: Calls Loading Into Expiry! 🚀 APLD Weekly Options Trade Analysis (2025-08-18)
### 🔎 Comprehensive Summary
APLD weekly options data shows **strong bullish sentiment**, supported by:
* **Call/Put Ratio:** 2.40 (heavy call bias)
* **RSI:** >70, confirming strong momentum
* **Institutional Flow:** Aligns with bullish catalysts (price target upgrades)
⚠️ **Weakness:** Weekly volume didn’t surpass the prior week, raising some caution.
---
### 📊 Agreement & Disagreement
✅ **Agreement Across Models:**
* Strong bullish trend confirmed by RSI & call/put ratio
* Volatility environment favorable (low VIX)
* Best trade setup: **Calls**
❌ **Disagreement:**
* Some models emphasize weak volume as a potential risk
* Others dismiss this due to strength in bullish momentum
---
### 📝 Trade Plan
* **Overall Market Direction:** ✅ Bullish
* **Strategy:** Buy single-leg, naked calls with strong liquidity
**Trade Setup**
* 🎯 **Strike:** \$17.00 Call
* 📅 **Expiry:** Aug 22, 2025 (4 DTE)
* 💵 **Entry Price:** \$0.45
* 🛑 **Stop Loss:** \$0.23 (\~50% premium)
* 🎯 **Profit Target:** \$0.90 – \$1.12 (100-150% gain)
* ⏰ **Entry Timing:** Market open
* 📈 **Confidence Level:** 80%
---
### ⚠️ Key Risks
* **Gamma Risk:** High with only 4 DTE — position requires tight monitoring
* **Volume Weakness:** May hinder sustained breakout if institutional support falters
---
## 📊 Trade Snapshot
* **Instrument:** APLD
* **Direction:** CALL (LONG)
* **Strike:** \$17.00
* **Entry Price:** \$0.45
* **Target:** \$1.00+
* **Stop:** \$0.23
* **Expiry:** 08/22/2025
* **Size:** 1 contract
* **Confidence:** 80%
* **Signal Time:** 2025-08-18 12:05:33 EDT
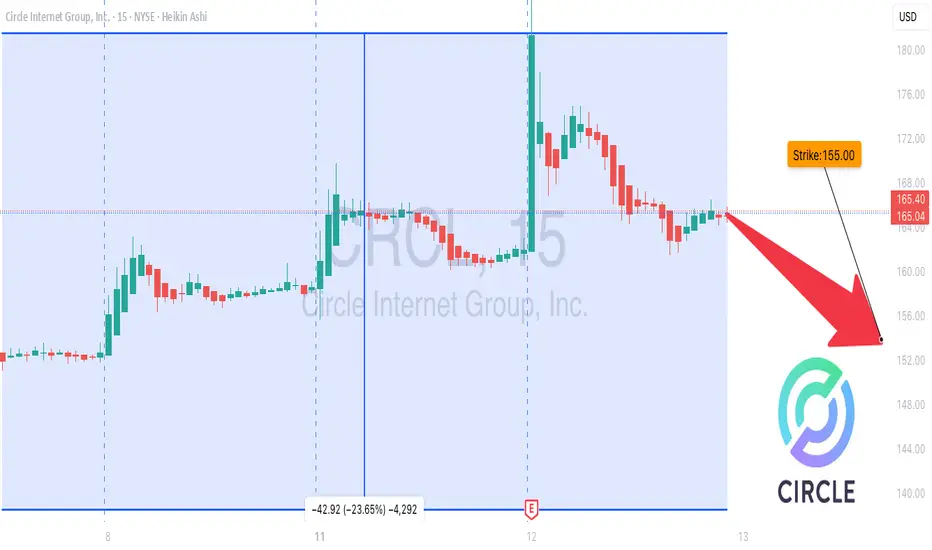
CRCL on the Edge: Bearish Play Loading… 📉 CRCL Weekly Options Alert (Aug 12, 2025)**
**Bias:** ⚠ **Neutral → Bearish** — Weak volume + bearish weekly RSI
📊 **Quick Stats:**
* **Daily RSI:** 40.8 ↗ (bullish divergence from oversold)
* **Weekly RSI:** 58.7 ↘ (bearish drift)
* **Options Flow:** Call/Put = **1.19** → neutral
* **Volume:** 1.0× last week — no institutional conviction
* **Gamma Risk:** Moderate — 3 DTE & rising time decay
💡 **Consensus Take:**
* Lack of strong buying pressure + bearish weekly trend = higher downside risk short term.
**Trade Idea:**
* **Type:** Naked PUT
* **Strike:** \$155.00
* **Expiry:** Aug 15, 2025
* **Entry:** \$6.22
* **PT:** \$10.90 (+75%)
* **SL:** \$2.80
* **Confidence:** 68%
* **Entry Timing:** Open
⚠ **Risks:**
* Earnings news could swing price violently
* Daily RSI divergence could spark short-term bounces against your position
---
**📈 TL;DR:**
Weekly trend still weak, volume flat, options flow balanced → bearish skew.
\#CRCL #OptionsTrading #WeeklyOptions #PutOptions #OptionsFlow #StockMarket #TradingSetup #BearishTrade #TechnicalAnalysis #OptionsAlert
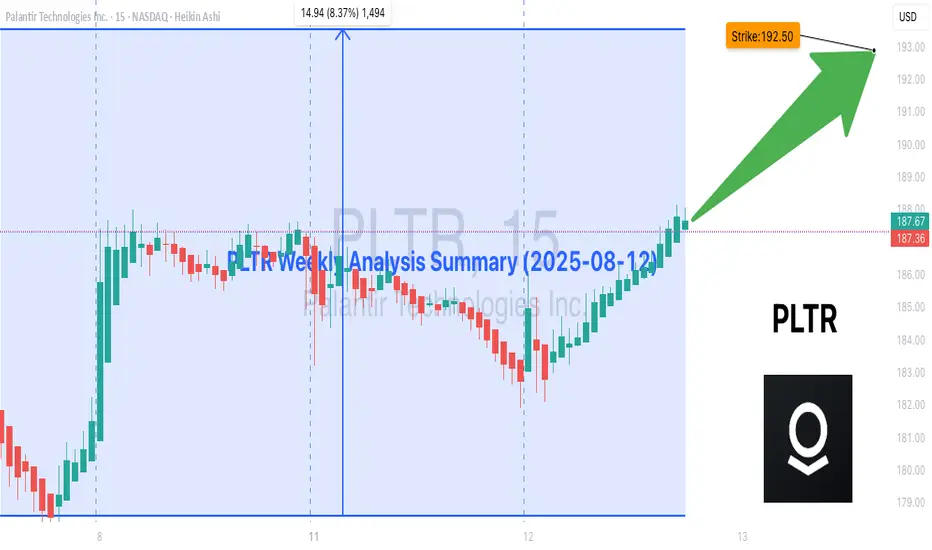
PLTR Weekly Options Outlook – Overbought & Losing🚨 PLTR Weekly Options Outlook (Aug 12, 2025) – Overbought & Losing Steam? 🚨
### **Market Sentiment**
* **Call/Put Ratio:** 0.81 → Neutral bias
* **Days to Expiration:** 3 → Gamma risk & fast time decay kicking in
* **VIX:** 15.3 → Low volatility = easier directional plays
### **RSI Check**
* **Daily RSI:** 75.3 → Overbought, trending **down**
* **Weekly RSI:** 81.5 → Overbought, trending **down**
* Momentum exhaustion likely → risk of **pullback/consolidation**
### **Volume & Options Flow**
* Weekly volume **+150%** → Institutional participation confirmed
* Options flow balanced (calls ≈ puts) → Hedging, not aggressive bets
### **Consensus Across Models**
✅ Agreement: Strong institutional flow, but RSI decline = caution
⚠ Disagreement:
* Some models → **No trade** (momentum exhaustion risk)
* Others → **Moderate bullish** (volume support)
### **Conclusion**
📉 Short-term bias: **Neutral → Slight Bearish** despite bullish volume
📊 **Confidence Level:** 65%
🚫 No naked calls recommended here — wait for better entry after a pullback
---
**💡 Key Risks:**
1. RSI exhaustion → bigger pullback possible
2. Volatility shift before expiration → premium decay risk
---
📌 **Tags:**
\#PLTR #OptionsTrading #WeeklyOutlook #StockAnalysis #GammaRisk #Overbought #RSI #VolumeAnalysis #InstitutionalFlow #TradingView
AI Generated Bitcoin Prediction: No ATH This Week! 📉 AI Generated Bitcoin Prediction: No ATH This Week! 🚫📈
Euphorisme is what traps people... watch out.
📌 Overview
In this 1H Heikin Ashi chart for BTC/USD, a clear AI-generated prediction outlines a volatile week ahead, but with no signs of a new all-time high (ATH). While price action recently broke above key resistance levels around $119,300–$119,570, the projected trajectory is more cautious than bullish.
The blue line overlay sketches a speculative wave structure — an AI-based forecast — suggesting multiple failed attempts to break above $122,165, a level that coincides with previous rejection zones.
🔍 Key Technical Levels
Level Significance
$122,165 Major rejection level
$120,916.94 Resistance + liquidity zone
$119,568.92 Immediate rejection area
$118,313.11 EMA & SMA cluster support
$118,185.55 Short-term support
$117,893.78–$118,037.81 Bull trap range
⚠️ Why You Should Be Cautious
The AI-predicted price action shows a pattern of rising highs followed by sharp reversals.
Multiple red inverted triangles suggest lower high formations, a sign of weakening bullish momentum.
Current levels around $119,300 are still within a macro supply zone, with price likely to consolidate or retrace.
🧠 Psychological Trap: Euphoric Longing
Markets often punish emotional entries — and euphoric breakouts like we saw at $119,500 tend to trigger FOMO longs. This is where smart money exits, not enters.
“If it feels like you're late to the move, you probably are.”
🔄 Mid-Term Scenario
If the AI prediction holds:
Expect volatility with fake breakouts.
Watch for distribution near $122K.
A potential drop toward $118K–$117.8K may offer a better re-entry.
📆 Macro Context
The week is filled with economic events (marked below the chart), and the AI model seems to expect choppy reactions, not a clear breakout. These red calendar icons often correlate with increased volume and traps.
🧩 Strategy Suggestion
Avoid chasing pumps into resistance zones.
Wait for confirmation or deviation from the projected path.
Consider setting alerts near $122K and $118K to monitor key reactions.
🧠 Final Thought:
ATH is a process, not an event. If the AI is right, we’re not there yet.
“Let the herd long the top, and let you short the trap.” – Smart Money
💬 Share your thoughts below. Do you agree with the AI's prediction?
🔔 Follow for more predictive insights & logic-backed analysis.
#Bitcoin #BTCUSD #CryptoTrading #NoATH #SmartMoney #TradingPsychology #EuphoricTrap #HeikinAshi #BTCAnalysis

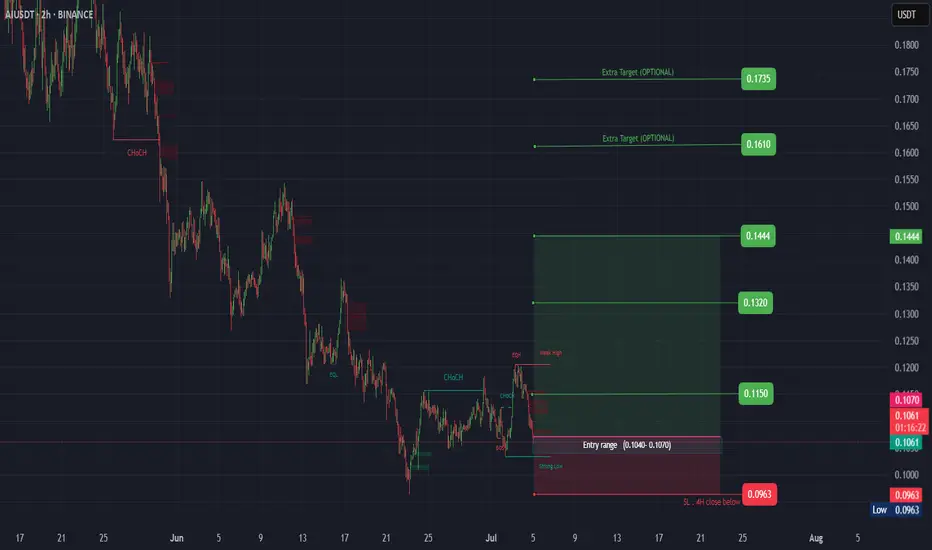
AI ( SPOT )BINANCE:AIUSDT
#AI/ USDT
Entry( 0.1040- 0.1070)
SL 4H close below 0.0963
T1 0.1150
T2 0.1320
T3 0.1444
_______________________________________________________
Golden Advices.
********************
* collect the coin slowly in the entry range.
* Please calculate your losses before the entry.
* Do not enter any trade you find it not suitable for you.
* No FOMO - No Rush , it is a long journey.
GBPCAD - Weekly Forecast - Technical Analysis & Trading Ideas!Midterm forecast (Daily Time-frame):
While the price is below the resistance 1.82310, beginning of downtrend is expected.
Technical analysis:
A peak is formed in daily chart at 1.82320 on 12/19/2024, so more losses to support(s) 1.79228, 1.78439, 1.76819 and minimum to Major Support (1.74790) is expected.
Take Profits:
1.79228
1.78439
1.76819
1.75765
1.74790
1.72705
1.70900
1.69267
1.67670
1.65599
1.63703
1.60894
Short-term forecast (H4 Time-frame):
A Head and Shoulder Reversal Pattern has formed and the neckline has also been broken.
Price is touching the neckline again.
It is very likely that the downward wave will start from this area.
__________________________________________________________________
❤️ If you find this helpful and want more FREE forecasts in TradingView,
. . . . . Please show your support back,
. . . . . . . . Hit the 👍 BOOST button,
. . . . . . . . . . . Drop some feedback below in the comment!
🙏 Your Support is appreciated!
Let us know how you see this.
Have a successful week,
ForecastCity Support Team

UK100 (FTSE) Weekly forecast, Technical Analysis & Trading IdeasMidterm forecast:(Daily TF)
The ascending flag taking shape suggests we will soon see another leg higher.
While the price is above the support 7911.37, resumption of uptrend is expected.
We make sure when the resistance at 8485.05 breaks.
If the support at 7911.37 is broken, the short-term forecast -resumption of uptrend- will be invalid.
A peak is formed in daily chart at 8385.30 on 12/09/2024, so more losses to support(s) 8083.43, 8007.24 and minimum to Major Support (7911.37) is expected.
Trading suggestion:
There is possibility of temporary retracement to suggested Trend Hunter Buy Zone (8007.24 to 7911.37). We wait during the retracement, until the price tests the zone, whether approaching, touching or entering the zone.
We would set buy orders based on Daily-Trading-Opportunities and expect to reach short-term targets.
Beginning of entry zone (8007.24)
Ending of entry zone (7911.37)
Take Profits:
8083.43
8183.03
8242.89
8380.25
8485.05
8664.21
8765.00
9000.00
__________________________________________________________________
❤️ If you find this helpful and want more FREE forecasts in TradingView,
. . . . . . . . Hit the 'BOOST' button 👍
. . . . . . . . . . . Drop some feedback in the comments below! (e.g., What did you find most useful? How can we improve?)
🙏 Your support is appreciated!
Now, it's your turn!
Be sure to leave a comment; let us know how you see this opportunity and forecast.
Have a successful week,
ForecastCity Support Team
