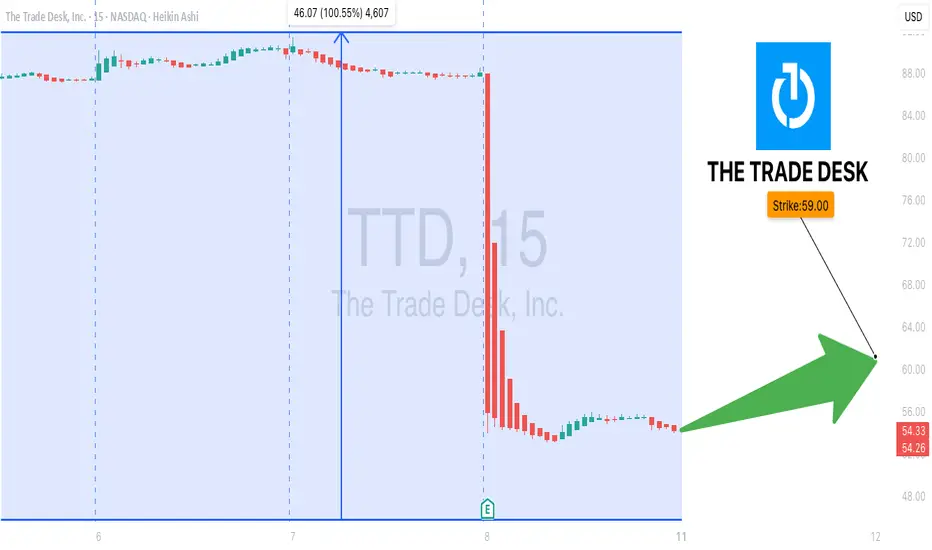
TTD Oversold Bounce Play — Call Option for Next Week🔥 TTD Oversold Bounce Play — Call Option for Next Week**
The Trade Desk (TTD) is deep in oversold territory (RSI daily 19.6, weekly 33.4) with 3.7x volume surge last week — signaling heavy institutional activity. While the macro bias leans bearish, a speculative bullish flow (call/put ratio 1.42) hints at a potential short-term rebound.
**🛠 Trade Setup:**
* **Instrument:** TTD
* **Direction:** CALL (LONG)
* **Strike:** \$59.00
* **Expiry:** 2025-08-15
* **Entry Price:** \$0.60
* **Profit Target:** \$1.20 (2x gain)
* **Stop Loss:** \$0.36
* **Size:** 1 contract
* **Entry Timing:** Market open
* **Confidence:** 65%
**📊 Key Factors:**
* Extreme oversold conditions
* Surge in weekly volume
* Speculative bullish options flow
* Risk of counter-trend move against broader bearish trend
**⚠ Risks:**
* Strong longer-term bearish momentum
* Low open interest = high volatility in premiums
---
**#TTD #TheTradeDesk #OptionsTrading #CallOptions #WeeklyOptions #OversoldBounce #BullishSetup #RSI #TechnicalAnalysis #TradingView #VolatilityPlay #SwingTrade #OptionsStrategy**
Aianalyst
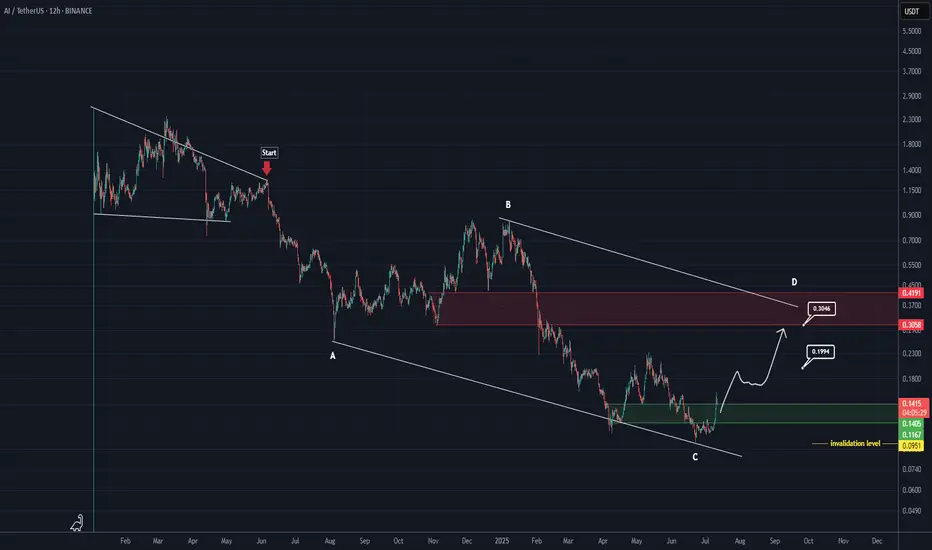
AI Looks Bullish (12H)The AI correction has started from the point marked as "start" on the chart.
It seems that wave C has completed, as its time cycle has finished and the price has reclaimed key levels.
As long as the green zone holds, the price can move toward the targets and the red box.
The targets are marked on the chart.
A daily candle closing below the invalidation level will invalidate this analysis.
For risk management, please don't forget stop loss and capital management
Comment if you have any questions
Thank You
#AI, $AI, #AIUSDT, AIUSD#AI ...... is in a very nice entry point and near stop loss to get high profit
#AI
NYSE:AI
#AIUSDT
#AIUSD
#swingtrade
#shortterminvestment
#ALTCOIN
#Cryptotading
#cryptoinvesting
#investment
##trading
#cryptocurrencytrading
#bitcoininvestments
#Investing_Coins
#Investingcoins
#Crypto_investing
#Cryptoinvesting
#bitcoin
#BTC
#BTCUSDT
BINANCE:AIUSDT
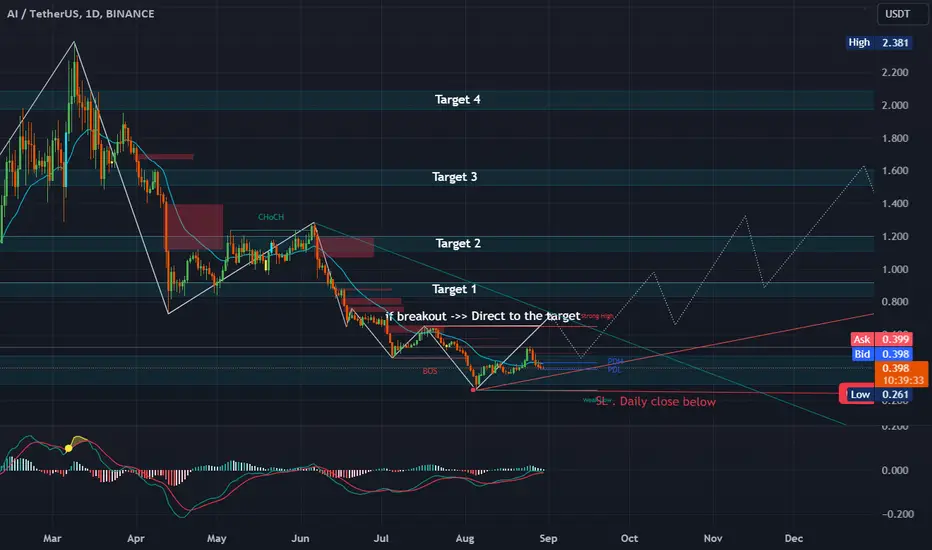
AI ANALYSIS (4H)From where we put a green arrow on the chart, a bullish diametric is formed.
We now appear to be in the middle of wave E.
Wave E of this diametric is a bullish wave.
If the price returns to the green range, we will look for buy/long positions
The targets are clear on the chart.
Closing a daily candle below the invalidation level will violate the analysis.
For risk management, please don't forget stop loss and capital management
When we reach the first target, save some profit and then change the stop to entry
Comment if you have any questions
Thank You

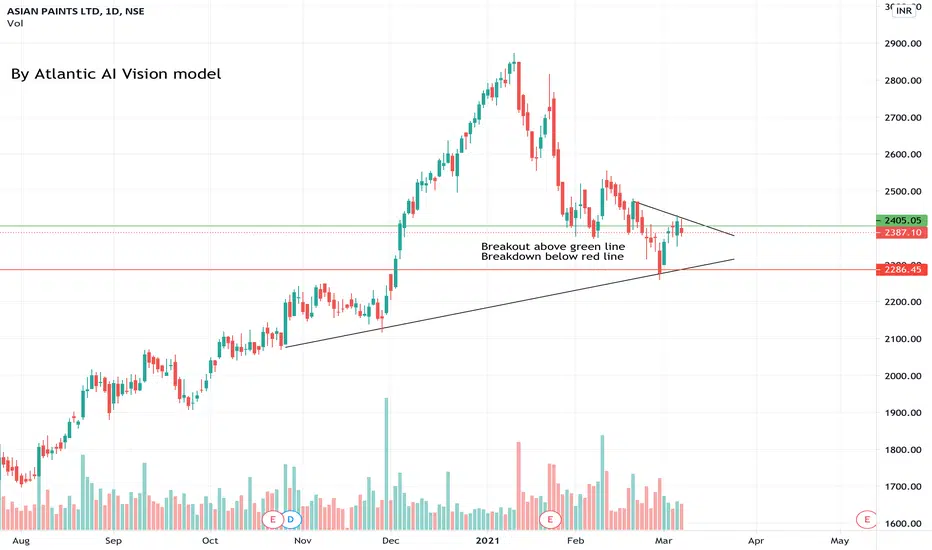
Atlantic AI Vision knowledge!Hey Trader,
Hope you're having a good time.
Check out the following 4 types of trades based on the above chart.
1. For Breakout LONG-
* If prices closes above Green line.
* Target = 2-3%/Previous High/major MA/Fibonacci level
* SL = Same Green line (if price closes below it!)
2. For Breakdown SHORT-
* If prices closes below Red line.
* Target = 2-3%/Previous Low/major MA/Fibonacci level
* SL = Same Red line (if price closes above it!)
3. For Support LONG-
* If prices closes above Red line.
* Target = 2-3%/Green line/Previous High/major MA/Fibonacci level
* SL = Same Red line (if price closes below it!)
4. For Resistance SHORT-
* If prices closes below Green line.
* Target = 2-3%/Red line/Previous Low/major MA/Fibonacci level
* SL = Same Green line (if price closes above it!)
-Your AI Analyst.
Perfect call by the AI AnalystAt 2:30 PM IST, 4th December 2020, our model predicted Long call above 13225.
And this thing got amazing high till 13275!
Our intra day members captured the whole strike in just 30 mins.
Amazing? isn't it?

Breakout or Breakdown? Sentiment's game!ApartWorker's Atlantic AI model detected RSI Anomaly with critical price positioning!
Play with both side hedged strategy and wherever the moves come with strength, you are protected with indefinite profits!!
Expert Advice by,
- The AI Analyst

Perfect call by the AI Analyst!The long call at around 12:30 PM, 2nd December 2020 worked excellent!
