RDDT Earnings Play — July 30 (BMO)
## 🚀 RDDT Earnings Play — July 30 (BMO)
**🎯 Bullish Call Trade | 75% Confidence | High Momentum Setup**
---
### 📈 REDDIT, INC. (RDDT) – EARNINGS SNAPSHOT
🧠 **Revenue Growth**: +61.5% TTM — AI + Ads combo paying off
💸 **Margins**:
• Gross: 90.8% ✅
• Op: 1.0% 🚩
• Profit: 8.1% 👍
🧾 **EPS Surprise Streak**: ✅ 5 for 5 | Avg. +191%
🎯 **Target Price**: \$155.58 (+9.5%)
⚖️ **Forward P/E**: 222.6 — Rich but justified?
**Score: 8/10**
📊 Sector: Comm Services (AI-driven tailwinds)
---
### 💥 OPTIONS FLOW SNAPSHOT
💰 Calls Stack at \$150 & \$160
🛡️ Puts cluster \$140–\$149 = Hedges, not bearish bets
📉 IV High = Juicy premiums
📈 Gamma Bias: Positive Skew
**Score: 7/10**
---
### 🔍 TECHNICAL CHECK
📍 Price: \~\$145.32
🧭 20D MA: \$147.89
📊 RSI: 59.5 (Momentum neutral, room to run)
🔓 Resistance: \$150
🛡️ Support: \$140
**Score: 6/10**
---
### 🌎 MACRO CONTEXT
🧠 Sector tailwinds from AI hype + digital ad rebound
🛑 No major regulatory red flags
**Score: 8/10**
---
## 🔥 THE TRADE SETUP
**📈 Direction**: Bullish
🎯 **RDDT 08/01 \$150C**
💸 **Entry**: \$9.55
🛑 **Stop Loss**: \$4.78
📈 **Target**: \$19.55+
🧮 **Size**: 1 Contract = \$955 Risk
🕒 **Entry Timing**: Pre-earnings close
📆 **Earnings Time**: BMO (Before Market Open)
📊 Expected Move: \~5%
📈 Setup = High risk / High reward, theta-sensitive
---
## ⚡ TRADE PLAN
✅ Take partial profit at 100%, full at 200%
⏳ Exit within 2H post-ER if target unmet
🛑 Cut below \$4.78 to cap drawdown
---
## 🧠 CONVICTION SCORE
🎯 75% Bullish Bias
📊 Based on fundamentals, options, and flow
📉 Risk = Valuation + Thin Op Margin
📈 Reward = Explosive upside w/ surprise history
---
💬 **Watch for \$150 breakout. If cleared post-ER = moonshot to \$160 possible.**
📢 #RDDT #EarningsTrade #RedditStock #CallOptions #AIStocks #TechMomentum #OptionsFlow #IVSurge #TradingViewIdeas #SwingTrade #OptionsStrategy #VolatilityPlays #RDDTstock
Aistocks

META Earnings Trade Setup — July 30 (AMC)
## 🧠 META Earnings Trade Setup — July 30 (AMC)
📈 **META (Meta Platforms Inc.)**
💥 **Confidence**: 85% Bullish
💡 **Play Type**: Pre-earnings call option
📊 **Fundamentals + Flow + Setup = High Conviction Swing**
---
### 📊 FUNDAMENTALS SNAPSHOT
✅ **Revenue Growth**: +16.1% YoY
✅ **Profit Margin**: 39.1%
✅ **Gross Margin**: 81.8%
📈 **8/8 EPS Beats** — Avg Surprise: +13%
🧠 **Digital Ad Rebound + AI Integration = Growth Engine**
🟢 **Score: 9/10**
📌 Bottom line: Elite execution + consistent guidance beats
---
### 🔥 OPTIONS FLOW CHECK
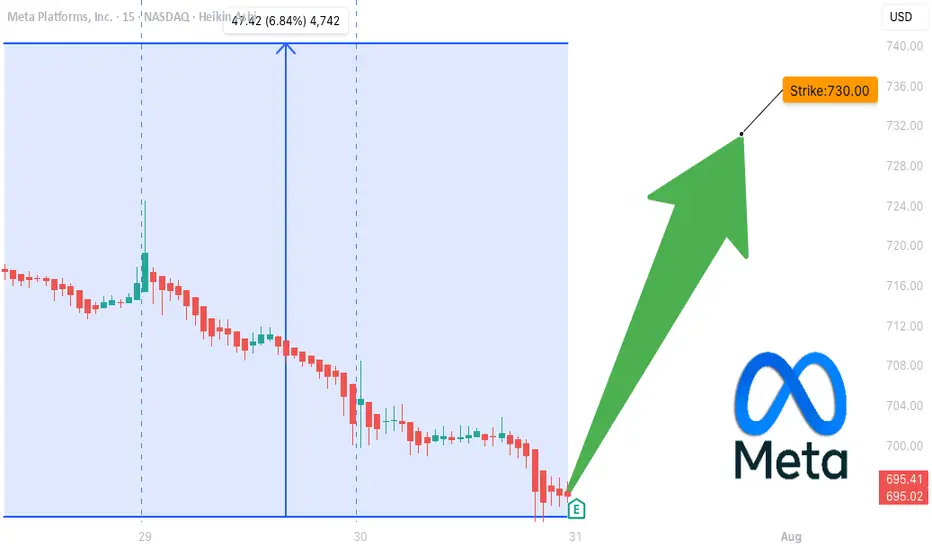
💰 **Call Walls**: \$720 / \$730
📈 **Call/Put Skew**: Bullish tilt
🔎 **IV Rank**: 0.65 — High enough for a move, not extreme
📈 **Market Expectation**: \~6% move
🟢 **Score: 8/10**
📌 Institutional flow leans long — smart money eyes upside
---
### 📉 TECHNICAL SETUP
📍 **Price**: \~\$700
📉 RSI: 34.34 → OVERSOLD
📉 20D MA: \$713.27 (near-term bounce target)
📌 Support: \$692.50 | Resistance: \$720
🟡 **Score: 7/10**
📌 Post-consolidation rebound setup into earnings
---
### 🌎 MACRO CONTEXT
💡 Growth + AI names in focus
📢 Communication Sector → Risk-On Rotation
📌 META riding digital ad/AI secular trends
🟢 **Score: 8/10**
📌 Macro tailwinds match company strengths
---
## 🎯 TRADE IDEA
**META 08/01 \$730 CALL**
💵 Entry: \$10.00
🎯 Target: \$30.00 (300% ROI)
🛑 Stop: \$5.00 (50% loss cap)
⏰ Entry: Pre-close on July 30 (AMC earnings)
📏 Size: 1 Contract (Risk \$1,000 max)
### ⚖️ Risk/Reward
* Max Risk: \$1,000
* Target Profit: \$3,000
* IV Crush Protection: **Exit within 2 hours post-earnings**
---
## 📌 WHY IT WORKS
✅ Meta beats 8 straight quarters
✅ Fundamentals elite
✅ Bullish options stack
✅ Oversold tech setup
⚠️ Risk? Always — but *structured speculation wins* 📐
---
📣 Tag someone who trades earnings like a sniper 🎯
\#META #EarningsPlay #OptionsTrading #IVCrush #CallOptions #TechStocks #AIStocks #TradingView #DigitalAds #SwingTrade #StructuredRisk
APLD (Applied Digital):EARNINGS TRADE SETUP (2025-07-30)
🚨 **EARNINGS TRADE SETUP: APLD (Applied Digital)**
🗓️ Earnings: **July 31 (AMC)**
💥 Confidence: **65% Moderate Bullish**
🔥 Recent Run: **+94% past 3 months**
🧠 AI Infrastructure Hype + High IV = Opportunity
---
### 📊 FUNDAMENTALS SNAPSHOT
🟢 **Revenue Growth**: +22.1% YoY
🔴 **Profit Margin**: -110.4%
🔴 **Operating Margin**: -34.7%
⚠️ Historical EPS Beat Rate: **12% only**
📈 Analyst Target: **\$14.61** (+42.8% upside)
🔎 **Verdict**: High growth, deep losses — speculative with upside
---
### 🧠 OPTIONS FLOW
💣 **High IV Crush Risk**
🟥 **Put Wall**: \$10.00 (6,700 contracts)
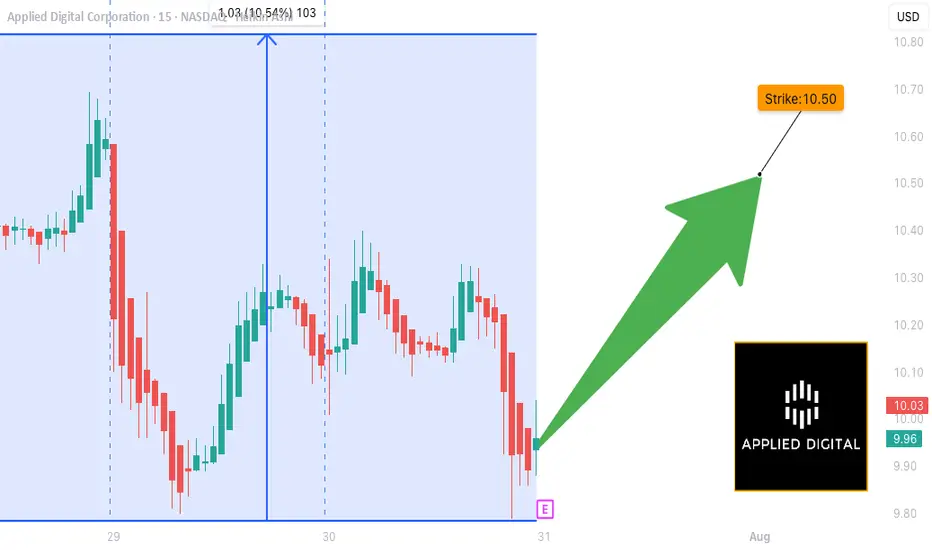
🟩 **Speculative Calls**: \$10.50 & \$11.00 loaded
⚖️ Mixed Sentiment → Tilted Bullish
---
### 📉 TECHNICAL CHECK
💹 Price: **\$10.12**
📉 Below 20D MA (\$10.31)
📌 Support: **\$10.00**
📌 Resistance: **\$10.50**
⚠️ RSI Cooling → Watch for breakout or rejection
---
### 💥 TRADE IDEA
**🎯 Call Option — Strike \$10.50 — Exp 08/01**
💵 Entry: \$0.57
🚀 Profit Target: \$2.28 (200–400% ROI zone)
🛑 Stop Loss: \$0.285
📈 Size: 1 contract (2% of portfolio)
🕓 Exit: 1–2 hours post earnings to avoid IV crush
---
### 🧠 TRADE LOGIC
Risky setup — but technicals + AI narrative + speculative flow = **earnings lotto ticket with strategy.**
💬 *"Speculation with structure beats blind YOLO."*
---
📌 Tag a trader who likes calculated risk 📈
📉 Don’t forget to scale OUT, not just IN.
\#APLD #EarningsPlay #OptionsTrading #TradingView #AIStocks #YOLOWithStops #IVCrushProof #CallOptions #SwingTrade #BullishSetup
Semiconductors & SOXL: A Bull ThesisWhy Semiconductors?
Virtually every single electronic device contains some form of a semiconductor unit within its components. The entire Bull theory on semiconductors as an industry could be reduced to this one sentence. The following, however, will introduce concepts contingent to the understanding of what is shaping the market for semiconductors. The weight of intra-industry, political, macroeconomic, and physical factors discerning an inconceivable upside potential for certain investments carrying maximum exposure to the sector, such as AMEX:SOXL . The last section contains my technical approach to trading SOXL.
We begin with the fundamental, and by fundamental, I refer to the simplest reasons for what is happening in the market up until now; [ Early morning Monday, 7/28 ].
Macroeconomic Context
Like essentially the rest of the market, SOXL hit its 1 year low of 7.23 USD on Monday, 4/7, following the announcement (and soon postponement) of global tariffs at levels not observed since the early 30's. This of course sparked a panic spiral in the entire market, leading to outflows from the S&P 500 of approximately 70 billion USD during the month of April. During this time we also saw a new, but familiar narrative emerge. Asset Managers, Such as J.P. Morgan set historically low price targets on the S&P 500, going as low as 5,200 USD. They reinforced their PTs with publications warning investors across the world that the risk of recession in the United States was raised to 80%, and this message was relayed across all media in parabolic fashion. While it does not seem too outward to assume an increased risk of recession due to tariffs by looking back on what we learned of the consequences from the Smoot-Hawley Tariff Act of 1930. There exists a widely overlooked, fundamental , reason as to why I can claim that the REAL risk of recession at the time that J.P. Morgan assigned an 80% risk of recession, was in actuality, 0% (I assume J.P. Morgan knew this but pushed the narrative anyways in order to acquire massive equity at a discount). If anyone has taken introductory macroeconomics in their lifetime, they may be familiar with the function for calculating GDP via the expenditure approach: GDP = C + I + G - NX. Now, why am I referencing high school/college economics basics, the answer to that lies in how we determine our rate of economic growth in the context of tariffs. The part of this formula that we must focus on is NX or Net Exports, the negative factor to GDP. Tariffs, if implemented would effectively decrease import volume, resulting in a smaller Net Exports, and ultimately a higher GDP calculation. Now, what makes this scenario unique, the tariffs having been postponed shortly after their inception, allowed US retailers to engage in front running, or the accelerated purchasing of foreign goods in advance of tariffs. During the month of April, we saw a 5.4% increase in import volume in US west coast ports. This increase in imports effectively caused the inverse impact on GDP growth that import tariffs themselves would have caused: front-running lead to import uptick, leading to a greater Net Exports, which results in lower (negative) GDP growth. Essentially, tariffs in the short-term increases GDP growth (in the long term deadweight loss, and cost structure distortion comes in to play, but that doesn't matter yet), however , tariffs that are announced but not immediately implemented will result in a lower GDP growth, coupled with uncertainty surrounding the whole situation that translated into a cut in CapEx as companies scrambled to determine if tariffs would f*ck them over or not. This argument is further supported by the trends observed in the foreign exchange market. You may have heard in the news that we are experiencing a period of "Dollar Weakness", and while, yes, you can clearly see that the USD has fared rather poorly against other currencies in most major dollar pairs over the past few months. The agent behind this isn't just that the dollar happens to be weak, it is a combination of factors that generate noise and volatility in the forex market. The two main factors highlighted by the media are 1. The obvious political policy instability, pushing bond yields higher, plus a significant debt ceiling raise as per the BBB and 2. the expectations of interest rate cuts over the next year. The other, less recognized major factor to dollar weakness is exactly what we described above: Increased imports means more dollars flowing out of the economy. When these dollars land abroad, they are converted into the native currency, driving down the demand for the dollar. Notice how none of the reasons described above, actually have anything to do with what truly drives foreign exchange markets. Over time, the strength/weakness of a currency is directly correlated to the strength/weakness of the underlying economy. To say that we can expect dollar weakness due to the aforementioned reasons outright ignores the economic growth potential that exists in our economy at this current time, subsiding the out-of-proportion tariff fears as a proponent to an economic crisis. In an all-encompassing view, what I would describe to be occurring on the macro level is a sort of "slingshot" effect: Trade imbalances and private sector response to policy unclarity results in a pullback in economic growth, one that we are now experiencing as a short-term effect. From a medium-long term perspective, assuming that tariffs aren't persistent in the long term, we would see full fledge economic boom, driven by non other than the growth of our technology sector, which at it's core, lies the almighty semiconductor.
Growth of AI as a driver of Semiconductor demand: Stable trajectory or Bubble Territory?
Having laid the economic framework for picking the general direction our market is heading in, we can now begin to talk about the internal combustion occurring within the world of technology, and the two letter term associated with just about every cool thing in the business world, that is of course AI. Now just to clarify, AI is not new, its been around for at least 20 years and has a well established role in the world prior to the existence of ChatGPT. What changed so drastically in recent years is the breakthrough into a new form of artificial intelligence, known as "Artificial General Intelligence" or AGI. Long story short: AGI's primary difference in the business context is the colossal amount of electrical infrastructure and computing power that is demanded by the development of these mega language models. As a result of the high barrier for entry to this new industry, only 5 AGI companies have arisen to the global stage: OpenAI, Google DeepMind, Anthropic, Microsoft, and DeepSeek. Increasing competition in this space through more players entering the market is unlikely at this time as the cost to create a standalone AGI model is so astronomical. This is a particularly good thing because it tells us that AGI as an industry can result in natural monopolies. The ultra-intensive RnD costs and Data Center infrastructure demands make it more sensical to have a greater number of resources dedicated to producing 1 AGI model, instead of dividing resources to develop multiple less optimized models (similar to how a water company holds a natural monopoly as competition in that industry would result in no foreseeable benefit to it's customers). A further effect from this dynamic lies in how businesses in this industry scale to expand, and its pretty straightforward: the more megawatt computing power a model can access, the more parameters a model can account for, and the more vast the dataset that model can train on, with enhancing speed and efficiency (GPT 4o takes into account >500B parameters in a given query). We see the concept of natural monopoly playing out as the concentration of market capitalization is becoming more extreme where firms like Google, Microsoft, and NVIDIA are absorbing larger share of the market, while trading at ever increasing Price/Earnings multiples. To many, this reflects a trend we saw during the dot com bubble, however what makes the AGI industry different is the nature of the good or service provided. During the dot com boom, companies saw speculative value based on only the fact that their business existed on the .com domain. We know that each of these businesses are unique, providing a good or service across whatever industry they were part of, the only thing having in common was that dot com. The major oversight that took place during the turn of the dot com era was that the success of these businesses wasn't in truth due to them ending in .com, but whether the idea, and execution behind the underlying business is strong or not. Like how Amazon and Facebook saw unparalleled success not just because they were .coms, but because they were pioneering business models that would attract global demand to the services they were providing. The business of AGI has a sort of homogenous property. All AGI companies produce a service that is extremely similar in nature, the only ways they can compete with one another is through Capital Expenditure towards harnessing more computing power. This is the main reason capital is concentrating in a handful of companies trading at high multiples. To me, this is not an indication of a tech bubble but rather a product of how the AGI industry is poised to grow within our economy.
AGI as a Factor of Production
To get even more philosophical, we can think about how AGI itself enhances economic growth. We already see AGI tools applied in various ways, but the most widespread application pertains to the enhancement of human capital. While it is possible to make AGI models complete ongoing tasks completely on their own with zero human input, its far more common to see AGI tools be used, well, as tools. What I mean is that firms are not looking to replace human workers with AI ones (certain exceptions may include the manufacturing industry), instead they want to integrate AGI tools into their workforce as a means of optimizing regular processes, allowing them to access and process information with tremendous efficiency. The most observable economic outcome of this is firms being able to cut costs in human capital requirements, allowing them to achieve the same level of workflow with a smaller number of employees, or outsourcing solutions to business processes by way of automation utilizing AGI. The possibilities are endless and the economic impact of AGI appears to write itself new economic theory to explain how business growth is accelerating in unprecedented ways.
Semiconductor Physical Limitations: Blessing or Burden?
In 1965, Gordon Moore articulated his observation which would come to be known as Moore's Law. He observed that the number of transistors in an integrated circuit doubles approximately every 2 years. Based not so much on law of physics, Moore's law describes an empirical relationship between time and the number of transistors per chip, suggesting that the rate of production advancements would allow for such doubling to occur on a biannual basis. And to Gordon's own surprise, he was right. Transistor count for a given chip roughly doubled every 2 years for the following 50 years. However, Gordon also predicted that Moore's Law would come to an end in 2025, where transistor sizes would reach the physical limit of 2 nanometers (10-15 silicon atoms in width). While it may appear as a bottleneck to the semiconductor and AI industry, not being able to fit anymore transistors on one chip, but in reality, this limitation pressures companies to pursue innovations such as semiconductor packaging, which is NVIDIA's bread and butter. This technique allows for the stacking and integrating of many different chips to perform together as one. This technology has already proven wildly successful and is the backbone to virtually all of NVIDIA's GPU products. Google has invented their own method to getting around the physical limitation of silicon chips, producing AI-specialized integrated circuits known as Tensor Processing Units (TPUs). Catering these innovative solutions to expanding the frontier of AGI is almost a given.
How to play this market: A Technical Approach
If you have made it this far, I commend you. The following describes my approach to analyzing price activity in SOXL:
My First entry into SOXL took place on 5/30 with a unit cost of 16.50 USD. Two things can be noted prior to this entry. 1: Fund flows during late February, into March, and through April were extremely high, net inflow of 6.85 Billion USD, however price movement did not reflect the huge inflow until late April/early May where we began to see upward price direction. The beginning of June marked the start of the market bull rally which consolidated into our current price range of 25-28 USD, following contingent earnings releases of NASDAQ:ASML , NYSE:TSM , NASDAQ:NXPI and NASDAQ:INTC . The most recent pullback was a combination of a slightly concerning outlook from ASML, stating that tariffs on the EU would negatively affect projected sales growth for the 2026 fiscal year. As for TSM, there is not one concerning thing that could be said regarding the state of its business growth other than the New Taiwan Dollar gaining considerable strength over the USD amid trade relations between the US and Taiwan, affecting TSM's gross margin by an estimated 6%. NXPI released a sub par earnings and revenue growth outlook, but in my opinion this is not to be too heavily objectified as NXPI produces chips primarily for the Automotive sector, thus making it's sales heavily contingent on supply chain issues being faced by automotive manufacturers in leu of tariffs. NXPI carries a 3.5% market share in semiconductors whereas TSM carries a 68% market share. Lastly, INTC, earnings release I am almost embarrassed to talk about. If it were up to me I'd say they sell their plants in Ohio to TSM and look into opening a fruit stand instead. The most important earnings releases have yet to come though. NASDAQ:MSFT is just around the corner on 7/30, and NASDAQ:NVDA announces on 8/27. These two earnings reports will carry major weight in hinting the overall direction, momentum the market sees in AI demand growth, and the technology sector as a whole. Speculating, I have high expectations that both MSFT and NVDA will top all estimates, pushing the bar higher for 2025 into 2026.
If we look at our short-term 50-day SMA/EMA, you will notice a crossover occur on 5/6, a minor indication of a short term positive trend. Alone this is insignificant, but if we look at our 14-day Average True Range, we can see that this crossover aligns with a fall in ATR that would persist between the values of 1.37 and 1.59. This low ATR value signals that trailing volatility is actually quite low for semiconductors, considering the currently mixed market sentiment. Further along we see that price has crossed above both our long-term, 200-day SMA/EMA and a crossover occurred between the two on 7/23, serving as a small indication of a positive long term trend. Once again, not super significant on its own, but you will notice that the convergence aligns perfectly with a sharp increase in fund inflows, netting 491 Million USD in a matter of 3 trading days. If we see a continuation of net inflows over the several days, we can expect a near future extension of our bull rally, a semi-cyclical wave of inflows that concentrate during consolidation periods (which we have seen take place in the current price range between 25-28 USD following my first exit at 27.50 USD). If we extrapolate both our short-term and long-term SMA/EMA, we can anticipate a crossover to occur in the coming days to weeks. If this occurred, that would further reinforce our expectation for a positive long term trend. I have already locked in my entry 2 with a limit order executed at 25 USD. If all of the above conditions are met, I would confidently predict that we may see SOXL trade at around 42 USD in the coming months.
One more thing I would like to note, if we zoom out to our 5 year historical price progression, we can identify the previous high of 70.08 USD occurring on 7/11/2024. We know that the bull rally which took place in July of last year can be attributed to the first realization of AI as a driver for semiconductor demand, combined with renewed interest in GPU technology for applications in crypto. If we compare AI-related Capital Expenditure in fiscal year 2024 to AI-related Capital Expenditure of the first half of 2025 fiscal year: 246 Billion USD made up AI-related CapEx for all of 2024, vs first 6 months of 2025, adding up to 320 Billion USD. That is a 30% increase in capex, and we still have another 5-6 months to go. Just some food for thought.
Do you believe all of the above has been priced into SOXL, leave your thoughts in the comments!
Disclaimer
You must obviously keep in mind, SOXL is a 3x leveraged ETF, you can expect volatility with such type of investment. However, in capturing a bullish market, a 3x leveraged investment may produce greater than 3x the returns as the underlying (non leveraged) assets, due to the effect of compounding growth of returns over time. However, the same is true for sideways, or bearish markets, losses may be amplified to greater than 3x. If this is an uncertainty you do not wish to be exposed to, I would opt for the non-leveraged Semiconductor ETF ( NASDAQ:SOXX ), or divide your allocation across the top 5-10 equity holdings of SOXL. Please remember to employ your OWN due diligence before making any investment decision, as none of what I am saying shall serve as financial advise to you, the reader.

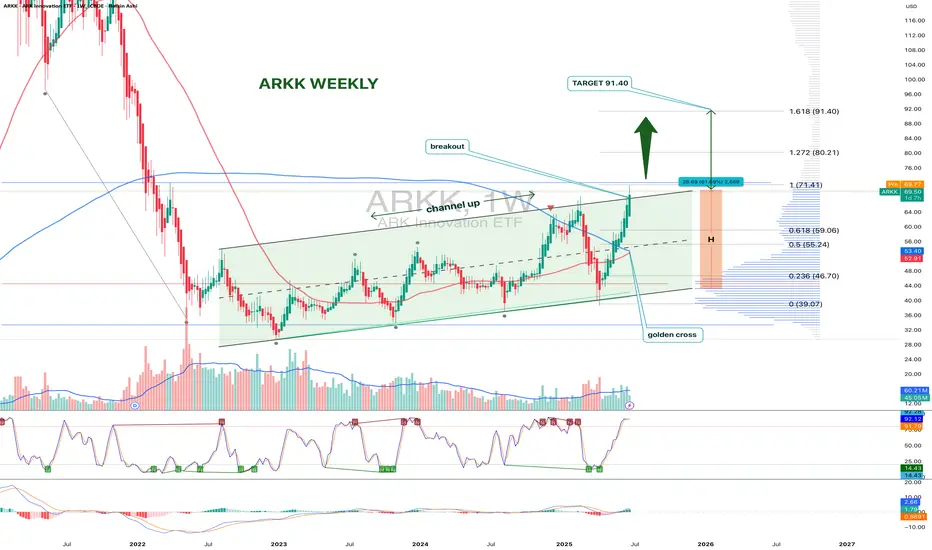
ARKK: when a breakout isn’t just a breakout-it’s a runway to $91On the weekly chart, ARKK has broken out of a long-standing ascending channel, ending a year-long consolidation phase. The breakout above $71.40, with a confident close and rising volume, signals a transition from accumulation to expansion. The move came right after a golden cross (MA50 crossing MA200), further confirming institutional interest. Price has already cleared the 0.5 and 0.618 Fibonacci retracements — and the 1.618 extension points to $91.40 as the next technical target.
Momentum indicators like MACD and stochastic remain bullish with room to run. Volume profile shows low supply above $75, which could fuel an acceleration toward the target zone.
Fundamentally, ARKK remains a high-beta, high-risk vehicle — but one with focus. The ETF is positioned around next-gen tech: AI, robotics, biotech, and automation. Assets under management now exceed $9.3B with +$1.1B net inflow in 2025. YTD return stands at 37%, and its top holdings (TSLA, NVDA, COIN) are back in favor. This isn’t just a bet on innovation — it’s diversified exposure to a full-blown tech rally.
Tactical setup:
— Entry: market $69.50 or on retest
— Target: $80.21 (1.272), $91.40 (1.618 Fibo)
Sometimes a breakout is just technical. But when there’s volume, a golden cross, and billions backing it — it’s a signal to buckle up.
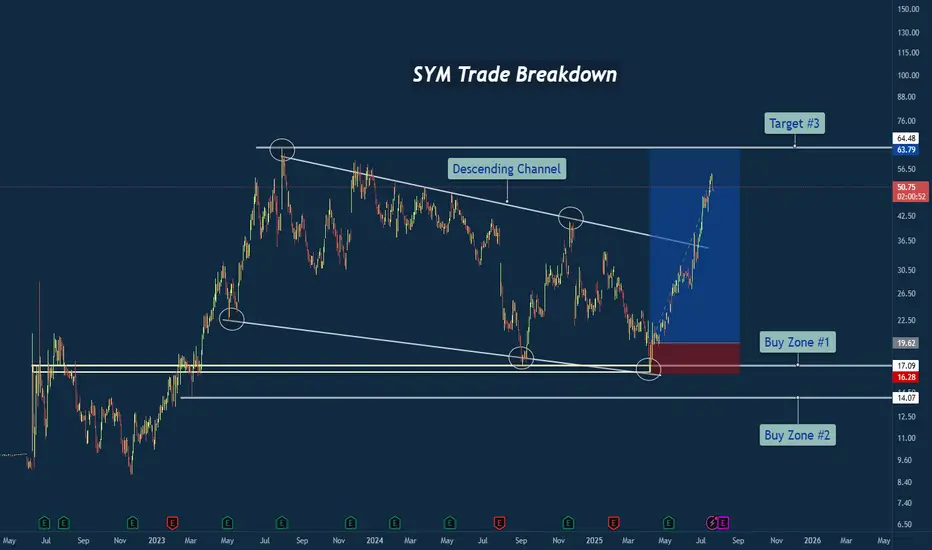
SYM Trade Breakdown – Robotics Meets Smart Technical's🧪 Company: Symbotic Inc. ( NASDAQ:SYM )
🗓️ Entry: April–May 2025
🧠 Trade Type: Swing / Breakout Reversal
🎯 Entry Zone: $16.28–$17.09
⛔ Stop Loss: Below $14.00
🎯 Target Zone: $50–$64+
📈 Status: Strong Rally in Motion
📊 Why This Trade Setup Stood Out
✅ Macro Falling Wedge Reversal
After nearly two years of compression inside a falling wedge, price finally tapped multi-year structural support and fired off with strength. This wasn’t just a bottom — it was a structural inflection point.
✅ Triple Tap at Demand Zone
Symbotic tapped the ~$17 area multiple times, signaling strong accumulation. Volume and momentum picked up with each successive test, showing institutional interest.
✅ Clean Break of Trendline
Price broke through the falling resistance trendline decisively, confirming the bullish reversal and unleashing stored energy from months of sideways structure.
🔍 Company Narrative Backdrop
Symbotic Inc. isn't just any tech stock. It’s at the forefront of automation and AI-powered supply chain solutions, with real-world robotics deployed in major retail warehouses. That kind of secular growth narrative adds rocket fuel to technical setups like this — especially during AI adoption surges.
Founded in 2020, Symbotic has quickly become a rising name in logistics and warehouse automation, serving the U.S. and Canadian markets. With robotics in demand and investors chasing future-ready tech, the price action aligned perfectly with the macro theme.
🧠 Lessons from the Trade
⚡ Compression = Expansion: Wedges like this build pressure. When they break, the moves are violent.
🧱 Structure Never Lies: The $17 zone was no accident — it was respected over and over.
🤖 Tech Narrative Boosts Confidence: Trading is easier when the fundamentals align with the technicals.
💬 What’s Next for SYM?
If price holds above the wedge and clears the $64 resistance, we could be looking at new all-time highs in the next cycle. Watching for consolidation and retests as opportunity zones.
#SYM #Symbotic #Robotics #Automation #AIStocks #BreakoutTrade #FallingWedge #SwingTrade #TechnicalAnalysis #TradingView #TradeRecap #SupplyChainTech
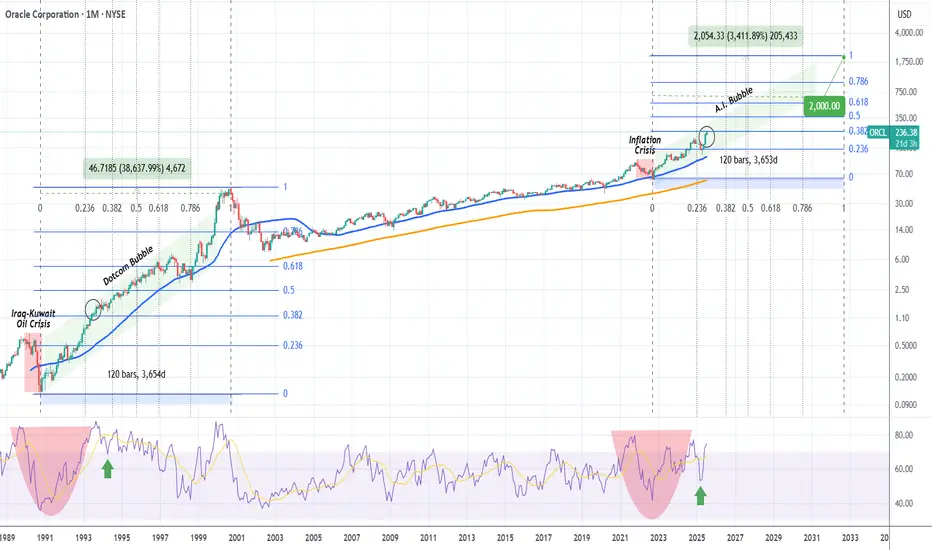
ORACLE Can you foresee it at $2000??Oracle (ORCL) is having perhaps the most dominant recovery from Trump's Tariff lows out of the high cap stocks, trading comfortable on new All Time Highs.
This is no surprise to us, as like we've mentioned countless times on our channel, we are currently at the start of the A.I. Bubble and heavy tech giants are expected to see massive gains until 2032, where we've calculated the end of this Bull Cycle and the start of a strong Bear.
As mentioned, this situation is extremely similar to the Dotcom Bubble of the 1990s. Of course Oracle is nearly impossible to repeat the +38637% gains of that Golden Decade after the 1990 Oil Crisis but in Fibonacci price and time terms, it can technically complete a +3411% rise and hit $2000 in the next 7 years.
If you have a long-term investor mindset like us, this is a must stock to buy and hold.
-------------------------------------------------------------------------------
** Please LIKE 👍, FOLLOW ✅, SHARE 🙌 and COMMENT ✍ if you enjoy this idea! Also share your ideas and charts in the comments section below! This is best way to keep it relevant, support us, keep the content here free and allow the idea to reach as many people as possible. **
-------------------------------------------------------------------------------
💸💸💸💸💸💸
👇 👇 👇 👇 👇 👇
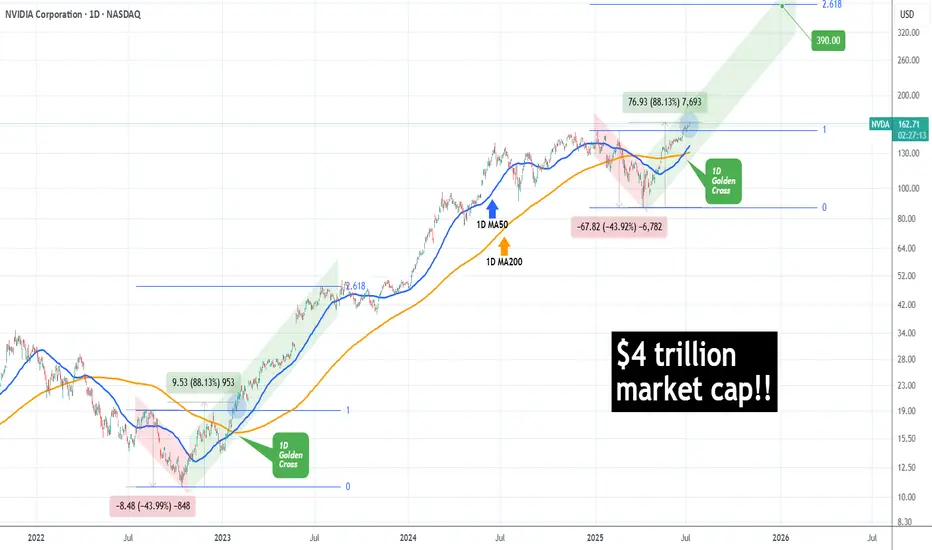
NVIDIA made history! First company with $4 trillion market cap!NVIDIA Corporation (NVDA) became today the first company in history to surpass a $4 trillion market value, as A.I. bulls extended the recent rally and pushed the price past the approximate $163.93 level needed to reach this market capitalization threshold.
The long-term trend on the 1D time-frame couldn't look more bullish. Coming off a 1D Golden Cross less than 2 weeks ago, the price has turned the 1D MA50 (blue trend-line) into Support and sits at +88.13% from the April 07 2025 Low.
This is the exact set-up that the market had when it was coming off the 2022 Inflation Crisis bottom (October 13 2022). As you can see, both fractals started with a -44% decline, bottomed and when they recovered by +88.13%, there were just past a 1D Golden Cross. In fact that Golden Cross (January 24 2023) was the last one before the current.
NVIDIA entered a Channel Up (green) on its recovery and for as long as the 1D MA50 was supporting, it peaked on the 2.618 Fibonacci extension before it pulled back below it.
If history repeats this pattern, we are looking at a potential peak around $390, which may indeed seem incredibly high at the moment, but as we pointed out on previous analyses, the market is in the early stages of the A.I. Bubble, similar to the Internet Bubble of the 1990s.
-------------------------------------------------------------------------------
** Please LIKE 👍, FOLLOW ✅, SHARE 🙌 and COMMENT ✍ if you enjoy this idea! Also share your ideas and charts in the comments section below! This is best way to keep it relevant, support us, keep the content here free and allow the idea to reach as many people as possible. **
-------------------------------------------------------------------------------
💸💸💸💸💸💸
👇 👇 👇 👇 👇 👇
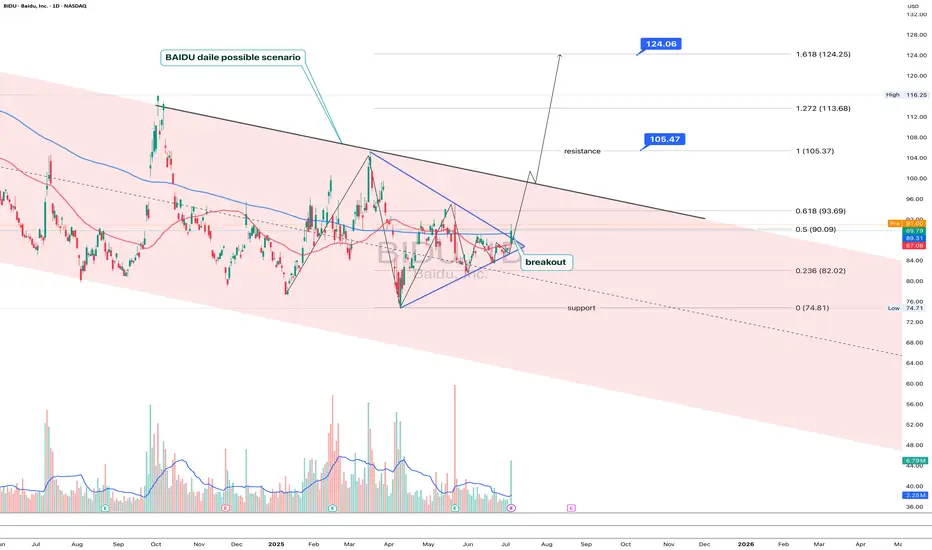
BIDU 1D: triangle breakoutBIDU 1D: triangle breakout + real-world AI deployment boosts bulls
Baidu (BIDU) breaks out of a triangle within a falling channel on the daily chart, with solid volume, reclaim of the 50MA, and approach to the 200MA. $90.09 flips into support. Targets stretch to $105.47 / $113.68 / $124.06 (Fibo levels).
Fundamentally, Car Inc just launched a robo-car rental service powered by Baidu’s Apollo unit. Fully autonomous, bookable for 4 hours to 7 days — this is not future tech, it’s live now. With a $32.6B market cap and low P/E (~12), BIDU looks positioned for revaluation if sentiment shifts.
Tactical setup: entry by market or retest of $90, stop below $82.
When the robot drives customers - you just drive the trade.
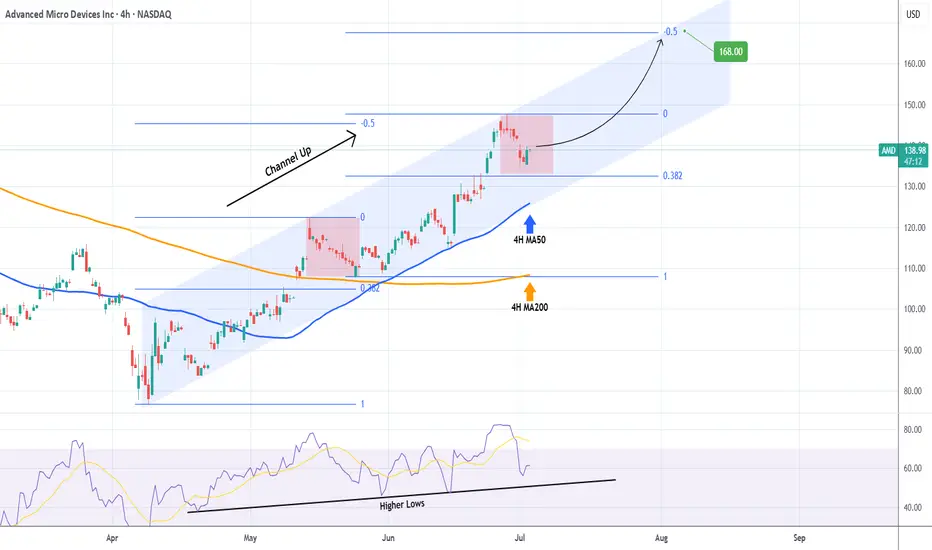
AMD Stable Channel Up targets $168.Advanced Micro Devices (AMD) has been trading within a Channel Up since the April 08 market bottom. With the 4H MA50 (blue trend-line) as its Support since April 30, the pattern has shown incredible consistency, with the past two pull-backs almost touching the 0.382 Fibonacci retracement level.
As a result, given also the fact that the 4H RSI is supported by the Higher Lows trend-line, we view the current bounce as a solid buy opportunity for the short-term. We are targeting $168, which is the -0.5 Fibonacci extension, the level that the previous Higher High reached.
-------------------------------------------------------------------------------
** Please LIKE 👍, FOLLOW ✅, SHARE 🙌 and COMMENT ✍ if you enjoy this idea! Also share your ideas and charts in the comments section below! This is best way to keep it relevant, support us, keep the content here free and allow the idea to reach as many people as possible. **
-------------------------------------------------------------------------------
💸💸💸💸💸💸
👇 👇 👇 👇 👇 👇
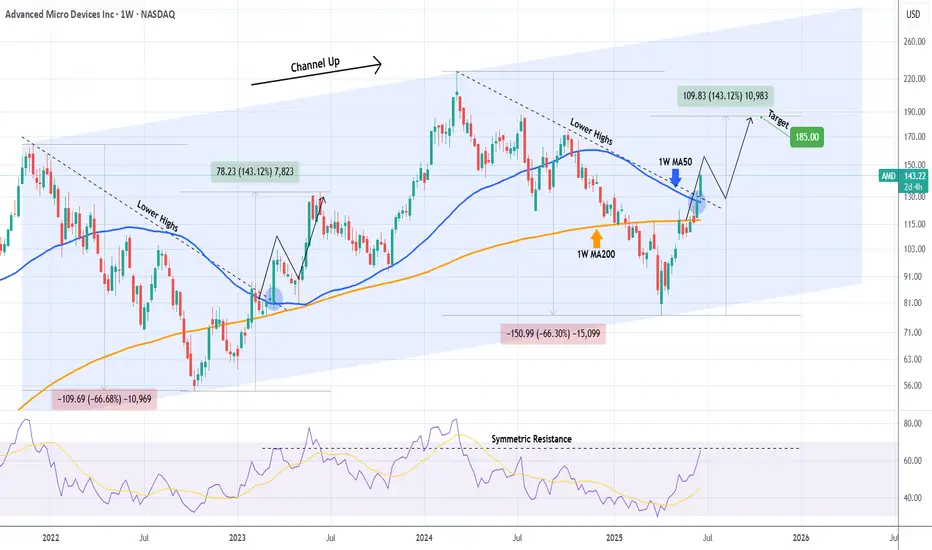
AMD Major Lower Highs/ 1W MA50 break-out.It was only 9 days ago (June 16, see chart below) when we called for a potential bullish break-out on Advanced Micro Devices (AMD) above the 1W MA50 (blue trend-line):
The break-out did happen, this 1W candle is already considerably above its 1W MA50 and based also on the level the 1W RSI is at right now, it may resemble more the March 13 2023 1W candle instead of the January 30 2023 as previously thought.
The reason is the major break-out of the All Time High (ATH) Lower Highs trend-line that came along with the 1W MA50. As you can see, it was on the March 13 2023 1W candle that AMD broke above that trend-line with the 1W RSI being on the same level (66.00) as today.
This candle formed a short-term Top, with the price initiating a 1.5 month pull-back that re-tested the 1W MA50 as Support and then moved on to complete the +143.12% Bullish Leg from the Channel Up bottom.
As a result, we can't rule out the first wave of short-term profit taking by next week. But a potential 1W MA50 test, will be another long-term buy entry in our view. Our $185.00 Target remains intact.
-------------------------------------------------------------------------------
** Please LIKE 👍, FOLLOW ✅, SHARE 🙌 and COMMENT ✍ if you enjoy this idea! Also share your ideas and charts in the comments section below! This is best way to keep it relevant, support us, keep the content here free and allow the idea to reach as many people as possible. **
-------------------------------------------------------------------------------
💸💸💸💸💸💸
👇 👇 👇 👇 👇 👇
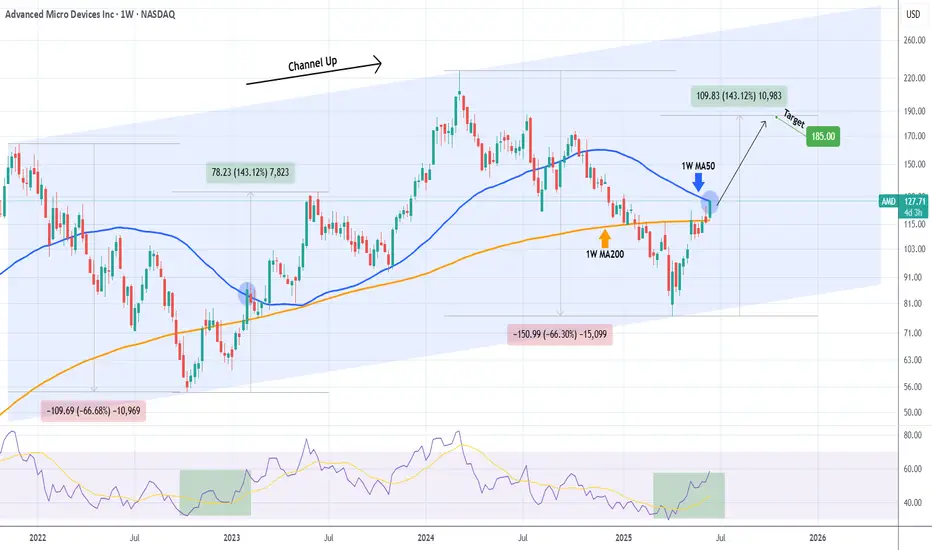
AMD First touch of 1W MA50 after 8 months!Advanced Micro Devices (AMD) hit today its 1W MA50 (blue trend-line) for the first time in almost 8 months (since October 28 2024). This is a crucial test as the las time this level broke as a Resistance following a Channel Up bottom rebound was on the week of January 30 2023.
When that happened, the Bullish Leg extended the upside to complete a +143.12% rise, before the next 1W MA50 pull-back.
As a result, if we close the week above the 1W MA50, we expect to see $185 before the end of the year.
-------------------------------------------------------------------------------
** Please LIKE 👍, FOLLOW ✅, SHARE 🙌 and COMMENT ✍ if you enjoy this idea! Also share your ideas and charts in the comments section below! This is best way to keep it relevant, support us, keep the content here free and allow the idea to reach as many people as possible. **
-------------------------------------------------------------------------------
💸💸💸💸💸💸
👇 👇 👇 👇 👇 👇
$SMCI "Buy The Dip" Value AreaSMCI (Super Micro Computer) has weathered the storm from all the negative press and I believe it is poised to go on a big run. This $26-$47 area is the BEST value you are going to get on it. This is probably the last discount before takeoff. We may not see this level again. As NVDA continues to fly, so will SMCI. Always do your own DD.

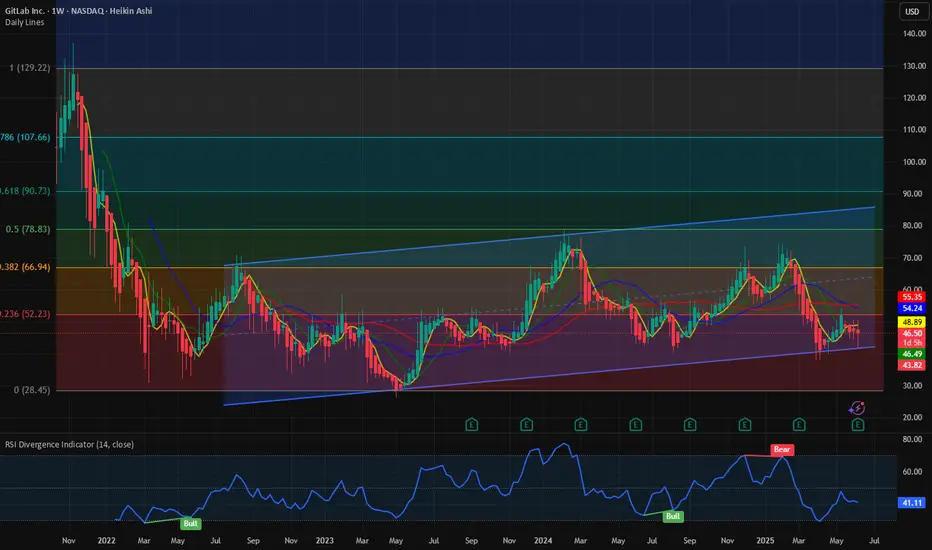
$GTLB: AI SaaS Software stock for tactical and long-term tradeIn this blog space we focus a lot on the AI trade. Be it semiconductors, AI powered Cybersecurity, AI Powered Fintech or just the industry itself, but we have not quietly focused on the AI Software stocks. The second and third derivatives of the AI trade will be more on the software space than Semiconductors where most of the future value will be accrued. Now within the AI Software space we have discussed NASDAQ:CRWD strike as one of our favorites, but can there be other names which can give us a lot of Alpha in the near and long term?
In my opinion NASDAQ:GTLB is one such stock. Gitlab provides software developers productivity tools to develop software faster, better and securely. Coming back to the technical below we can see that lately the stock is stuck within the upward sloping channel on the weekly chart since the bear market lows of 2023. If we plot the Fib retracement level from the all-time highs to the all-time lows, we can see that on the weekly chart it is stuck below the 0.236 Fib level with an oversold RSI. But the recent price action indicates that even if we touched the lower bound of the price we saw after April 4 Lib Day lows, we are still holding an RSI of 41 indicating seller exhaustion. So, the next levels in the chart are 52 $ then 67 $ and then 80 $ in the medium term, which is well within the parallel channel.
Verdict: NASDAQ:GTLB target prices are 52 $ then 67 $ and then 80 $. Can be held for long term returns.
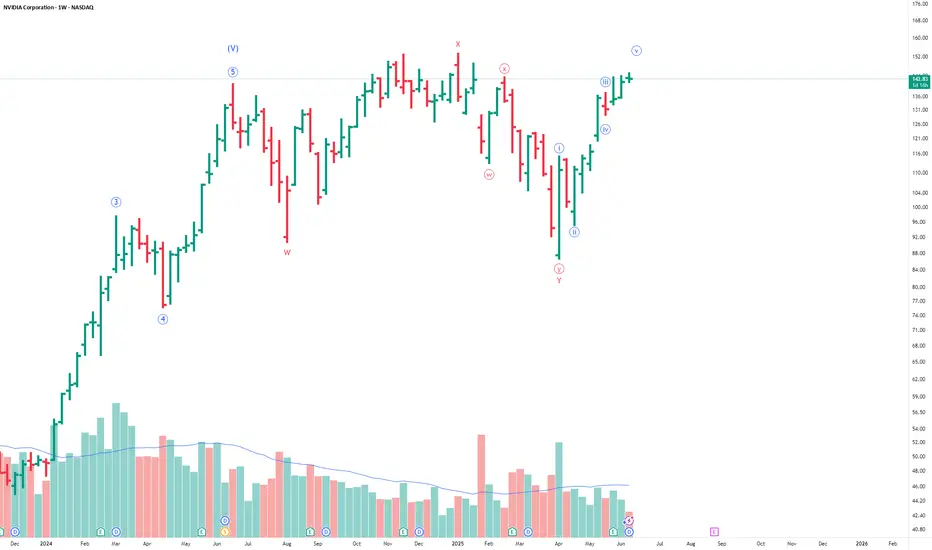
AI Chip Stocks NVDA and AMD Showing 5 Wave RiseNASDAQ:NVDA and NASDAQ:AMD are both showing 5 wave rise in weekly chart after a correction in WXY. I haven't checked but other AI related stocks also might be doing something similar.
Once the 5 waves are over, we can expect some correction but the 5-wave rise post a correction typically signals fresh uptrend so it might be worth keeping an eye on these stocks. Waiting till retracement/correction of this rise is complete.
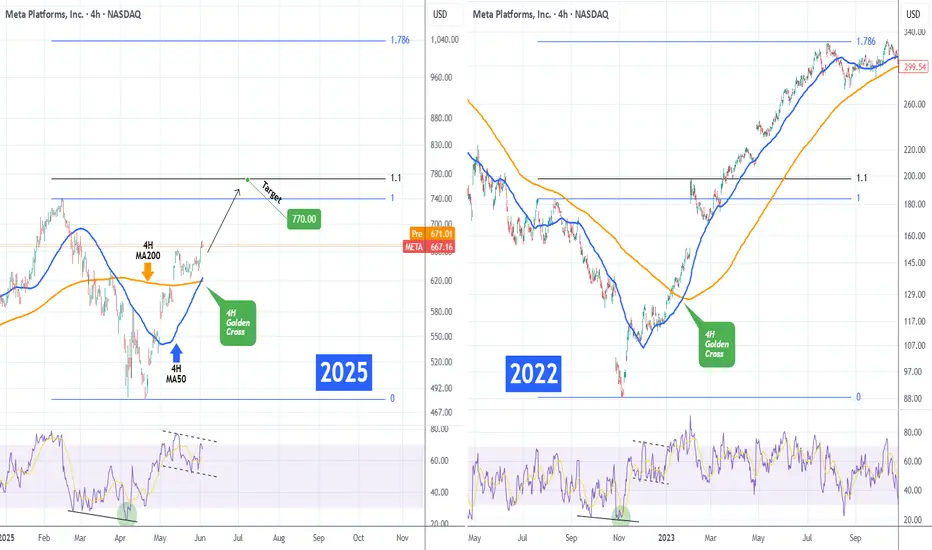
META Formed 1st 4H Golden Cross since Jan 2023!Meta Platforms (META) just completed yesterday its first 4H Golden in almost 2.5 years (since January 24 2023), flashing the strongest bullish signal it could at the moment!
Practically that Golden Cross was formed directly after the November 2022 bottom of the Inflation Crisis. The 4H RSI patterns between the two time periods are identical, so it is highly likely to see the market repeat that price action.
That suggests that the immediate Target on what seems to be an Inverse Head and Shoulders pattern is the 1.1 Fibonacci extension at $770.00, as META did on February 03 2023.
On the long-term and assuming a favorable macro environment (Trade Deals, Rate Cuts) it could reach the 1.786 Fibonacci extension a little over $1000, before the next major market correction.
-------------------------------------------------------------------------------
** Please LIKE 👍, FOLLOW ✅, SHARE 🙌 and COMMENT ✍ if you enjoy this idea! Also share your ideas and charts in the comments section below! This is best way to keep it relevant, support us, keep the content here free and allow the idea to reach as many people as possible. **
-------------------------------------------------------------------------------
💸💸💸💸💸💸
👇 👇 👇 👇 👇 👇
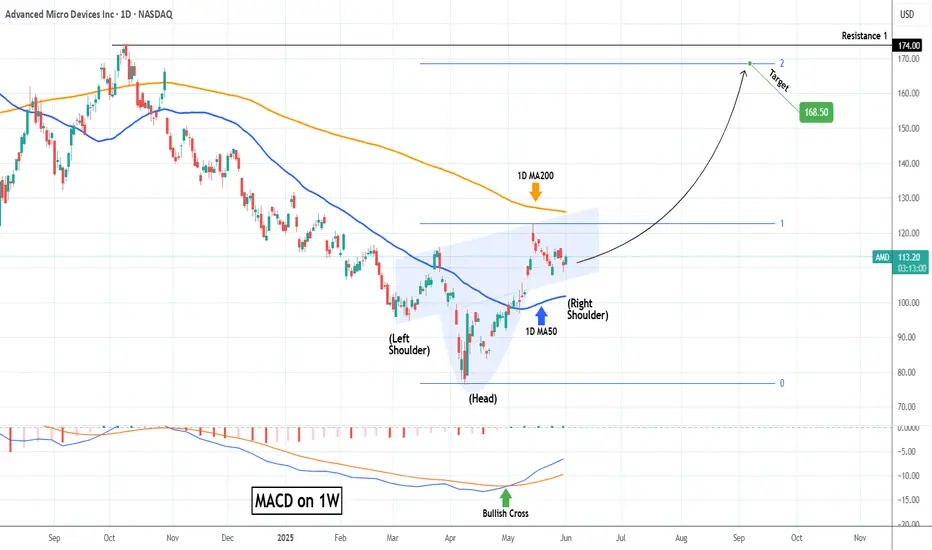
AMD Inverse Head and Shoulders waiting for massive break-out.Advanced Micro Devices (AMD) has entered a wide consolidation range within the 1D MA50 (blue trend-line) and 1D MA200 (orange trend-line) following the May 14 High. From a wider scale, this is technically seen as the Right Shoulder of an Inverse Head and Shoulders (IH&S) pattern.
This is generally a bullish reversal pattern and it is no coincidence that the Head was formed exactly on the market bottom (April 08). With the first long-term buy signal already given by the 1W MACD Bullish Cross, as long as the 1D MA50 holds, a break above the 1D MA200 would confirm the next rally phase.
Technically when the Right Shoulder break-outs take place, they target the pattern's 2.0 Fibonacci extension. That's now exactly at $168.50 and this is our medium-term Target.
-------------------------------------------------------------------------------
** Please LIKE 👍, FOLLOW ✅, SHARE 🙌 and COMMENT ✍ if you enjoy this idea! Also share your ideas and charts in the comments section below! This is best way to keep it relevant, support us, keep the content here free and allow the idea to reach as many people as possible. **
-------------------------------------------------------------------------------
💸💸💸💸💸💸
👇 👇 👇 👇 👇 👇
NVIDIA Massive Cup and Handle targets $200.NVIDIA Corporation (NVDA) is pulling back aggressively following yet another positive Earnings report, where they beat the estimates again but the market is reacting with selling. That has been a 'norm' in the past 12 months but even from a technical standpoint, the price reached the 143.60 Resistance level (made of the February 18 High), so profit taking is technically normal market behavior here.
On the longer term however, this Resistance test potentially forms the top f a very powerful pattern, the Cup and Handle (C&H). At the moment, the market has the support of both the 1D MA200 (orange trend-line) and 1D MA50 (blue trend-line) and the Handle, which has just started, has some room to safely consolidate for a while before the pattern break-out upwards.
Technically, C&H patterns reach their 2.0 Fibonacci extensions after the break-out, so our medium-term Target is set at $200.
Notice also the Bearish Divergence on the 1D RSI, which is similar to that of late October 2024. A break below the 1D MA50 risks the bullish structure on this pattern.
-------------------------------------------------------------------------------
** Please LIKE 👍, FOLLOW ✅, SHARE 🙌 and COMMENT ✍ if you enjoy this idea! Also share your ideas and charts in the comments section below! This is best way to keep it relevant, support us, keep the content here free and allow the idea to reach as many people as possible. **
-------------------------------------------------------------------------------
💸💸💸💸💸💸
👇 👇 👇 👇 👇 👇

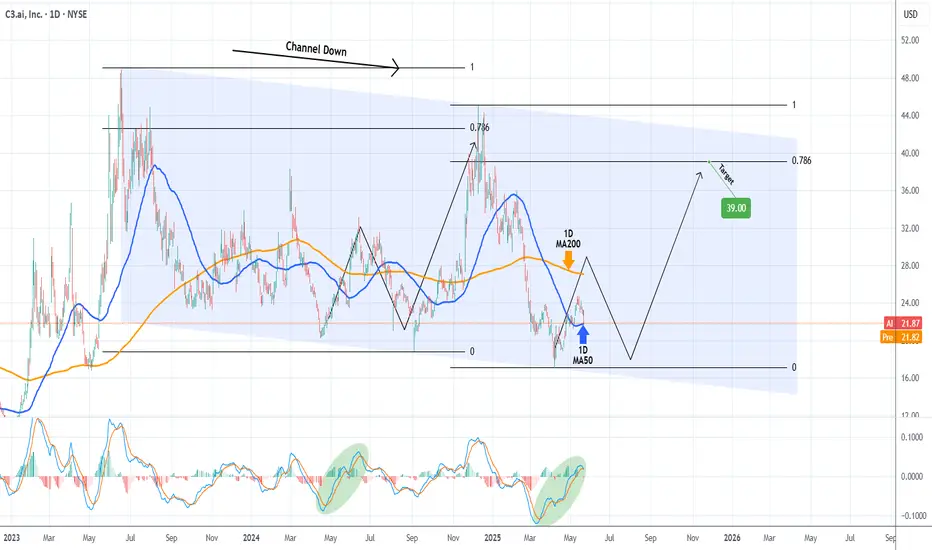
C3.AI has bottomed and is targeting $39.00C3.ai (AI) has been trading within a Channel Down pattern since the June 16 2023 High and right now is testing its 1D MA50 (blue trend-line) as Support, following a bottom (Lower Lows) rebound on April 08 2025.
This is technically the start of its new Bullish Leg, even though based on May - August 2024, it may be delayed. On the long-term though, our Target will be the 0.786 Fibonacci retracement level at $39.00.
-------------------------------------------------------------------------------
** Please LIKE 👍, FOLLOW ✅, SHARE 🙌 and COMMENT ✍ if you enjoy this idea! Also share your ideas and charts in the comments section below! This is best way to keep it relevant, support us, keep the content here free and allow the idea to reach as many people as possible. **
-------------------------------------------------------------------------------
💸💸💸💸💸💸
👇 👇 👇 👇 👇 👇
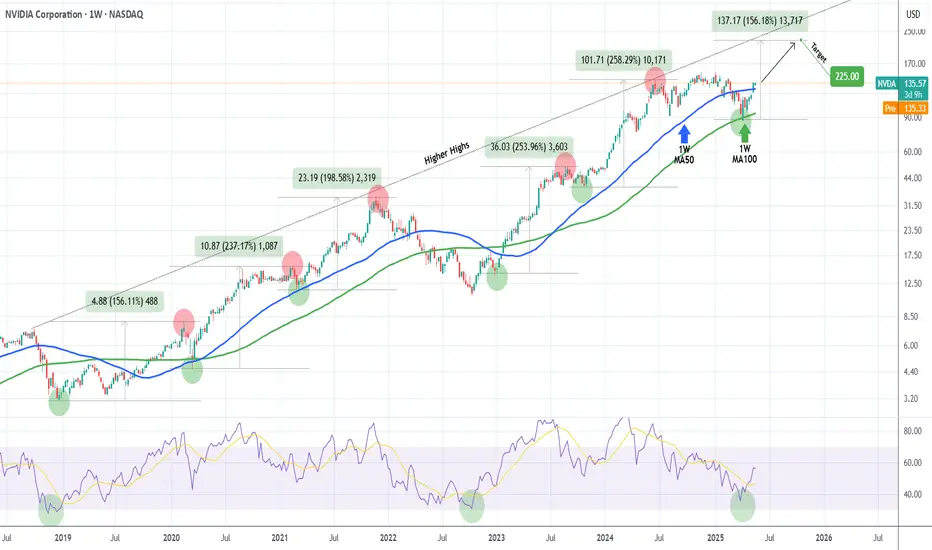
NVIDIA The 1W MA100 rebound is targeting $225 at least.NVIDIA Corporation (NVDA) broke last week above its 1W MA50 (blue trend-line) for the first time in 2.5 months and all this is generated by April's bottom rebound on the 1W MA100 (green trend-line).
The 1W MA100 has been intact since January 23 2023, so this rebound technically initiates a new Bullish Leg. Since the December 2018 bottom (previous U.S. - China Trade War), the minimum rise on such a Bullish Leg has been +156.11%. As a result, NVIDIA can now target $225 at least before the end of 2025.
-------------------------------------------------------------------------------
** Please LIKE 👍, FOLLOW ✅, SHARE 🙌 and COMMENT ✍ if you enjoy this idea! Also share your ideas and charts in the comments section below! This is best way to keep it relevant, support us, keep the content here free and allow the idea to reach as many people as possible. **
-------------------------------------------------------------------------------
💸💸💸💸💸💸
👇 👇 👇 👇 👇 👇
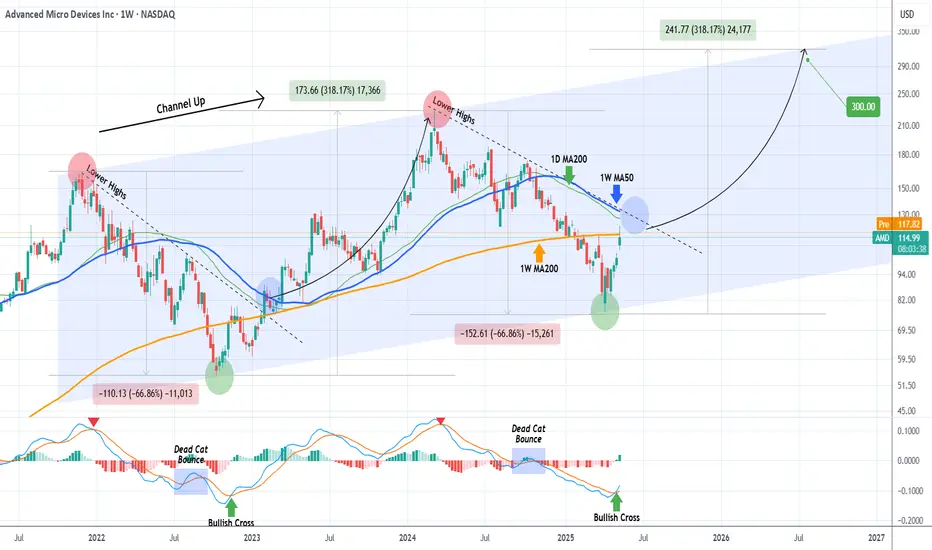
AMD Break-out above this level means new ATH at $300.Advanced Micro Devices (AMD) is on a recovery attempt following the April 07 2025 bottom, which is technically a Higher Low on the 3.5-year Channel Up. This week it broke above the first Resistance level of this attempt, the 1W MA200 (orange trend-line), which is key as it had 2 rejections since February 18 2025.
However the biggest Resistance test is right above it and consists of a strong Cluster of the 1D MA200 (green trend-line), the 1W MA50 (blue trend-line) and the Lower Highs trend-line from the All Time High (ATH).
The previous Bullish Leg of the Channel Up (started on October 10 2022), consolidated for 1 month once it broke above this Resistance Cluster (blue circle) and then marched towards the pattern's Higher High, which was naturally a Higher High.
The similarities between the Legs are striking, the Bearish Legs (both declined by -66.86%) were confirmed by 1W MACD Bearish Cross and the Bullish Legs by a Bullish Cross, which the 1W MACD just completed last week.
This is a major confirmation and technically the earliest for a long-term Buy. Assuming again that the symmetry will continue to hold on this emerging Bullish Leg, we can expect it rise by +318.17% as well. Based on that, our long-term Target on AMD is $300.
-------------------------------------------------------------------------------
** Please LIKE 👍, FOLLOW ✅, SHARE 🙌 and COMMENT ✍ if you enjoy this idea! Also share your ideas and charts in the comments section below! This is best way to keep it relevant, support us, keep the content here free and allow the idea to reach as many people as possible. **
-------------------------------------------------------------------------------
💸💸💸💸💸💸
👇 👇 👇 👇 👇 👇
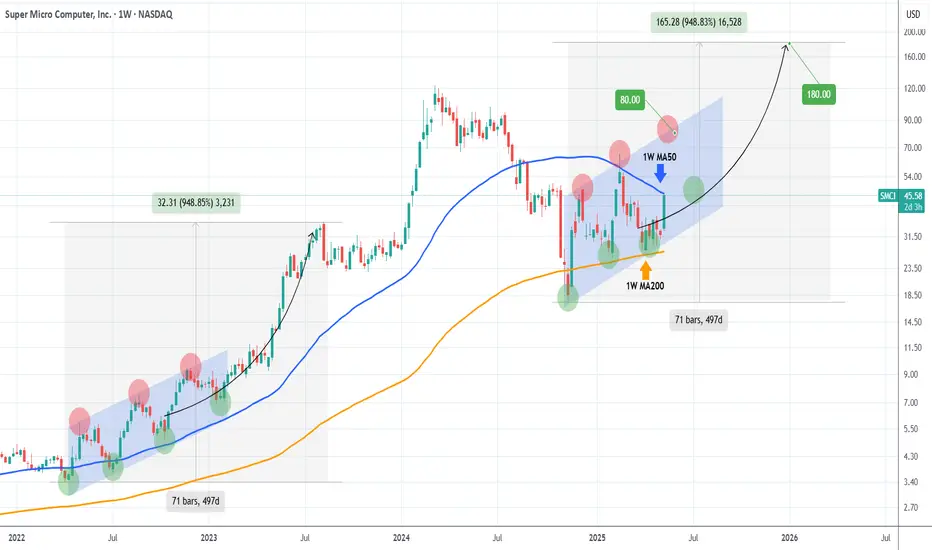
SMCI hit its 1W MA50, eyes a massive break-out.Super Micro Computer Inc (SMCI) has surged more than +15% today after the company announced a multi-year, $20 billion partnership with Saudi data center firm DataVolt.
Technically that brought it on its 1W MA50 (blue trend-line), the first contact with it since the week of February 18 2025, which was the previous Top. The current rally as well as the one that led to the Feb 18 Top, is fueled by the 1W MA200 (orange trend-line) which held as Support on both occasions.
The driving pattern behind those Bullish Legs is a Channel Up (blue) and this is not the first time SMCI comes across such formation. It was in fact a similar Channel Up that took the stock from the 2022 bottom of the Inflation Crisis and guided it to its new Bull Cycle. That rose by +950% before it pulled back on its first consolidation.
As a result, we have a short-term Target at $80.00 and after a pull-back, long-term Target at $180.00 (+950% from the bottom).
-------------------------------------------------------------------------------
** Please LIKE 👍, FOLLOW ✅, SHARE 🙌 and COMMENT ✍ if you enjoy this idea! Also share your ideas and charts in the comments section below! This is best way to keep it relevant, support us, keep the content here free and allow the idea to reach as many people as possible. **
-------------------------------------------------------------------------------
💸💸💸💸💸💸
👇 👇 👇 👇 👇 👇
Big CUP & Handle .. 100+ for this AI stock
The chart displays a cup-and-handle pattern, a powerful bullish continuation setup. The "cup" formed from $3 to $11.07, followed by a "handle" consolidation near the $11.07 resistance (key level). The stock is poised for a breakout above this level, with the measured move of the pattern projecting a target of $125. This target is calculated by adding the cup's depth ($8, from $3 to $11) to the breakout point ($11.07), scaled on a logarithmic chart, suggesting a potential move to $125 if the breakout is confirmed with strong volume. The curved trendline (blue) provides robust support, reinforcing the bullish trend, while the breakout above the handle’s descending trendline signals momentum.
Fundamental Catalysts:
SoundHound AI is a leader in the conversational AI market, expected to grow to $49.9B by 2030 (CAGR 30.2%). Strategic acquisitions (Amelia, SYNQ3, Allset) have expanded its reach in restaurant and enterprise AI, adding clients like Chipotle and White Castle. Partnerships with Tencent, Stellantis, and Hyundai integrate its voice AI into global automotive markets, while a $1.2B revenue backlog ensures long-term growth. Q4 2024 revenue soared 101% to $34.5M, with 2025 projected at $157–$177M (97% growth). With 270+ patents, a $246M cash reserve (no debt), and a path to positive EBITDA by late 2025, SoundHound is primed for significant market share gains.
