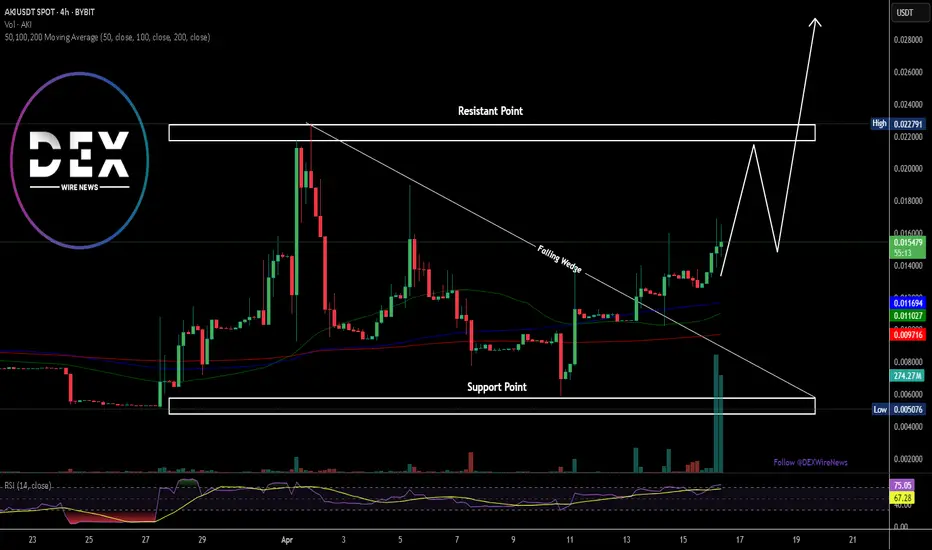
Aki Network ($AKI) Breaks Out of A Falling Wedge Surging 20%Aki Network ( NSE:AKI ) broke out of a falling wedge pattern delivering 20% gains to traders and investors. The asset has being in a falling wedge for the past 7 days before delivering this massive gains.
While currently up 14.5% for the past 4 hours, NSE:AKI is gearing up for another legged up should it break above the resistant point as the altcoin's chart pattern is depicting a three white crow candle stick pattern- a pattern typically seen as a continuation of a current trend pattern.
With the RSI at 75, we might experience a respite before the continuation move as the general crypto market is consolidating. Similarly, with listings on top exchanges, NSE:AKI could deliver a massive gain if the hype on multichain tokens emerge.
What is Aki Network?
Aki Network emerges as a pioneering project within the web3 domain, aiming to restructure the way information is organized and accessed. At its core, the network introduces a dual-layered approach: the Aki Protocol and the Aki Network application suite.
Aki Network Price Live Data
The Aki Network price today is $0.015637 USD with a 24-hour trading volume of $15,320,266 USD. Aki Network is up 21.87% in the last 24 hours, with a market cap of $31,274,389 USD. It has a circulating supply of 2,000,000,000 AKI coins and a max. supply of 2,000,000,000 AKI coins.
Aki
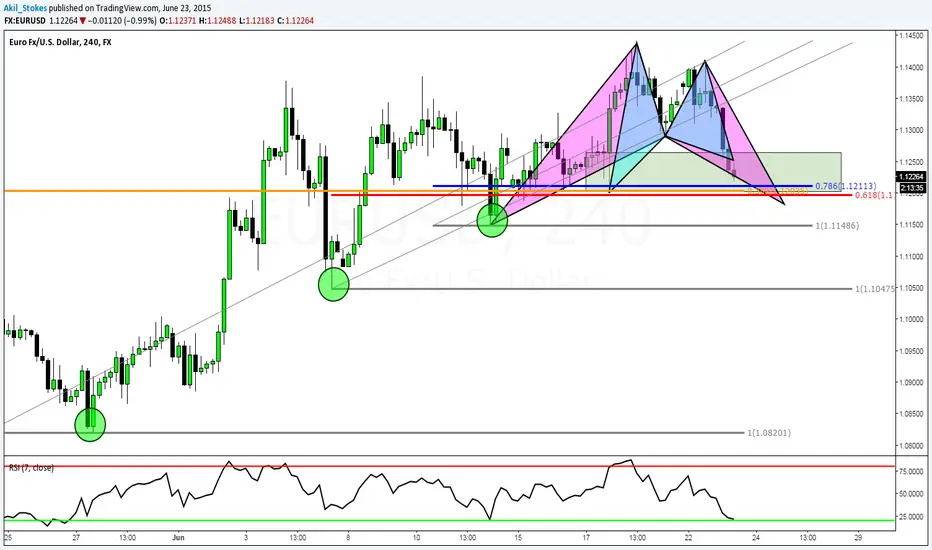
EURUSD: A Look Ahead (Day 2) "I Got Long This Morning"Surprisingly the bulk of the movement on EURUSD yesterday seemed to come in the…Asia session (whaaat?) Anyway, we are now down in a zone where I thought we may see a potential reversal. Personally I got long on the smaller Gartley pattern this morning (from 1.1231) but keep in mind we also have a bigger bat pattern lurking down at 1.1182.
I got the question yesterday asking “Akil which one will be more accurate to take?” Honestly, I don’t know. If I did, I’d bet the house on it but seriously, we never know what the market is going to do and if someone is telling you otherwise, then they’re lying to you and probably trying to sell you something. With that being said this situation is interesting because for some, the gartley pattern stops will be below the bat pattern completion which means that you’ll either have to choose one over the other, or split the position and take both trades.
I like the saying “a bird in the hand is better than two in the bush.” Meaning a completed pattern is always valued over a potential pattern assuming there aren’t any risk issues. I also like the protection that the 1.1200 level offers in the form of a psychological number and Fibonacci ratio cluster. Currently I’m looking for a push up to the 1.13 even handle to take profit, but that may change depending on how far this “D” leg falls.
Until we get out of this consolidation, I don’t really have any long-term outlooks on this pair, so I’ll continue to look for intraday opportunities until a true direction is determined. Other pairs on my radar today are the USDJPY (already long), EURAUD (again), EURJPY and AUDUSD
Akil Stokes
Chief Currency Analyst at www.TradeEmpowered.com
My Trading Videos: www.youtube.com
My Latest Blog Post "Watch Your Position Sizing" tradeempowered.com