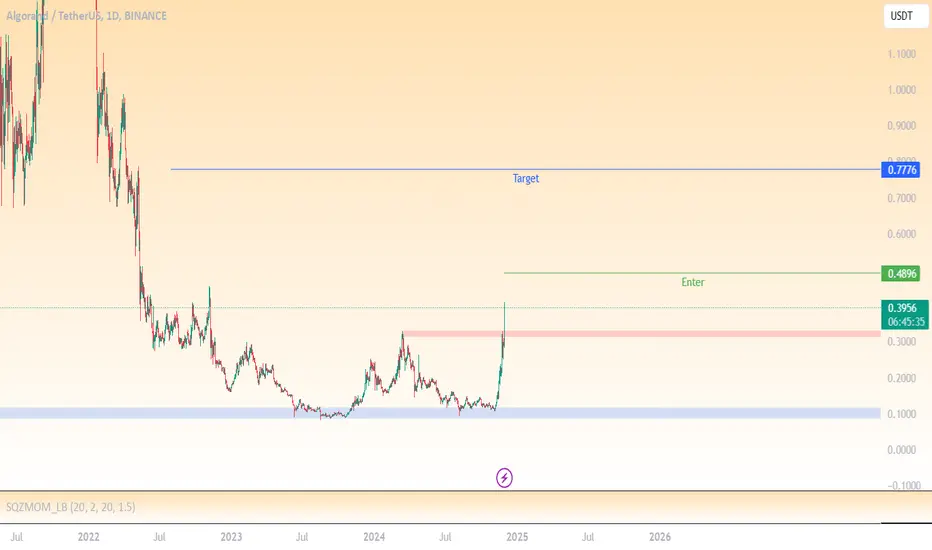
Algorand Nears $0.45 Resistance: Breakout Targets $0.70 Algorand (ALGO) is experiencing a significant upward trend, with a 25% surge in its price over the past 24 hours. However, resistance levels around $0.45 and beyond may need to be breached for ALGO to maintain its bullish trajectory
Waiting to test the key resistance at $0.45, a breakout above this level could confirm entry opportunities. Targeting the resistance zone around $0.70.
Algotrading
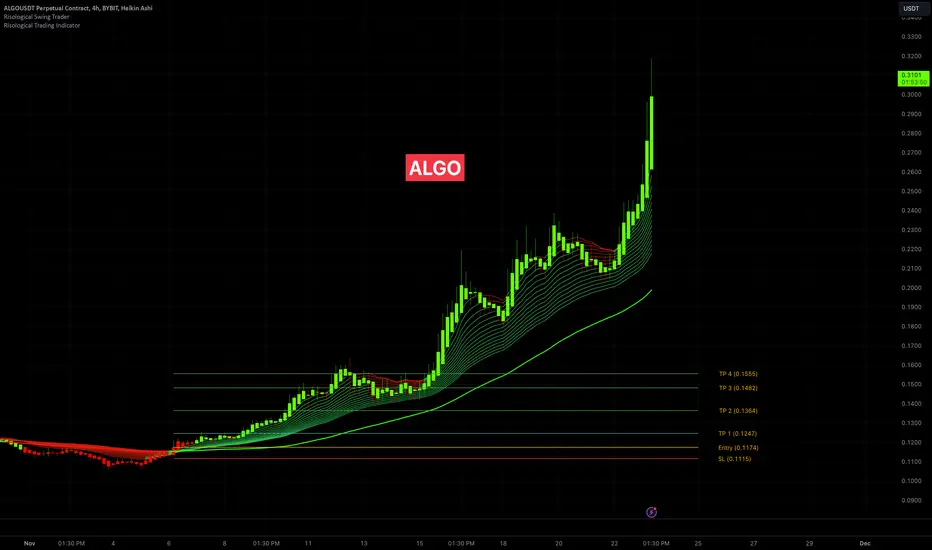
Algorand (ALGO) Surges 1650% at 10x Leverage!Algorand (ALGO) Trade Overview:
Algorand (ALGOUSDT) delivers an explosive performance, achieving a phenomenal 1650% gain at 10x leverage using the Risological Trading Indicators . The 4-hour timeframe captured this breathtaking rally as ALGO hit all targets and surpassed expectations.
Key Levels:
TP1: 0.1247 ✅
TP2: 0.1364 ✅
TP3: 0.1482 ✅
TP4: 0.1555 ✅
Technical Analysis:
The trade was initiated as ALGO broke past the Risological Green Lines, confirming a strong bullish momentum. The gradual upward curve of these lines provided early indications of sustained buying pressure. The price surged consistently, clearing all the predefined targets with ease.
This move reflects a textbook breakout scenario, powered by volume spikes and an aligned bullish sentiment in the market. Traders leveraging Risological tools were well-positioned to capture this remarkable upside, securing massive profits.
Hey Trading Fam! ALGO at a Pivotal Moment – What’s Next?Hey trading family, let’s break this one down. Algorand (ALGO) looks ready for a potential move up to $0.26. From there, we could see a correction, but how deep could it go? Here’s what we’re watching:
Scenario 1: A correction could take us back down to levels like $0.21 or even as low as $0.15 – stay sharp!
Scenario 2: If $0.26 doesn’t hold as resistance, we could break higher and run all the way up to $0.42.
This setup is worth watching closely. What’s your move here? Let’s trade smart and adapt to what the market gives us.
Like, comment, and share your thoughts below to keep the conversation going! Got questions or your own analysis? Send me a DM – let’s connect.
Mindbloome Trading // Kris
Trade What You See.

#ALGO/USDT#ALGO
The price is moving in a descending channel on the 4-hour frame and is sticking to it well
We have a bounce from the lower limit of the descending channel and we are now touching this support at a price of 0.1186
We have an upward trend on the RSI indicator that is about to be broken, which supports the rise
We have a trend to stabilize above the moving average 100
Entry price 0.1280
First target 0.1333
Second target 0.1370
Third target 0.1416

Metis, Algo targets set for $911, 18x0.768 fib is a deep retrace but that was common in the 2017 cycle so i don't think its a big deal. looks like a 1-2 1-2 Elliott wave so could extend well beyond these algo targets. taking profits at the algo target is a safer play but might be worth keeping a moon bag.
See linked BTC chart for why my charts are so bull.
The Trade:
Preferred Entry: $28.86 or a 0.168 retrace of this impulse wave (if we get one)
Ape Entry: $47.30
Stop: $32.71
Resistance: $106 - order block already tested once
Target 1: $277
Target 2: $955
D.Y.O.R. DO NOT BLINDLY TAKE THESE TRADES.
Never Trust. Verify. PLEASE DO YOUR OWN ANALYSIS.
This is not financial advice. These are just my observations.
Technical Analysis is not about being right, it's about increasing your odds.
Be prepared to be wrong. Risk management is key. Capital preservation above all else.

ALGOUSDT Surges by 82.83%The cryptocurrency ALGOUSDT has experienced a powerful rally, rising by an impressive 82.83% and achieving a price of $0.21900. This significant growth marks the successful attainment of the second target, reinforcing its bullish momentum. Despite reaching this milestone, ALGOUSDT shows no signs of slowing down, with the uptrend still intact. The trade remains
open, as further potential for upward movement is anticipated. This remarkable performance highlights the strength and optimism in the market for ALGOUSDT. Traders are encouraged to monitor this dynamic asset closely.

Algorithmic vs. Quantitative Trading: Which Path Should You TakeI’ve always wondered why anyone would stick to traditional trading methods when algorithms and mathematical models could do all the heavy lifting.
I started questioning everything:
• Why do so many mentors still swear by discretionary trading when algorithms could handle all the heavy lifting?
• Do they really have solid proof of their “own” success, or is it just talk?
• Or are they keeping things complex and discretionary on purpose, to confuse people and keep them as members longer?
• Why deal with the stress of emotions and decisions when an algorithm can take care of it all?
• Imagine how much further ahead you could be if you stopped wasting time on manual trades and instead focused on market research and developing your own models.
When I first got into trading, I thought Algorithmic Trading and Quantitative Trading were basically the same thing. But as I dug deeper, I realized they’re two completely different worlds.
Algorithmic Trading: It’s simple – you set the rules and the algorithm executes the trades. No more sitting in front of the screen “controlling your emotions” and trying to manage every little detail. Instead, you let the algorithm handle it, based on the rules you’ve set. It frees up your time to focus on other things rather than staring at price charts all day.
But here’s the thing – it’s not perfect. You’ll still need to test the rules to make sure the data and results you’re getting aren’t overfitted or just random.
Quantitative Trading: A whole different level. It’s not just about executing trades; it’s about understanding the data and math behind market movements. You analyze historical price, economic, and political data, using math and machine learning to predict the future. But it can be complex – techniques like Deep Learning can turn it into a serious challenge.
The upside? This is the most reliable way to trade, and it’s exactly what over 80% of hedge funds do. They rely on quant models to minimize risk and to outperform the market.
So, which path should you choose?
Quantitative Trading can feel overwhelming at first, I recommend starting with the basics. Begin with Pine Script coding in TradingView—start building a foundation with simple strategies and indicators. As you grow more confident, start coding your own ideas into rules and refining your approach to eventually automated your trading strategy.
TradingView is a great tool for this, and I’d highly suggest grabbing the Premium plan. This will give you access to more data and features to make your learning journey smoother.
Dive into the Pine Script documentation , and begin bringing your ideas to life.
I promise, the more you focus on this, the better and more independent you’ll become in trading.
Every day, aim to get just 1% better.
To Your success,
Moein
Options: Why the Odds Are Stacked Against YouThe Hidden Challenges of Options Trading:
Options trading may seem like an exciting way to profit from market movements, but beneath the surface lies a trading environment that is heavily biased against individual traders. Many retail investors jump into options trading unaware of the many disadvantages they face, making it more of a gamble than a calculated investment. In this post, we’ll explore the major challenges that make options trading so difficult for individual traders and why you need more than luck to succeed.
1. The Odds Are Biased: Complex Algorithms Unlevel the Playing Field
The first thing to understand is that the playing field is not even. Professional traders and market makers use complex algorithms that evaluate a wide range of factors—volatility, market conditions, historical data, time decay, news and more—before they even think about entering a trade. These systems are designed to assess risks, manage exposure, and execute trades with a precision that most individual traders simply can’t match.
For an individual trader, manually analyzing these factors or using basic tools available online is nearly impossible. By the time you’ve analyzed one factor, the market may have already shifted. The reality is that unless you have access to these advanced algorithmic systems, you're trading with a massive handicap.
2. Market Makers Hold the Upper Hand: Your Trades Are Their Game
Market makers play a critical role in options trading by providing liquidity. However, they also hold an unbeatable advantage. They see both sides of the trade, control the bid-ask spreads, and use their position to ensure they’re on the winning side more often than not. For them, it’s not about making speculative bets; it’s about managing risk and profiting from the flow of orders they receive.
When you trade options, you're often trading against these market makers, and their strategies are designed to maximize their advantage while minimizing their risk. This means your trades are, in essence, a bad gamble from the start. The house always wins, and in this case, the house is the market maker.
3. They Will Fool You Every Time: Bid-Ask Spreads and the Math You Don’t See
One of the most overlooked challenges in options trading is understanding the bid-ask spread. This spread represents the difference between the price you can buy an option (ask) and the price you can sell it (bid). While this may seem straightforward, it’s an area where professionals easily outsmart retail traders.
Advanced traders and market makers use complex mathematical models to manage and manipulate these spreads to their advantage. If you don’t have the mathematical skills to properly evaluate whether the spread is fair or skewed, you’re setting yourself up to overpay for options, leading to unnecessary losses.
4. Information and Tools: A Professional-Only Advantage
Another critical challenge is the vast difference in information and tools available to retail traders versus professionals. Institutional traders have access to data streams, proprietary tools, and execution platforms that the average trader can only dream of. They can monitor market sentiment, analyze volatility in real-time, and execute trades at lightning speed, often milliseconds faster than any retail investor.
These tools give professionals an enormous edge in identifying trends, hedging positions, and managing risk. Without them, individual traders are flying blind, trying to compete in an arena where the best information is reserved for the pros.
5. Volatility and Time Decay: The Ultimate Account Killers
Two of the most critical factors in options trading are volatility and time decay (known as theta). These are the silent killers of options accounts, and pros use them to their advantage.
Volatility: When volatility increases, option prices go up, which might sound great. However, volatility is unpredictable, and when it swings in the wrong direction, it can destroy your position’s value almost overnight. Professionals have sophisticated strategies to manage and hedge against volatility; most individual traders don’t.
Time Decay: Time is constantly working against you in options trading. Every day that passes, the value of an option slowly erodes, and as expiration approaches, this decay accelerates. For most retail traders, this is a ticking time bomb. Pros, on the other hand, know how to structure trades to profit from time decay, leaving amateurs at a disadvantage.
Conclusion: Trading Options Is No Easy Game
The challenges of options trading are real and significant. Between the advanced algorithms, the market makers’ advantages, the mathematical complexities of bid-ask spreads, and the tools and information reserved for professionals, the odds are stacked against you. Add to that the constant threat of volatility and time decay, and it’s clear that options trading is a difficult and often losing game for individual traders.
If you’re thinking about jumping into options trading, it’s crucial to understand the risks involved and recognize that the deck is stacked. To succeed, you need more than just a basic understanding—you need tools, strategy, and a deep awareness of how the pros operate. Without that, you're gambling, not trading.

ALGOUSDT 1H - TRIANGULAR ZoneALGOUSDT 1H - TRIANGULAR Zone
If you like my AT, and you agree with the approaches, please FOLLOW ME and press BOOST so we can share it with more people. We are working on an automated Trading tool so that everyone can apply their strategies VISUALLY and PROFESSIONALLY, as we present in the analysis.
Thank you!
____________________________________________________________________
ALGOUSDT 1H - TRIANGULAR Zone
ALGORAND is in a price consolidation zone.
LEVELS:
SL: 0.14
Resistance 0.14
TP: 0.16
In the range 0.11 - 0.16 we can do SWING TRADING as long as it does not lose the SL. At the moment we are close to the BUY ZONE.
Above 0.16 we can set other objectives.
_____________________________________________________________________
Crypto Trading Automated Bots:
All these strategic alternatives can be configured with TradeX BoT, as it will allow you to position in both directions without having to block any amount per position. It will only be necessary for the conditions to be met, either downwards or upwards, for the orders to be executed in one direction or the other, taking the necessary deposits from your portfolio.
TradeX BoT (in development): Tool to automate trading strategies designed in TradingView. It works with both indicators and technical drawing tools: parallel channels, trend lines, supports, resistances... It allows you to easily establish SL (%), TP (%), SL Trailing... multiple strategies in different values, simultaneous BUY-SELL orders, conditional orders.
This tool is in the development process and the BETA will soon be ready for testing.
FOLLOW ME and I will keep you informed of the progress we make.
I share with you my technical analysis assessments on certain stocks that I follow as part of the strategies I design for my portfolio, but I do not recommend anyone to operate based on these indicators. Get informed, educate yourself and build your own strategies when it comes to investing. I only hope that my comments help you on your own path :)

AlgoTrading Basics for Beginners and Advanced StrategiesHello,
1 Introduction
Algotrading or Algorithmic trading has brought about a revolution in the financial markets: automation of trades with the help of complex algorithms. These algorithms execute trades according to predefined rules and are quicker in capturing market opportunities compared to manual trading. HFT in gold HFT-based algotrading has also greatly skewed the transaction volumes in recent years, but even though these trades are very short-term, they can tell us something about longer-term trading strategies.
---
2 What is Algorithmic Trading?
Algorithmic trading is a method of executing orders using automated, pre-designed trading instructions that account for variables such as trade timing, price, and volume. The platform has found application in the work of large financial institutions, hedge funds, and individual traders to facilitate the ease of trading strategy selection and optimization.
One might be, a set of rules that tells it to buy the gold if it falls below a certain level and sells as soon as the price of that gold hits a specified level. Traders can take advantage of small price movements without sitting in front of their screens all day.
---
3 Why use Algorithmic Trading?
There are various reasons as to why one would engage in Algotrading:
Speed: It is obvious that technology is used to carry out trades and computers do this faster than people. This proves extremely useful in fast markets like gold trading where prices may change in milliseconds.
Emotionless Trading: An individual does not deviate from the proposal; emotional elements like fear and greed that affect traders do not affect its operation.
Backtesting: Trading systems risk analyses can be done using test histories which access the performance of trading systems on historical figures, thus preventing any risk when trading.
Precision and Consistency: Algorithms maintain accuracy levels in trade initiation with almost never deteriorating without human intervention as only information is required regarding trading and no emotions.
---
4 Core Principles of Algorithmic Trading
Apart from trading in shares, forex or even taking a position in gold (XAUUSD) there are a few primary principles common to all algorithmic trading:
a Data Mining And Data Management
Technical Indicators – Besides backtesting and strategy optimization, algorithms employ very prominent technical indicators such as Moving Averages (MA), Relative Strength Index (RSI), Bollinger Bands, or other indicators associated with detecting trends or momentum.
Price Patterns – Other factors that might be of influence include pattern recognition algorithms which can be trained to identify specific shapes such as heads and shoulders, flags, or triangles, and thereby predicting price movements.
Volume Analysis – Volume analysis can be instrumental in price movement validation. Volumes increase during up-trend or down-trend and their analysis is essential when confirming trends or reversals.
b Machine Learning Models
Machine learning models aim to work in this way in modern algorithms with a view to predicting price changes in the near future. Algorithms that one develops or wires are fed with data sets and they learn patterns and devise methods of trading faster or more efficiently anyway as the case might be. There are other strategies like SVM, Random Forests, and Neural Networks that one can use to enhance predictive power.
c High-Frequency Trading
HFT involves placing numerous orders and getting them executed in split seconds and on some occasions microseconds. That is particularly attractive in cash markets like a gold market where there are narrow price bands in which one can place determinants and capitalize on the fluctuations.
---
5 Advanced Techniques in Gold (XAUUSD) Algorithmic Trading
Trading gold presents unique challenges and opportunities in the algorithmic trading world. Here are some advanced techniques tailored to the XAUUSD market:
Reinforcement learning has emerged as a powerful technique in gold trading. RL works as the trading systems interact with the market and improvise over the strategy by solving the problem by trying it in the market. This is useful for gold trading, as RL strategies are adaptable to external shocks such as economic news or investor sentiment changes.
They include sentiment predictions around precious metals.
Gold as an asset class has a unique character because it is a ‘safe-hoard’ asset and hence its price is subject to global and domestic conditions, military conflicts and general investor feel. Sentiment algorithms incorporate news, social networks, and reports on economics and stock markets to identify the mood of the investor's community. If there is a piece of news pointing to some uncertain or negative times ahead, then the algorithm predominantly directed by the sentiment may initiate purchases of gold.
---
6 The Future of Algorithmic Trading
Although this form of trading has not yet reached widespread use, the potential of quantum computing in investment strategies including gold markets is promising. Quantum calculations have been demonstrated to outperform classical computation in solving combinatorial optimization problems and processing big data. This can allow the development of new and better trading strategies and more effective utilization of unnecessary.
---
7 Practical Use of the Traders on Platforms like TradingView
With the inception of platforms like TradingView, algorithmic traders have been aided with a design, a test, and an automated strategy submission in the most reliant fashion.
a Algorithmic Strategies Implemented Using Pine Script
On its part, TradingView accepts user-written trading algorithms. Pine Script programming language is based on TradingView. These traders favor strategies resting on either technical indicators, patterns, or custom conditions. For instance, one can formulate a strategy to place a gold (XAUUSD) order whenever the price rises above its 50-day moving average and a closing order whenever the price goes down.
b Strategic Testing
Strategies (algorithms) are tested using back-testing methods incorporated in the trading software, this process is known as back-testing. A feature of the TradingView platform is that a trader can run their algorithms on record and see how those algorithms would have played out on historical data. This is important for adjusting the entry and exit plus the risk control parameters and further the performance of a strategy.
c Community Insights
Another benefit of using the TradingView platform is the community of traders around it who can post their strategies, exchange ideas, and learn from each other. You will be able to learn how other traders have taken to algorithmic trading with gold and other assets and be able to develop better strategies.
---
8 Tactics to Consider for New and Intermediate Trading Positions
The strategies provided for algorithmic trading may vary from simple to complex in levels. Below are some typical strategies that every trader should consider implementing in their trading practice:
a Trend Following
This is perhaps the most basic type of algorithmic trading. The idea is very simple; one buys those assets that are on the uptrend (bullish) and sells those that are on the downtrend (bearish). For example, in gold trades, a strategy for a trader may be quite simple: moving averages. For instance, an algorithm could be designed in such a way that it buys gold whenever the 20-day moving average of gold crosses the 50-day moving average upwards and sells when this situation is reversed.
b Arbitrage
Arbitrage strategies, as the very definition suggests, enable traders to exploit all such situations which emerge, due to the mispricing corrects routinely. In gold trading, for instance, this would refer to the action of selling short shares in an exchange retrieved in one exchange, where that price, would include a premium orchestrated by other markets.
c Mean Reversion
Mean reversion strategies originate from the classic concept that there is a high likelihood of prices returning to their average or mean. For instance, an algorithm buys an asset such as gold if its average is lower than the over its certain period moving average and sells whenever it is above that average.
d High-Frequency Trading (HFT)
HFT although it calls for many resources, there are traders who have this kind of approach to gold markets in that they seek to benefit from price changes within seconds or rather milliseconds HFT. This strategy also calls for other aspects such as having very good network connectivity to enable very fast execution of trades as well as high volume trades.
---
9 Conclusion
Algorithmic trading opens a world of opportunities for all kinds of traders. It doesn't matter whether you're a beginner looking into simple tactics such as trend-following or a seasoned trader putting more sophisticated approaches to work with gold (XAUUSD), there has never been a time that the tools and methods are more readily available to you for successful algotrading. Traders can use existing platforms such as our TradingView to develop, back & optimize their strategies to keep up with today’s fast-moving financial markets.
The financial world is evolving and staying up to date with these new breakthroughs in technology, including machine learning, sentiment analysis, and quantum computing will help give the traders the edge. Algorithmic trading can become everyone’s thing if one is patient, disciplined, and keeps learning.
Regards,
Ely
Harnessing the Power of Artificial Swarm Intelligence in TradingI) Introduction
Artificial swarm intelligence (ASI) has come in as the latest disruptor in trading and other industries in this world. This advanced technology, inspired by the sociobiology of social organisms like bees, birds, and fish, leads to the latest innovations and efficiencies found in the financial markets. Herein lies an informative overview of ASI, underscoring its principles and its utilities and advantages in trading.
II) What is Artificial Swarm Intelligence?
Artificial swarm intelligence makes one mimic the decision-making behavior of natural swarms. Swarms of bees, schools of fish, or flocks of birds in nature make group decisions that are often superior to those made by individuals in the same field. It exploits this relationship through algorithms and dynamic sharing of data to allow collaborative decision-making in artificial systems.
III) How Does ASI Work?
ASI has three basic components :
1) Agents: These are members of the swarm, often represented by single algorithms or software programs that take part, such as trading bots or software applications that analyze the market for many different data sources.
2) Communication Protocols: These protocols enable agents to relay information and together make decisions. Thus, good communication will enable all agents to receive the most current data and thus be aware of market trends.
3) Decision Rules: These are predetermined rules that guide agents regarding how to interpret data and make decisions. These rules usually imitate the simple behavioral rules present within the natural swarms-for example, either to align with neighboring swarming agents or to strive for consensus.
IV) Applications of ASI in Trading
1) Market Prediction: ASI systems can process enormous market datasets, recognize historical patterns, and analyze real-time news to make informed market predictions. By providing agents with a common perspective, this system is capable of forecasting stock prices, commodities, or any other financial instruments much more effectively compared with conventional techniques.
2) Risk Management: In trading, effective management of risk is a very important aspect. ASI facilitates the comprehensive examination of the volatility of the market and how individual investors behave to identify possible risks. In this way, the risk assessment will benefit from the wisdom of the crowds and its falling human error rate.
3) Algorithmic Trading: ASI controls technological trading as it is in constant evolution by the market and the traders. This evolution is beneficial in the aspect of lowering the costs of the trading algorithms concerning the costs of the transactions carried out.
4) Sentiment Analysis: ASI technologies monitor and examine the social networks, news, and traders’ discussions within trader communities to analyze these markets. Such up-to-date information avails the traders of the present atmosphere of the markets which is useful in making forecasts at the right time.
V) Merits of ASI in Trading
1) Increased accuracy: The inherent ASI decision-making characteristics increase the accuracy of market forecasts and trading decisions.
2) Greater efficiency: ASI digests material far more rapidly than older methodologies – enabling quicker actionable measures and therefore earning better trades by the traders.
3) Ongoing learning: ASI systems can learn and refresh their knowledge of the markets on an ongoing basis further increasing their adaptability.
4) Lower subjectivity: The incorporation of crowds helps to curb individual limitations and therefore results in a more objective analysis of the market that is devoid of personal bias.
VI) The Future of ASI
With the development of artificial swarm intelligence, its application in trading will surely diversify. More sophisticated agent communication systems will probably be necessary, faster information processing systems in real-time and systems with more capacity. All these will see the integration of ASI more into trading.
VII) In conclusion
Artificial swarm intelligence is a revolutionary method for making decisions in trading. The collective intelligence of the system allows traders to form better predictions accurately, increase their efficiency, and manage their risks. With future technological advancement, the role of ASI in trading will continuously see increased emphasis, leading the financial market into the future.
- Ely

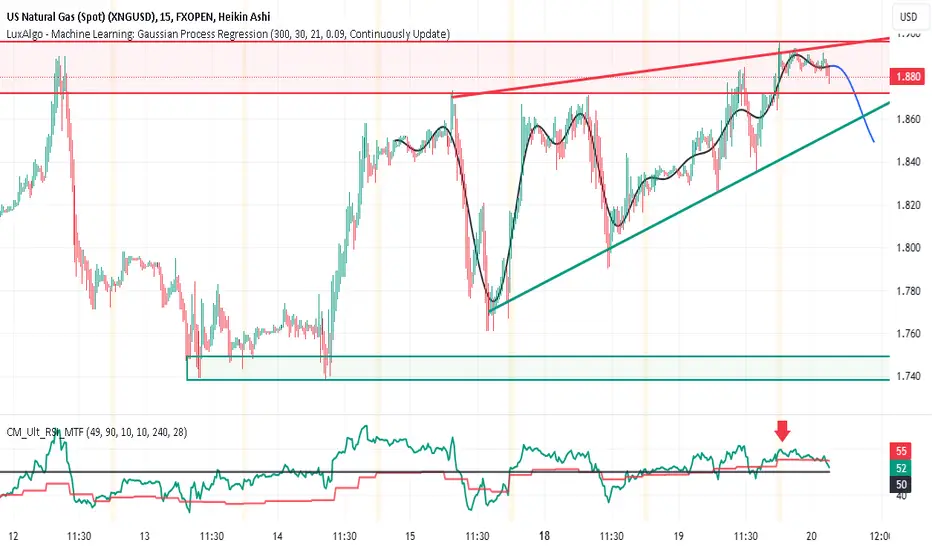
XNGUSD Spot Natural Gas to Reverse SHORTXNGUSD ( Spot Natural Gas ) on the 15 minute chart shows that it has risen to a supply and
resistance zone while the dual time from RSI indicator shows a bearish divergence in the
faster green RSI line. The predictive algo of Luxalgo for the regression line forecasts price
action to be downside. These are enough analytical aspects for me to take short positions on
equities and forex markets for natural gas correcting downside.
ALGO Price AnalysisAlgorand (ALGO) Analysis
Algorand (ALGO) has shown signs of recovery after a significant decline that saw its price drop from the $0.3199 level down to a low of $0.0938. Recently, ALGO has been trading within a narrow range, indicating some consolidation as it attempts to regain bullish momentum.
Currently, ALGO is hovering around the $0.1353 mark, just above the critical support zone (Yellow) at $0.1218 - $0.1270. Despite this recovery, ALGO faces strong resistance by the descending trendline seen in the recent price action.
If ALGO fails to break above the descending trendline, it may re-enter a bearish phase, pushing the price back toward the lower support levels that could determine its medium-term direction.
ALGO is currently at a crucial juncture, with the potential for further downside if it fails to break key resistance levels. Traders should watch for a break above the resistance zone (Green) at $0.1595 - $0.1661 for a potential bullish continuation or a rejection that could lead to a retest of the lower support levels.

GBPUSDGood morning traders, new week sale of new opportunities, I hope you have a week full of many profits. Today without any fundamentals in the middle we can see that the price can give very interesting entries both in sales in the London day and some succulent purchases for the NY day. Remember that we react, we do not predict.
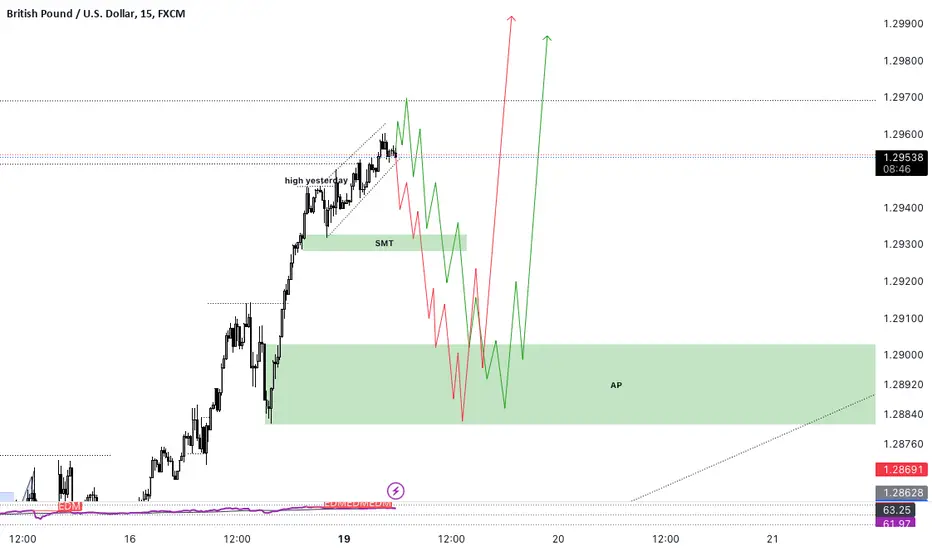
There are no better levels to trade than these, perfect ICT/SMCAlready know we are bullish, we have a decent re-entry zone in the +BB/FVG I marked with the 🐮
However, as we know when a new HTF FVG is printed, IPDA will bring all the resting orders higher into the range between here and 50% of the new FVG.
It's looking very clear from here. We love this type of one sided targeting

#ALGO/USDT#ALGO
The price of our channel is moving downward on a 12-hour frame, and it has been breached to the upside and is rising from the current levels.
We have a bounce from the lower border of the channel from the support area at 0.1200
We have a tendency to stabilize above the Moving Average 100
We have an uptrend on the RSI indicator that is heading up
Entry price is 0.1500
The first target is 0.1750
The second goal is 0.1900
The third goal is 0.2080

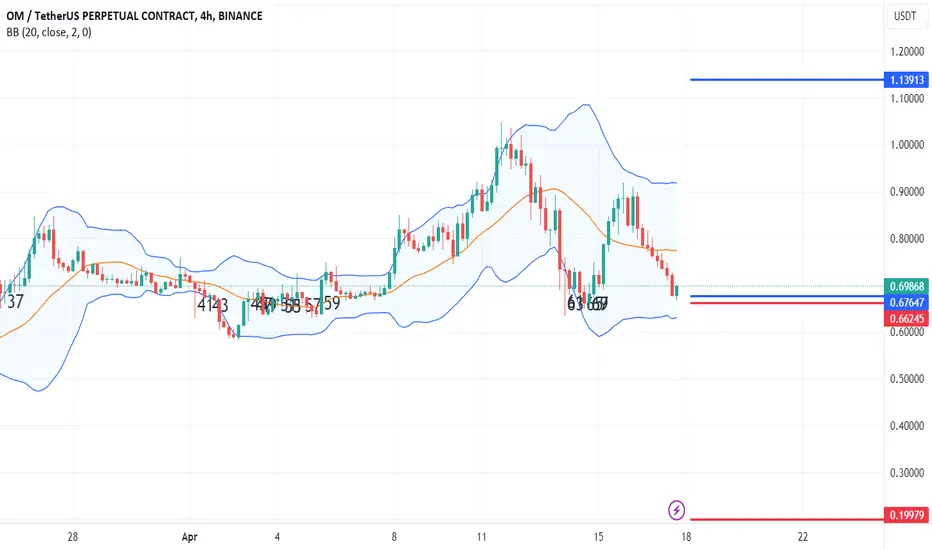
Cage Cycle Values for OmusdtCage Cycle Values: If the price is above 0.67647 (Buy Point), the price target is 1.13913, and if it is below 0.66245 (Sell Point), the price target is 0.19979. You can find the details of the Cage Cycle strategy attached. (MAKE SURE TO FOLLOW THE NEW TAKE PROFIT POINTS PUBLISHED AS TAKE PROFIT POINTS ARE INCREASED ACCORDING TO THE TRADING CYCLE)
Long Position:
Entry: 0.67647
Profit: 1.13913 (Will be updated if necessary in the positive direction)
Stop: 0.66245
Short Position:
Entry: 0.66245
Profit: 0.19979 (Will be updated if necessary in the positive direction)
Stop: 0.67647
The Cage Cycle Strategy is a model that emerges from analyzing approximately 2 over 20 data points (1,000,000 and above tick data). The price definitely reaches one of the specified Take Profit Points as a price target. It is not possible to determine the direction with a hundred percent certainty in financial markets. Therefore, success rates are attempted to be increased by using certain models. The Cage Cycles end when the price reaches the price target in any direction in the Cage Cycle Strategy. Although it is not an investment advice, an example of use is as follows: A Long position is opened at the price level of 0.67647, the Stop Loss is 0.66245, and the Take Profit is 1.13913. When the price reaches 0.66245, instead of the Long position that was stopped, a Short Position is opened, with the Stop Loss of the Short Position being 0.67647 and the Take Profit being 0.19979. Transactions are monitored by stopping until the market direction is determined. Considering the number of stopped transactions and the expected time, Take Profit points are updated to increase profits (Updated Take Profit Points will never be lower than the initially specified Take Profit points). By recalculating the Take Profit points to increase profits, the aim is to compensate for the losses of the stopped transactions when the Cage Cycle ends. In the data analysis of the last 10 years, the average number of stops is 12, and the highest number of stops is calculated as 83 (These figures may vary in the future). Although it is not an investment advice, in the Cage Cycle, if the amount to be stopped is set at $1, by increasing the position by half of the initial lot amount for every 10 stops (0.5 $ for every 10 stops), a higher profit can be targeted along with the increased Take Profit point. Using the Cage Cycle data provided above as an example for Peopleusdt, after 15 stops, when the cycle ends, the profit-loss calculation (Initial Stop Amount to be stopped is $1): For the first 10 stops, the loss will be 10$*1=10$, and between 10 and 15 stops, the loss will be 5*1.5$= 7.5$, resulting in a total loss of 17.5$. The profit to be obtained with the updated Take Profit points will be 1.5*27= 40.5$. The net profit, excluding commission, will be 40.5-17.5= 23$. The Cage Cycle helps you determine the Take Profit point in your own trades as well, as it is known that the price will definitely reach one of the Take Profit points. Enjoy and Good luck with your trades.
THIS IS NOT AN INVESTMENT ADVICE. Made by Yourcages
Is ETHFIUSDT to follow BTCUSDT higher?Hi there traders
We received a new signals from the EnF Breakout Strategy:
BUY on ETHFIUSDT
See idea for breakout entry, targets and stoploss
Only enter the trade when the price breaks above entry
Check out more on the script:
To get access to this script, DM me

Perfect entry zone ALGOIt need a bit of time, but finally Algorand entered the buy zone I was waiting for. We can see a nice accumulation inside this zone and actually the price is trying to break out from this zone. I expect a move to the upside in the coming weeks, targeting $0.28

US30 new ALGOS in play !!expecting the 3 hr high to be taken during ny open , a down move to take the weekly VALID draw on liquidity, to then get a bullish move up !!!

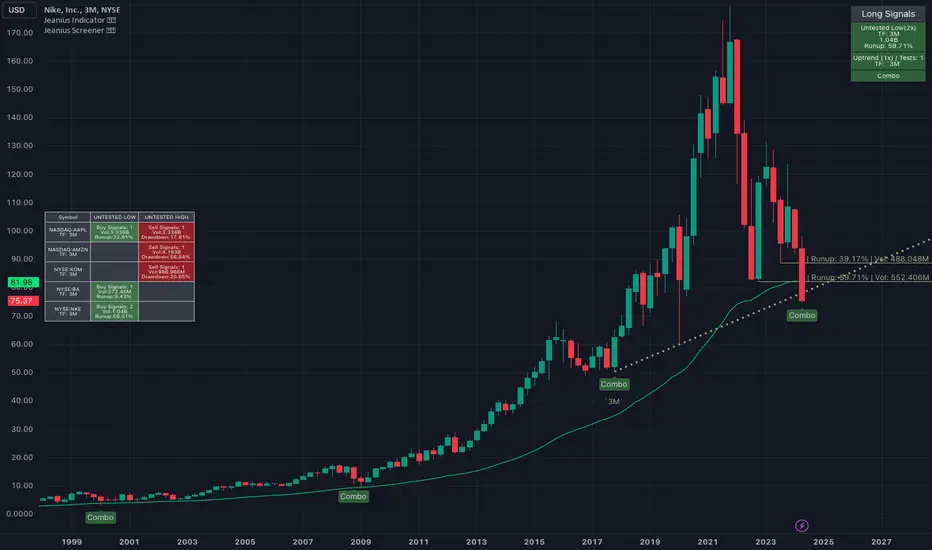
NKE Leap Call / Long Term BuyNike is setting up for a long-term buy / leap call opportunity. The Jeanius Indicator/Screener gave the following reasons why:
Price fell through two untested lows, taking out sell-side liquidity. The indicator shows how much volume came from and how far price ran up from these lows.
NYSE:NKE is also testing a 3M uptrend line from the low of 2017 through the low of 2020.
The brilliant Jeanius Indicator printed "Combo" labels on the chart when this specific combination of multiple confluences has occurred in history!!
HOTUSDT aiming lower?Hi there traders
We received a new signals from the EnF Breakout Strategy:
SHORT on HOTUSDT
See idea for breakout entry, targets and stoploss
Only enter the trade when the price breaks above entry
Check out more on the script:
To get access to this script, DM me

TURBOUSDT moving higherEnF Breakout Strategy signaled BUY on TURBOUSDT
See idea for breakout entry, targets and stoploss
Only enter the trade when the price breaks above entry
Check out more on the script:
To get access to this script, DM me
