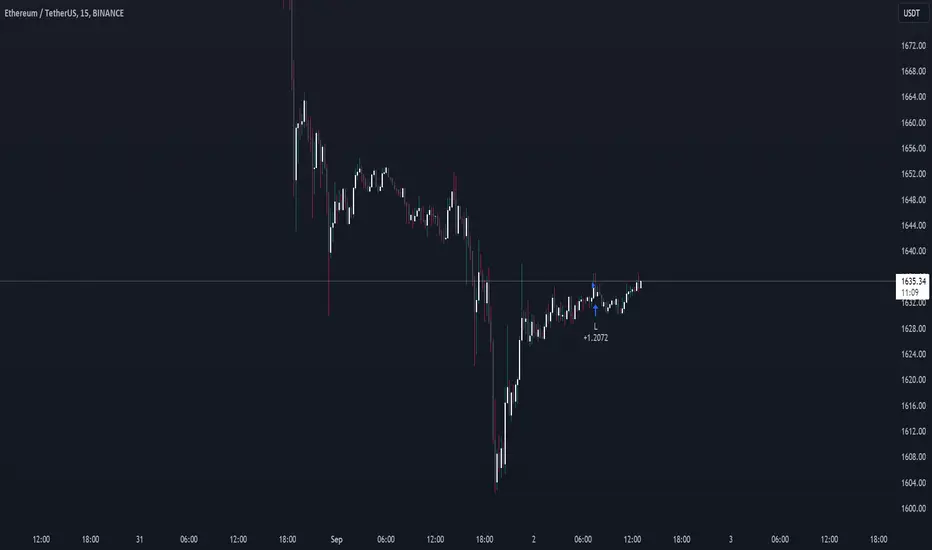
ETH LONG Signal📈 Long Signal Alert 🚀
I'm taking a bullish stance in the very short term! My algorithm just flashed a long signal. 📈 Let's ride this trend together! 🚀
Algotrading
AAPL LONG SIGNALLONGING Apple based on my Algorithm, will update the trade once an Exit signal has occurd.

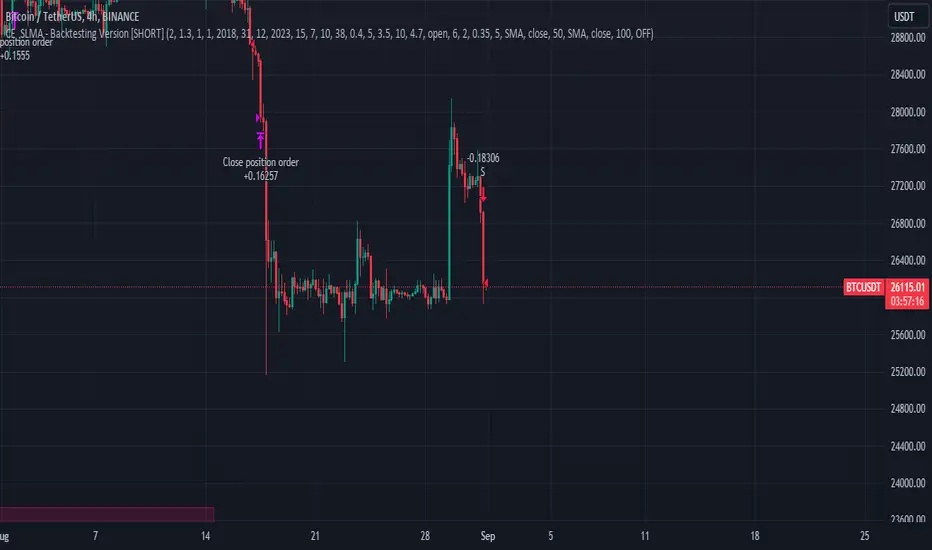
BTC SHORT SIGNALJust got a BTC USDT Short Signal, will enter the trade with a Leverage of X15 and 7% equity and a SL of 3.5%
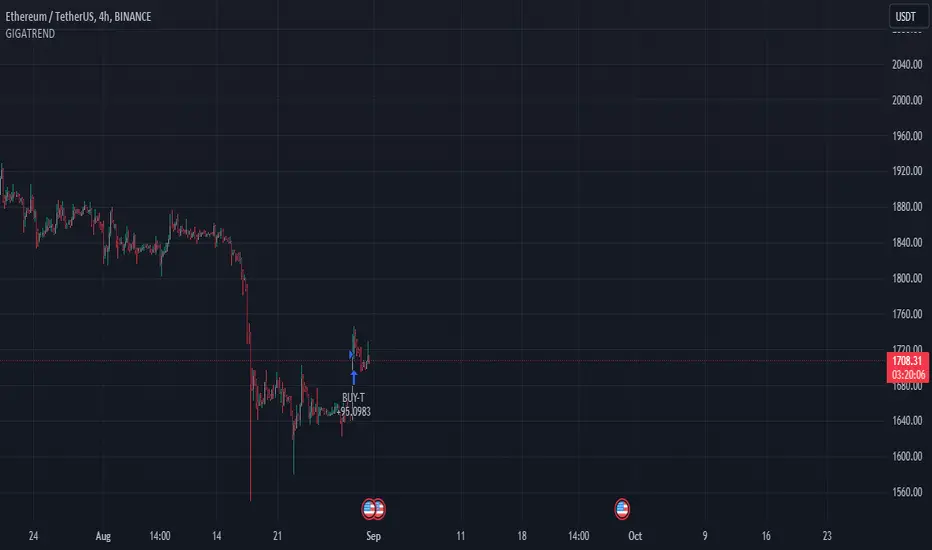
ETH USDT LONG SIGNALFresh LONG Signal on ETH/USDT, as usual i will update the trade once an exit signal appeared on the chart.
TSLA LONG SIGNALWe have a good Long Entry Signal on TSLA in the 4h Chart.
So far the Signals of the Algo had a good winrate, as usual i will update the Trade as soon as an EXIT Signal appears.
Stay tuned

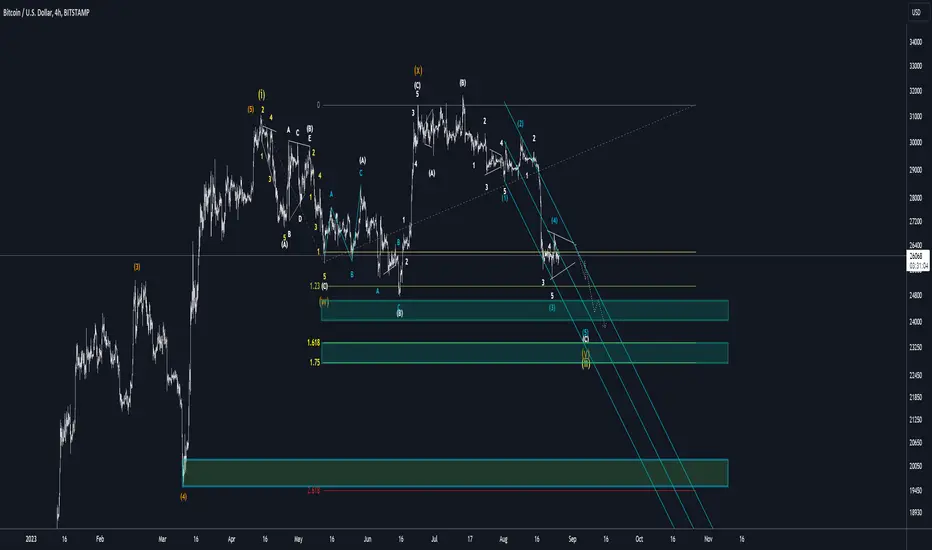
Areas of support for BTCCurrent sugested count for BTC would be a sideways combo containing
W Zig zag
X Flat
Y Flat
Even tho this looks like an Flat structure, we cant have flats in waves B of a bigger flat accorrding to Elliottwave international.
Green areas are places where i am waiting for potential supports and bounces.
If we are creating (i) yellow (ii) yellow, this could be the opportunity of a life time for traders.
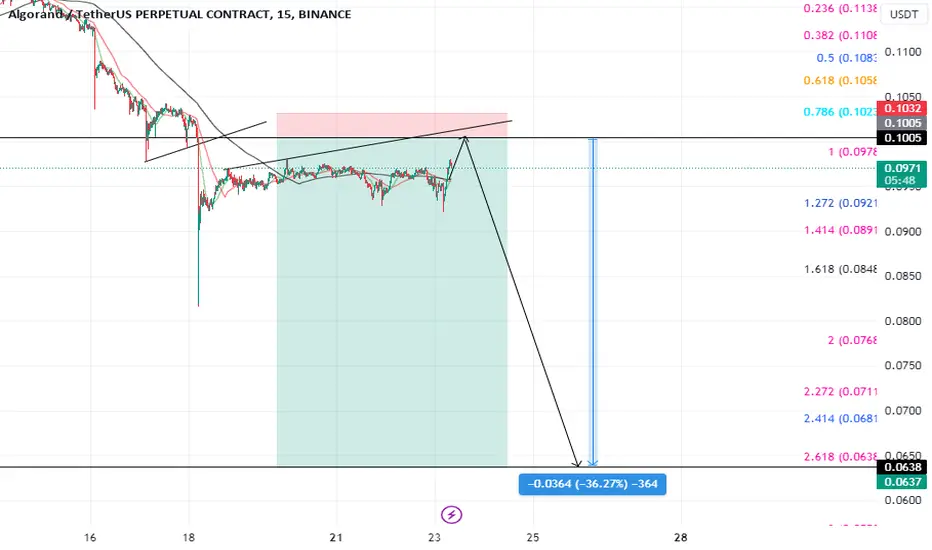
algo potensial shortalgo potensial break down again after failed close above 0.1031$
i think move to 0.0638$
short posision OP 0.1005
TP 0.0638$
Signalwyse Daily Stock Picks SeriesSignalwyse Daily Stock Picks Series - 22 August
Traders execute daily buy positions at the beginning of the trading day and sell before the market closes. This active approach aims to capitalize on short-term opportunities, enabling you to act on our carefully selected top 10 S&P 500 stocks.
We will share 2 of the top 10 stocks daily.
Check the website on our bio for more.
-Signalwyse Team

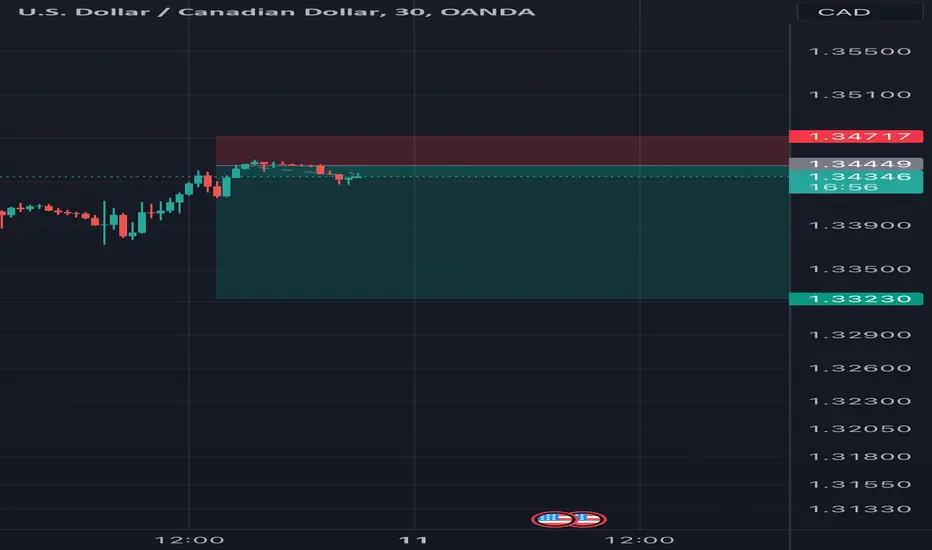
USDCAD SHORTCaught this entry about 5 pips late due to waiting for confirmation on 30 min candle,
I’m expecting it to drop until news on 14th comes out this is not a long term hold AUG 13th max before closing positions i seen that right as 30m candle and 2 hours candle tapped liquidity block it immediately reject expecting a harsh drop after retracement keep stop tight on this one everything lines up
5min bearish candle
30min bearish candle
2hr bearish candle
Take at own risk
ALGO weekly looks bullish but needs momentumALGO weekly needs to perform a short squeez or ALGO dies!Lower Timeframe Brewing for a spiky move.
Thanks for watching

ALGO target 0.16~0.174h time frame
-
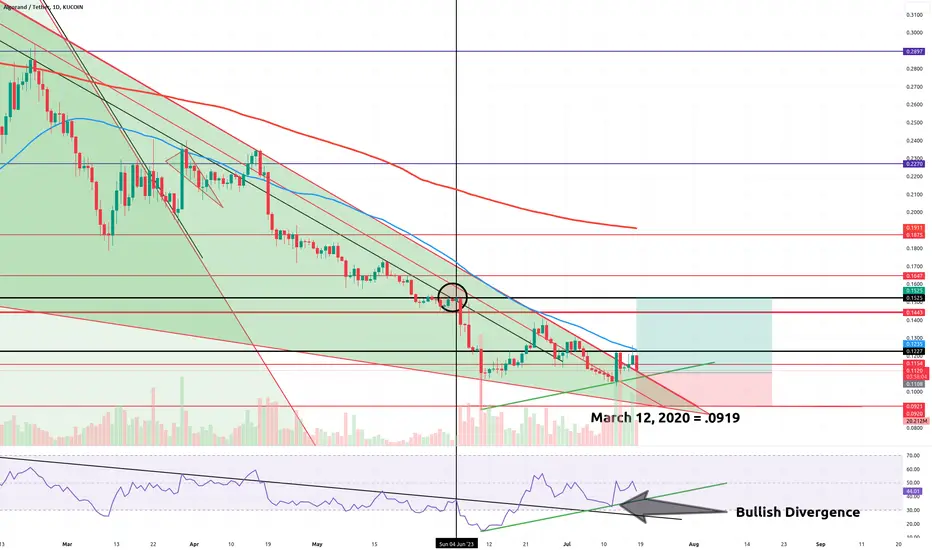
ALGO approaching history low and creating triangle structure here.
Support from uptrend is good entry to set a long trading plan.
TP: 0.16~0.17
SL: 0.089

XRP's Algo: A Recurring Pattern Unfolds to $160 XRP's Algo: Unfolding Recurring Patterns as 2023 Approaches the 60-Week Cycle End
Introduction (7-10 minute read)
XRP, the digital asset native to the Ripple network, has intrigued investors with its seemingly algorithmic price movements. Over the years, it has exhibited a striking tendency to replay the same market moves across different time frames, creating patterns that appear to repeat themselves with variations. This article aims to delve into XRP's algorithmic behavior, the recurrent patterns observed, and the significance of the 173-week and 60-week cycles in shaping its price trajectory. As we approach the end of the 60-week cycle in 2023, we will explore how XRP's historical patterns may guide investors' expectations.
XRP's Algo Replay: A Tale of Recurring Patterns
XRP's price history reveals a captivating phenomenon wherein it appears to follow an "algo replay." This notion suggests that XRP adheres to a discernible pattern, where market moves repeat over time, although the specific chart formations may differ. This algo replay has piqued the interest of investors and analysts, as it offers insights into potential future price behavior.
The 173-Week Pump Phenomenon
A remarkable aspect of XRP's algo replay is the occurrence of significant pumps at approximately 173-week intervals. This cyclical trend has been observed multiple times in the past, wherein XRP's price surges to new highs before experiencing periods of correction and consolidation. These pumps serve as critical inflection points in the asset's price trajectory.
The 60-Week Cycle and the Bart Simpson Pattern
Among the fascinating elements of XRP's algorithmic behavior is the existence of the 60-week cycle, which appears to influence market moves significantly. Notably, before the start of each 60-week cycle, XRP tends to exhibit a distinct pattern colloquially known as the "Bart Simpson" pattern. This peculiar formation resembles the head of the iconic cartoon character, characterized by a sharp upward spike, followed by an equally sharp downward move, forming a inverted "V" shape.
Volatility and Shakeouts: Setting the Stage for Price Surge
Following the emergence of the Bart Simpson pattern, XRP often experiences heightened volatility, leading to a price shakeout, affectionately known as "The Wise Owl Buy-In Period." During this phase, the price is deliberately pulled back sharply, causing uncertainty and fear among investors. This shakeout scenario leads some to sell off their positions, while others attempt to buy back in at lower prices. A few may become overly bearish, risking missing out on a quick recovery once the shakeout period subsides, which could span from 1 to 3 weeks. While exact dates remain uncertain, our speculative outlook foresees XRP reaching $24 around 11/20/23, with continued growth towards $160 by 7/8/24. As XRP's usage and adoption surge, we firmly believe it will surpass three digits in value and beyond. The future holds immense promise for this dynamic digital asset.
"Dates may be subject to change, with a window of a few weeks to a month for flexibility. Please note that the exact dates are not fixed, and we are not providing specific deadlines."
2023: Approaching the End of the 60-Week Cycle - "The Reminder of the Wise Owl Buy-In"
As we approach the end of the 60-week cycle in 2023, historical patterns indicate that we have already witnessed the emergence of the Bart Simpson pattern. Currently, we are experiencing heightened volatility and are approaching the potential shakeout scenario. If this pattern repeats, which is likely, we may observe a dip in XRP's price, possibly reaching around $0.35 or even $0.11. Such movement could trigger fear among a large majority of investors, leading to widespread selling. In these uncertain times, we remind you to always be a wise owl and be ready for anything.
The Lawsuit Suppression and its Implications
In December 2020, XRP faced a significant lawsuit, resulting in a period of price suppression that held back potential gains. Despite this legal challenge, XRP managed to produce a substantial pump, hinting at its resilience and potential for future growth.
Decoding Crypto Moves: Unraveling the Enigma of Organic vs. Algorithmic Influence with Pre-Planned Excuses
The cryptocurrency market's mysterious and volatile nature has given rise to intriguing conspiracy theories. One such theory questions whether price movements in the crypto market are driven organically or if they are a result of carefully orchestrated algorithms replaying the same patterns year after year. This section delves into the eerie concept of an "invisible" algo manipulating the market, with news events serving as mere excuses for its predetermined moves, and explores the implications for XRP's future.
The "Invisible" Algo: A Crypto Enigma
The notion of an "invisible" algo playing puppeteer in the crypto market is both captivating and unsettling. Skeptics suggest that recurring patterns observed in assets like XRP point to the presence of an underlying algorithm, meticulously executing trades to produce similar outcomes over time. According to this theory, the algo's influence is so apparent that it can even anticipate news events and use them as an excuse for its predetermined moves.
The Uncanny Connection Between Past and Future
Proponents of this theory argue that past price behavior holds clues to the future trajectory of cryptocurrencies. If historical patterns indeed foreshadow future moves, XRP's potential to soar to $160 or beyond becomes a chilling possibility. However, this scenario rests on the assumption that the alleged "invisible" algo will continue to replay the same patterns with eerie precision.
Navigating the Fun and Fright of Cryptocurrency
While the idea of an "invisible" algo dictating the crypto market's moves may sound like a creepy fun conspiracy, it remains a speculative theory without concrete evidence. The true nature of price movements in the cryptocurrency market is likely a complex interplay of algorithmic influences, news events, and various market forces. As investors navigate this mysterious realm, it is essential to remain open-minded, well-informed, and prepared for the unexpected. While past behavior can offer insights, the future of cryptocurrencies, including XRP, remains uncertain and subject to a multitude of factors. Embracing the thrilling and enigmatic nature of the crypto market may be the key to making sound investment decisions in this dynamic digital frontier.
Conclusion
XRP's algo replay, characterized by recurring patterns and cyclic price movements, has intrigued the investment community. The observation of the 173-week and 60-week cycles, along with the emergence of the Bart Simpson pattern and subsequent shakeouts, lends credence to the notion of XRP's algorithmic behavior. As 2023 nears the end of the 60-week cycle, investors should remain vigilant, considering historical patterns while evaluating their positions. However, it is crucial to remember that market dynamics can be unpredictable, and past performance may not always foreshadow future outcomes.
As a reminder, this content is not financial advice, and we are not providing specific or concrete moon dates. Our analysis is based on past price movements and should be considered speculative in nature. I hope you enjoyed this read. Follow for more updates.
Yours truly NeverWishing.

Trade Alert - Long AlgoClassic Retest here. Due for a pop.
Position = ALGO
Direction = long
Entry = .1118
Stop Loss = .0919
Take Profit(s) = .1537
Risk/Reward = 2.25
Leverage = NONE
Profit Potential = 37%
Not financial advice.
Just letting you all what I am doing.
Best,
Stew
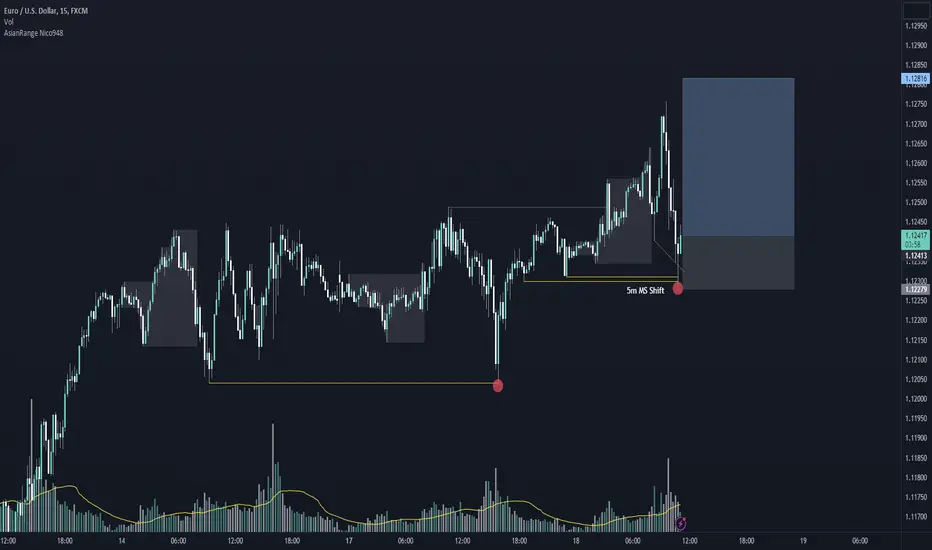
EUR/USD London Session Long - July 18 '23Price on a bullish trend is currently on our favour with liquidity. Took out asian low with a Wolfe wave as well, reacted and broke the m5 market structure giving me the confirmation I was looking for. Looking for a continuation of this bullish trend with a 1:3 risk-reward ratio. Good Luck Traders...
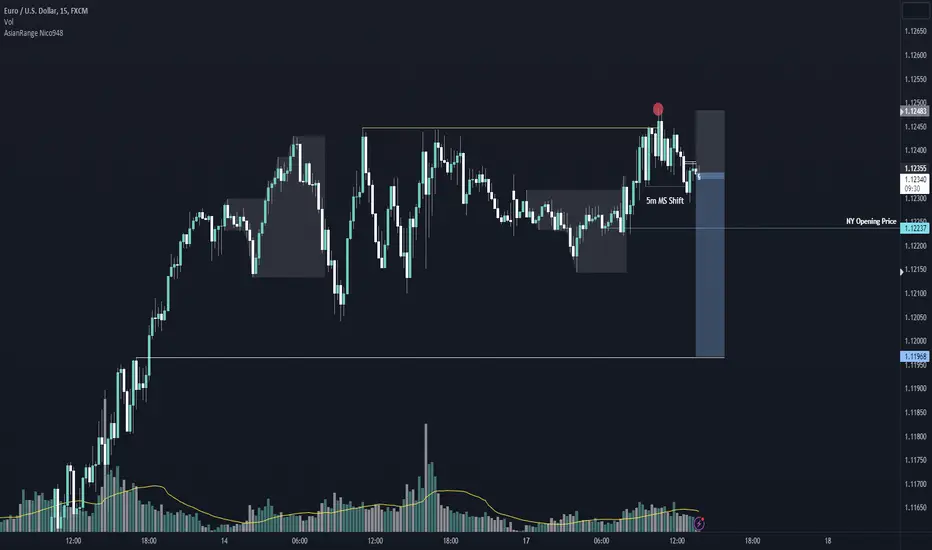
EUR/USD Short - July 17 '23We are currently on a very high premium zone on EUR/USD. Formed lots of liquiidty with equal highs as well. Price liquidated higher forming a bearish engulfing candle on the H1 timeframe. Now price is closing the bearish engulfing candle imbalance and shifted market structure as well. Price above the NY opening price. Targeting a very nice zone of imbalance below. Lots of zones to rebalance below. Aggressive reversal trade, good luck traders!
Will SPY continue to rise? LONGOn the 30- minute chart, SPY is in an uptrend continuing from the end of the last
trading week. I see this as continuing for the following reasons on analysis:
1. The Lorentzian AI machine learning indicator's last signal was a buy signal. Given its
specific accuracy of 73% as the table reports, I suspect the uptrend will continue until
a sell signal prints.
2. The VWAP anchored to July 6th shows price riding the upper VWAP bands suggesting that
buying pressure exceeds selling pressure over the past week.
3. The MTF RSIs are steadily rising with the lower TF above the higher TF and no evidence
of weakening or bearish divergence.
4. The zero-lag MACD shows lines crossed and are now parallel and about to cross over the horizontal zero line.
5. In the last trading day, the price ran up then momentum stalled for profit-taking and consolidation to rest for the next.
6. Trading volumes have been at or above the running mean throughout the recent past
showing higher than usual trader interest which bodes well for volatility to be played for
profit.
7. If I were looking for chart patterns, I would say that SPY is currently a high tight flag. It is expectant of bullish continuation
Overall, I have further interest in trading call options with a low time interval until
expiration. I will use intraday pivots on low time frames to select entries and pick
strikes based on expected moves in analysing VWAP bands or Bollinger Bands.

DCA bot and my experience with it!Hey there, fellow crypto enthusiasts! Welcome to my blog, where we break down the complex trading world into bite-sized knowledge nuggets.
Today we're diving headfirst into the exciting strategy of Dollar Cost Averaging (DCA) and how it works with trading bots.
Dollar Cost Averaging Demystified
Alright, folks, let me break it down for ya. Dollar Cost Averaging (DCA) is an investment strategy that's all about taking it slow and steady. Instead of going all-in at once, DCA has you regularly buying a particular asset, like bitcoin, in small chunks over time. It's like sipping your favorite beverage gradually instead of chugging it down in one go. We want to savor those gains, people!
Smooth Sailing through Market Turbulence
Here's the kicker, my friends. DCA helps you ride out the crazy rollercoaster of price fluctuations. Picture this: Bitcoin's price takes a nosedive. Ouch, right? But fear not! With DCA, you're buying during the dip, baby! So when the price inevitably bounces back up, you'll sit pretty and reap the rewards. On the flip side, if the price skyrockets, well, you might have some losses when it takes a breather. But fear not again! Since you're investing small amounts regularly, you're not putting all your hard-earned cash at risk. It's like having a financial safety net during those market downswings. Sweet, isn't it?
What figures and patterns do I recommend using?
Firstly as a continuation pattern, I would like to search for a triangle, flags, and wedge.
Also, you can catch the price squeeze and the volume spike to catch the volatility on it.
For example, the last setup of that pattern was on $Matic.
How I automated trading with the DCA strategy
I try to be smart with my time, and after figuring out how DCA works, I regularly practice automation using this strategy.
Here are my tips and personal configurations: so, if you want to trade with small leverage, 3x-6x will be enough for you. The maximum risk is 10x.
Try to make simple trades, and think about trends at the beginning of your charts. And then you will start to win.
Here are the results of trading with the DCA Futures bot
As you can see, it's possible to make money with bots. However, it requires understanding of how they work and knowledge of coin analysis. The case is that you free up your time for other things.
Also, note that my advice is not a call to action. Everyone is responsible for their own trading decisions.
Questions:
New trading strategies.
Do I analyze myself with VSA indicators, like BOS? ( Break out structure)
I often use wedge and triangle patterns with significant consolidations in my work. Once I identify these patterns, I wait for a push of the price increase resulting from the liquidity and then activate my trading bots. This way, I actively participate in the market and observe how my strategies perform.
Are you interested in learning more about the settings you can use with the DCA BOT? I'll be happy to share that information with you next time.
Hang tight for more mind-blowing posts where I uncover various investment strategies and financial wizardry to help you conquer your financial dreams.
I wish you successful trades!

BTC Algo Trade with Izci IndicatorYou can trade with Izci Indicator by using it's lines.
Izci Indicator has 3 lines and while price crosses up these lines, it means strong buy signal.

TrendmapTM Algorithm for Crypto and StocksHello,
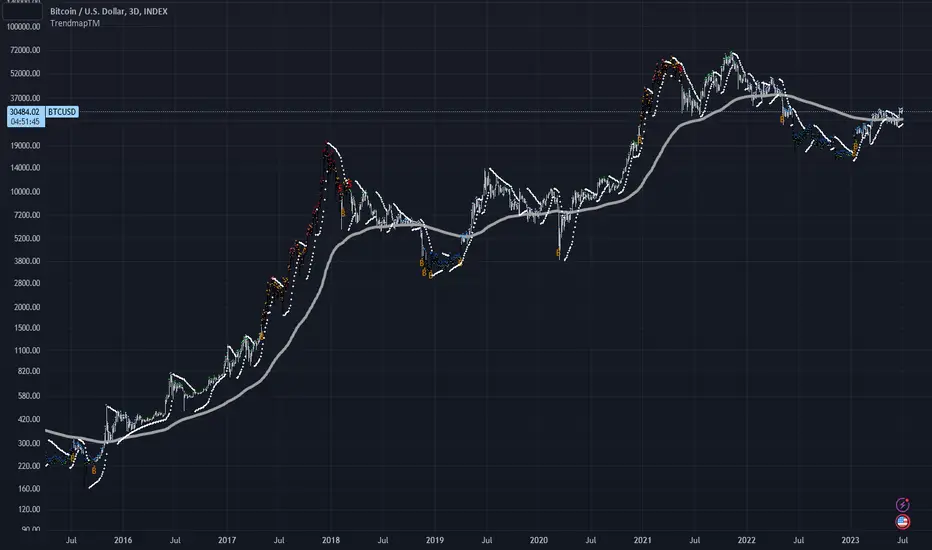
The algorithm I employ, aptly named "TrendMapTM", is a sophisticated trading system developed to project market trends with remarkable precision. Its unique feature is its ability to overlay predictive trends directly onto an asset's price chart. TrendMapTM shines in accurately pinpointing oversold and overbought levels, making it a critical tool in any trader's arsenal.
It visually encodes various trading conditions using a variety of shapes and colors on the chart. This includes crafting distinctive candlestick patterns when Dollar-Cost Averaging (DCA) In/Out conditions are met, representing uptrends with green candles, and downtrends with red ones. It also showcases buy/sell signals with unique shapes placed either above or below the price bars, thereby providing clear action points.
A notable feature of the algorithm is its robust system of flags that diligently track potential re-buy opportunities, thus ensuring you never miss out on lucrative market positions.
The TrendMapTM algorithm integrates various technical analysis techniques and indicators to provide vivid buy and sell signals. By methodically analyzing and interpreting the interrelation of these factors, it equips users with the guidance required to make profitable trading decisions.
This algorithm is the culmination of my 5-year-long intensive research and has proven to be an exceptional strategy for both cryptocurrency and stock investors.
Best Regards,
Stardust (@TrendmapTM)
TREND NIFTYDiscover game-changing signals generated by our upcoming trend algorithm. Follow us for exclusive, complimentary access upon launch

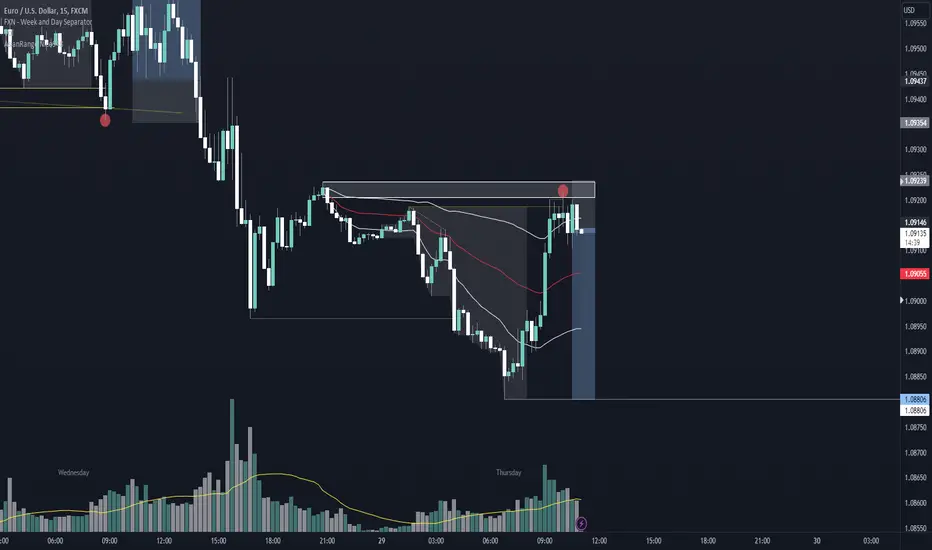
EUR/USD Short London Open - June 29th 2023Potential setup to go short here on EUR/USD after we had this bullish push on London open taking out all the highs of the current dealing range that could act as inducement. Price rejected off the current order block and gave us a confirmation to enter short. Manipulation is confimed also with price extending out of the VWAP
EUR/USD London Session - June 20th '23Setup to go short on EUR/USD. We are currently on a new formed uptrend on the m15. Filled imbalances, taken out liquidity during Asia and we are now aiming to target at least the double top above. We just closed the H4 imbalance and the bullish engulfing candle on the 15 min gave us a nice confirmation to enter long.

Algorand longAlgorand broke trough the descending trendline. Asset broke trough the resistance level. Bullish movement to resistance level at 0.138 is expected to happen.
