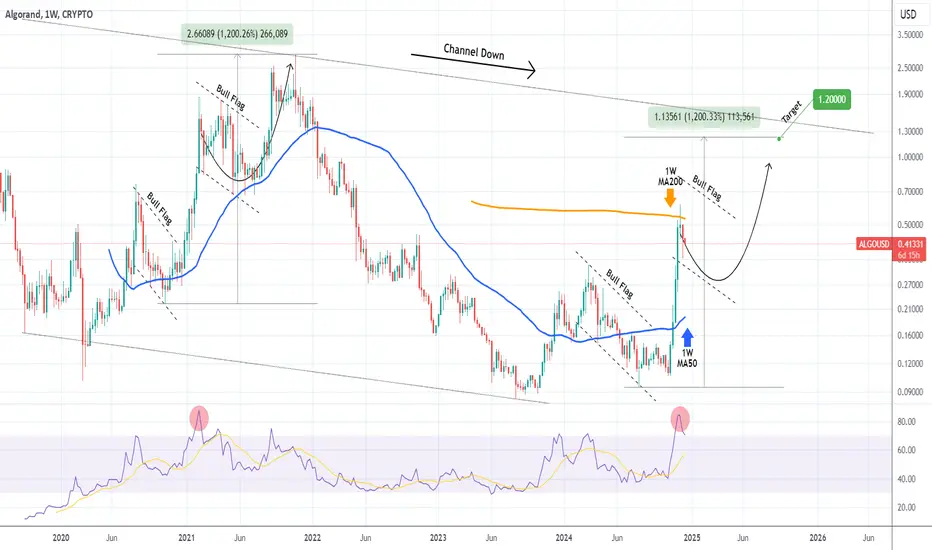
ALGOUSD Bull Flag giving a new opportunity to buy.Algorand (ALGOUSD) posted last week its first red 1W candle after an impressive rally of 5 straight green weeks since the U.S. elections. This rally technically stopped on the 1W MA200 (orange trend-line), as although it crossed it, it failed to close the 1W candle above it, which resulted in last week's rejection and red candle.
The 1W RSI turned from extremely overbought (+85.00) to about turn just bullish below the 70.00 barrier. The last time we saw a similar price/ 1W RSI behavior was during the November 2020 - February 2021 rally. As you can see, both started on Bull Flag formations that initiated those impressive rallies that were supported by the 1W MA50 (blue trend-line).
When the February 08 2021 1W RSI hit 85.00 and got rejected, the price started a new Bull Flag pattern that by June 21 2021 hit the 1W MA50 and after forming a multi-week Support base, it rebounded again aggressively. The whole sequence from the November 2020 rally to the November 2021 Top was a +1200 rise.
We expect a similar development and as the dominant historic pattern of Algo seems to be a Channel Down, the next rally can complete a +1200% rally just below the pattern's top (Lower Highs trend-line) at $1.200.
-------------------------------------------------------------------------------
** Please LIKE 👍, FOLLOW ✅, SHARE 🙌 and COMMENT ✍ if you enjoy this idea! Also share your ideas and charts in the comments section below! This is best way to keep it relevant, support us, keep the content here free and allow the idea to reach as many people as possible. **
-------------------------------------------------------------------------------
💸💸💸💸💸💸
👇 👇 👇 👇 👇 👇
Algousdsignals
ALGOUSDT 1WALGO ~ 1W
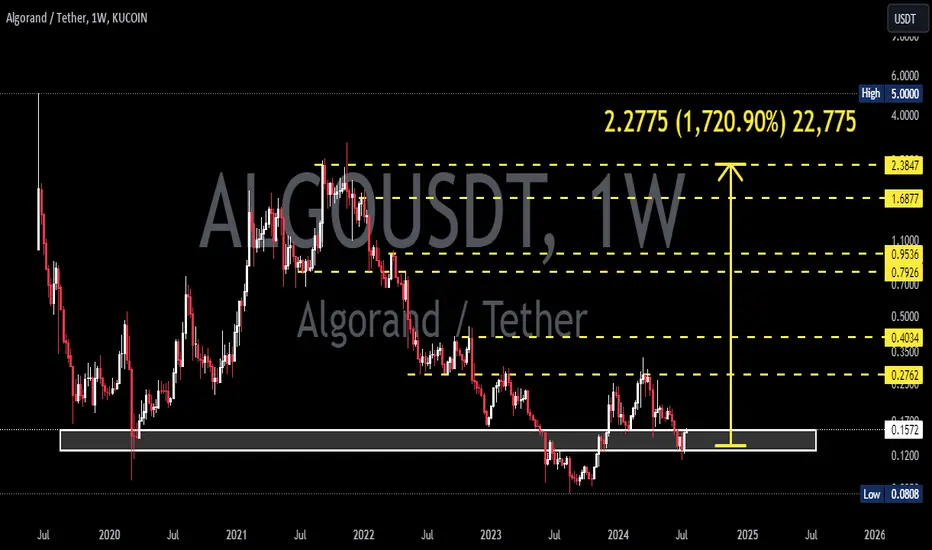
#ALGO Make gradual purchases within this support block, with a short-term target of at least 20%+
ALGOUSD 1WALGO ~ 1W
#ALGO Forming a H&S Pattern on a 1W Time Frame. It's quite interesting to place small purchases here, with a target of at least 20%+

ALGOUSD Pump of the day! Huge buy opportunity.Algorand (ALGOUSD) is having a huge pump today as it smashed above the 1D MA50 (blue trend-line) for the first time since April 01. This rally has been generated after holding and bouncing on the 1W MA50 (red trend-line) for the 2nd time since January 23.
This gives shape to a Channel Up, not so different from the one that led the token to its peak during the previous Cycle. The 1D MACD has just formed a Bullish Cross, indicating that we are still at the very start of the new rally. Our Target is 2.000 (Fibonacci 0.9 retracement level).
-------------------------------------------------------------------------------
** Please LIKE 👍, FOLLOW ✅, SHARE 🙌 and COMMENT ✍ if you enjoy this idea! Also share your ideas and charts in the comments section below! This is best way to keep it relevant, support us, keep the content here free and allow the idea to reach as many people as possible. **
-------------------------------------------------------------------------------
💸💸💸💸💸💸
👇 👇 👇 👇 👇 👇

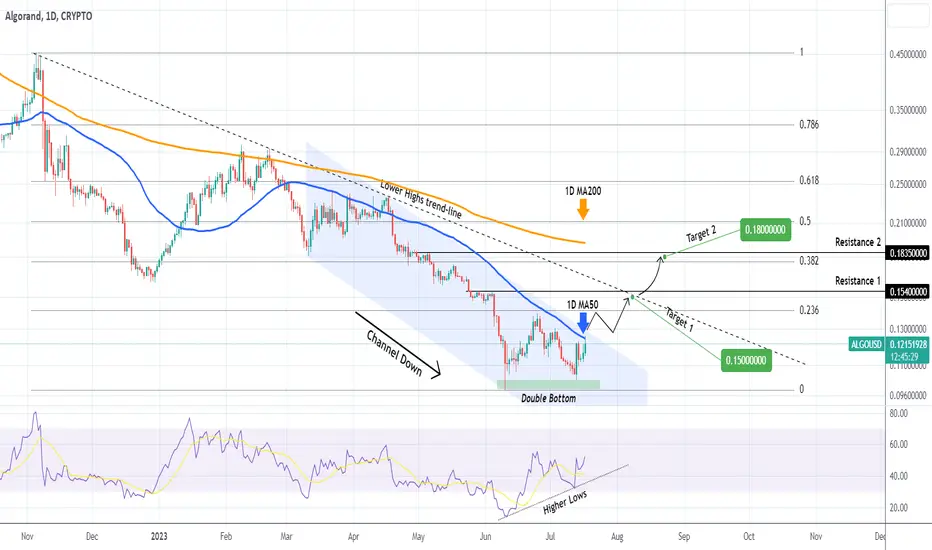
ALGOUSD Ahead of the first major bullish break-out in 4 months.Algorand (ALGOUSD) has hit today the 1D MA50 (blue trend-line) for the first time since April 17. That is also the top of the 4-month Channel Down pattern. If broken, it may turn out into the first such major bullish break-out move this year as not only is the price rebounding off a Double Bottom but the RSI is on a huge Higher Lows line (Bullish Divergence).
As a result, we will go long if the 1D candle closes above the top of the Channel Down and target 0.15000, which is not just near Resistance 1 but more importantly the Lower Highs trend-line since the February 21 High.
On the longer-term if a 1D candle closes above that Lower Highs trend-line as well as Resistance 1, we will buy again targeting 0.18000 (within Resistance 2 and the 0.382 Fibonacci).
-------------------------------------------------------------------------------
** Please LIKE 👍, FOLLOW ✅, SHARE 🙌 and COMMENT ✍ if you enjoy this idea! Also share your ideas and charts in the comments section below! **
-------------------------------------------------------------------------------
💸💸💸💸💸💸
👇 👇 👇 👇 👇 👇
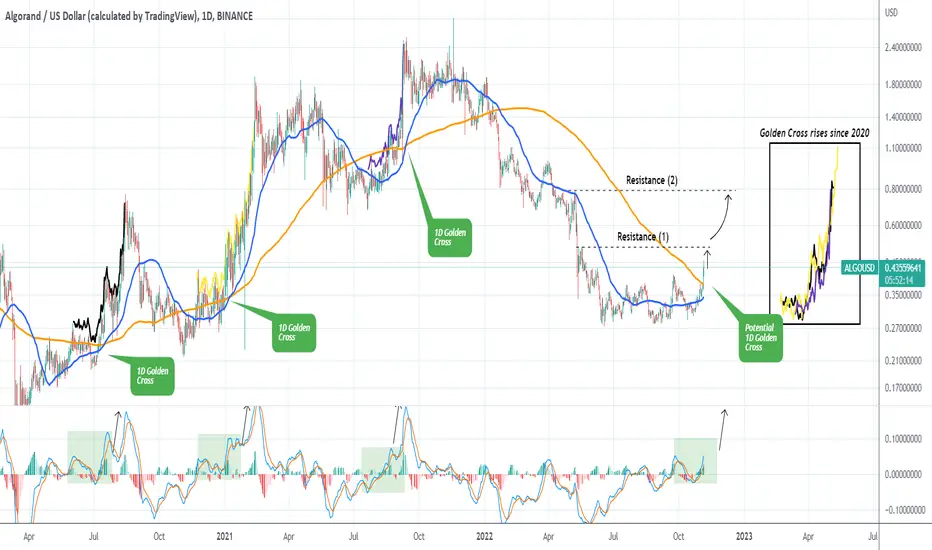
ALGOUSD Potential Golden Cross can send it to 0.800.Algorand (ALGOUSD) is having an impressive rise since November 02 where after a small pull-back, successfully tested the 1D MA50 (blue trend-line) as a Support. Yesterday it even broke above the 1D MA200 (orange trend-line) for the first time since January 13 and that is on its own a major bullish break-out.
However on this chart we want to focus on the emerging Golden Cross pattern on the 1D time-frame (when the 1D MA50 crosses above the 1D MA200). A potential new Golden Cross, can have the immediate "rally effect" of those that took place post 2020. As you see there have been three occurrences (July 15 2020, January 07 2021 and September 21 2021) all posting similar MACD patterns as today's. As you see the rallies that followed the Golden Crosses have been very aggressive. For better illustration and comparison purposes, we have put them all inside a table.
Those of July 2020 and Sep 2021 have been on similar magnitude while Jan 2021 has been a bit stronger. Assuming a similar rally takes place, ALGO could reach as high as 0.800, which is around the May 08 High (Resistance 2). Of course we need to consider 0.5100 and Resistance 1 as well.
-------------------------------------------------------------------------------
** Please LIKE 👍, SUBSCRIBE ✅, SHARE 🙌 and COMMENT ✍ if you enjoy this idea! Also share your ideas and charts in the comments section below! This is best way to keep it relevant, support me, keep the content here free and allow the idea to reach as many people as possible. **
-------------------------------------------------------------------------------
You may also TELL ME 🙋♀️🙋♂️ in the comments section which symbol you want me to analyze next and on which time-frame. The one with the most posts will be published tomorrow! 👏🎁
-------------------------------------------------------------------------------
👇 👇 👇 👇 👇 👇
💸💸💸💸💸💸
👇 👇 👇 👇 👇 👇
ALGOUSD on a strong bullish streak but not a Buy Opportunity yetAlgorand (ALGOUSD) has completed a strong 3 day bullish streak coming close to the 1D MA50 (blue trend-line) again for the first time since the first week of April. Despite this green short-ter display, it is not a buy opportunity yet, as on the medium-term it remains within a Channel Down (dashed lines) and on the long-term it has broken below the Channel Up.
A buy signal will be given, when the price breaks above not just the 1D MA50 but also the Lower Highs trend-line (top) of the Channel Down. This Channel can be seen better on the linear scale:
On the long-term, which will be the safest trade, ALGO will turn into a confirmed buy once the price breaks not just above the 1D MA200 (orange trend-line) but also the 1W MACD makes a Bullish Cross. As you see, the last two MACD Bullish Crosses, have resulted in strong rallies within a 2-year time-frames.
Until those medium and long-term conditions are met, Algorand can be moving lower and lower in accordance to the lower Fibonacci extensions shown on the chart.
--------------------------------------------------------------------------------------------------------
** Please support this idea with your likes and comments, it is the best way to keep it relevant and support me. **
--------------------------------------------------------------------------------------------------------

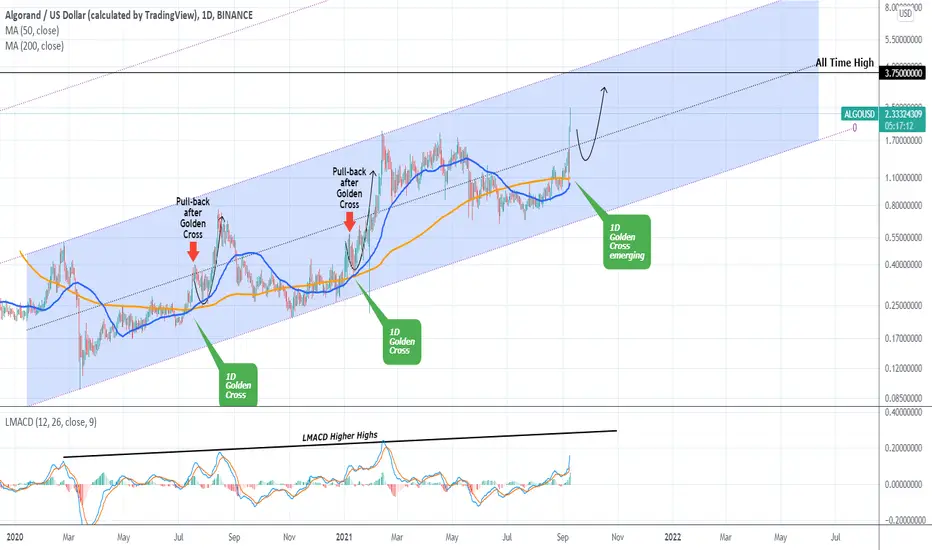
ALGOUSD on its way to the All Time HighPattern: Channel Up on 1D.
Signal: Buy on the next pull-back after the 1D Golden Cross gets formed. That has been the last buy signal in the two previous bullish legs to a Higher High.
Target: 3.7500 (the All Time High).
** Please support this idea with your likes and comments, it is the best way to keep it relevant and support me. **
--------------------------------------------------------------------------------------------------------
!! Donations via TradingView coins also help me a great deal at posting more free trading content and signals here !!
🎉 👍 Shout-out to TradingShot's 💰 top TradingView Coin donor 💰 this week ==> GJMRealEstate
--------------------------------------------------------------------------------------------------------