ALGOUSDT Break Downtrend – Reversal in Progress or Just a Retest📊 Technical Analysis Overview:
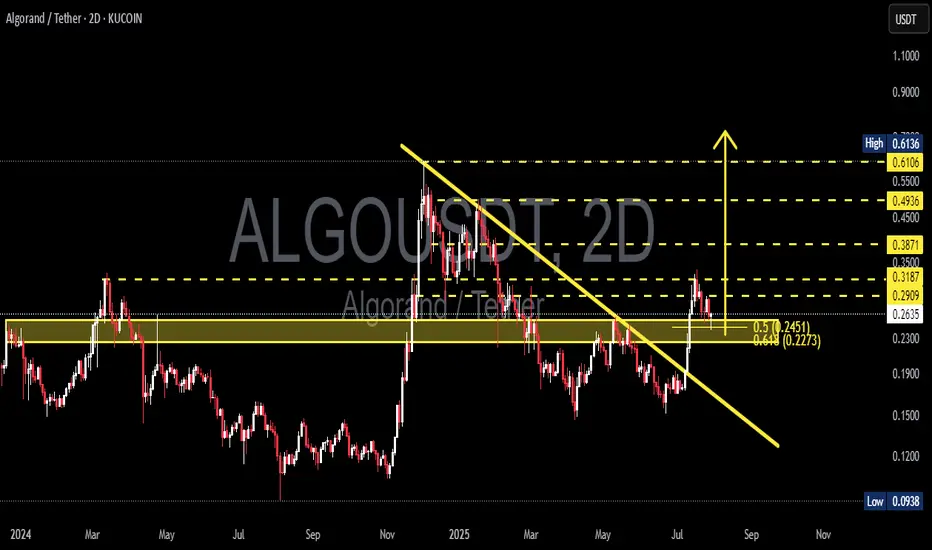
The Algorand (ALGO) / Tether (USDT) pair has shown a notable technical development by successfully breaking above a medium-term descending trendline that has acted as resistance since early 2025.
---
🔍 Pattern & Structure:
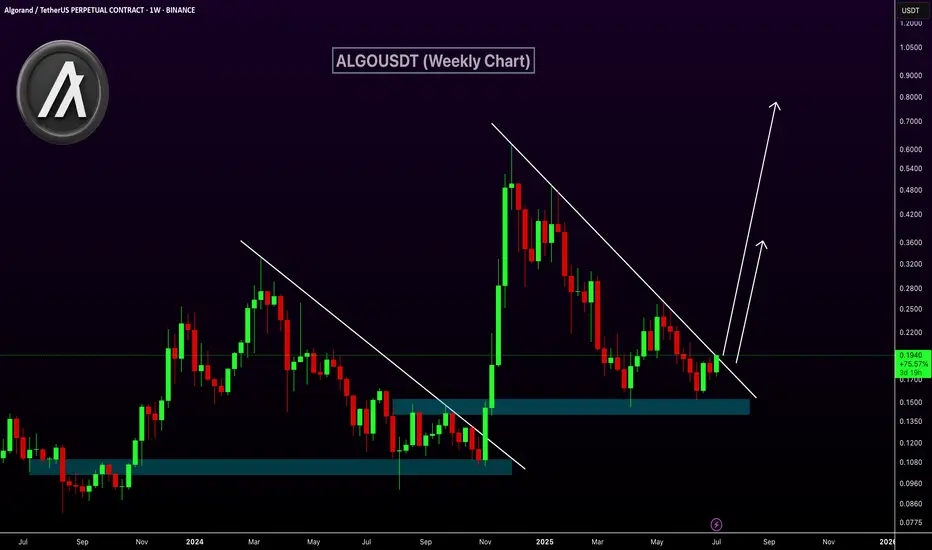
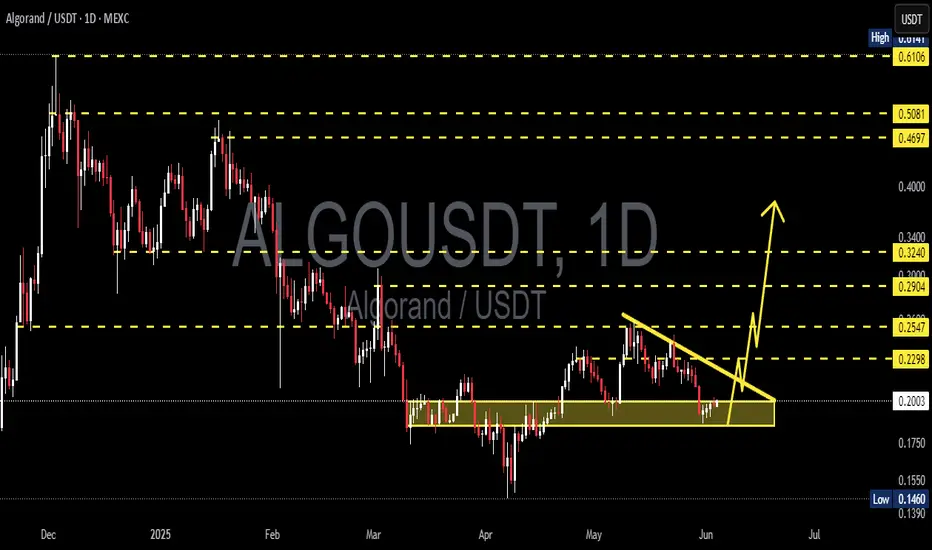
A clean breakout above the descending trendline (yellow sloped line) indicates a potential shift in trend from bearish to bullish.
Price is currently undergoing a retest of the breakout zone, aligning with the Fibonacci retracement levels 0.5 ($0.2451) and 0.618 ($0.2273).
The yellow horizontal zone ($0.25–$0.29) has been a significant support/resistance flip zone, showing strong historical reaction throughout 2024 and early 2025.
A higher high and higher low structure is starting to form — an early signal of a potential bullish reversal.
---
📈 Bullish Scenario:
If the price holds the support zone between $0.2451 and $0.2273, we could see a continuation of the upward move toward the following resistance levels:
$0.2909 (current minor resistance)
$0.3187
$0.3500
$0.3871
Mid-term targets: $0.4936 and $0.6106
A daily or 2D candle close above $0.3187 with strong volume would confirm a bullish continuation.
---
📉 Bearish Scenario:
On the other hand, failure to hold above the $0.2451–$0.2273 support zone could lead to a renewed bearish move with potential targets at:
$0.1900 (weekly historical support)
$0.1500
Extreme support: $0.0938 (2024 cycle low)
A break below $0.2273 would invalidate the breakout and may signal a bull trap.
---
📌 Summary:
ALGO is at a key inflection point. The current pullback could be a healthy correction after a breakout or a failed retest. Watch for price action and volume reaction near $0.2451–$0.2273 to confirm the next move.
#ALGO #Algorand #ALGOUSDT #CryptoAnalysis #TechnicalAnalysis #Breakout #BullishReversal #Fibonacci #SupportResistance #Altcoins #CryptoSetup #PriceAction
ALGOUSDTPERP
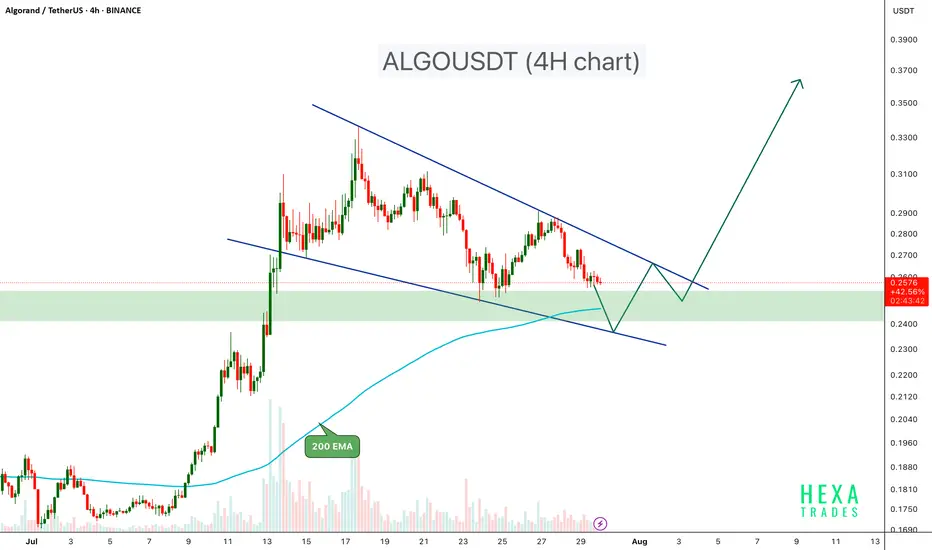
ALGOUSDT Forming Bullish Flag ALGOUSDT is currently trading inside a well-defined bullish Flag pattern on the 4-hour chart, a structure known for its bullish breakout potential. The price recently tested a significant demand zone, which previously acted as a base for a strong upward move earlier in July.
Key Points:
Bullish Flag Structure: Price is compressing within converging trendlines, forming lower highs and lower lows a classic bullish flag pattern.
Support Zone: The $0.24 – $0.255 area has acted as a strong demand zone, providing reliable support.
Bounce Potential: A bullish reaction from the lower flag boundary and demand zone could lead to a move toward the upper trendline and potentially trigger a breakout.
200 EMA Support: The 200 EMA is currently providing dynamic support, reinforcing the bullish setup.
Breakout Confirmation: A breakout above the flag resistance with strong volume could initiate a rally toward the $0.30 – $0.40 zone.
Cheers
Hexa
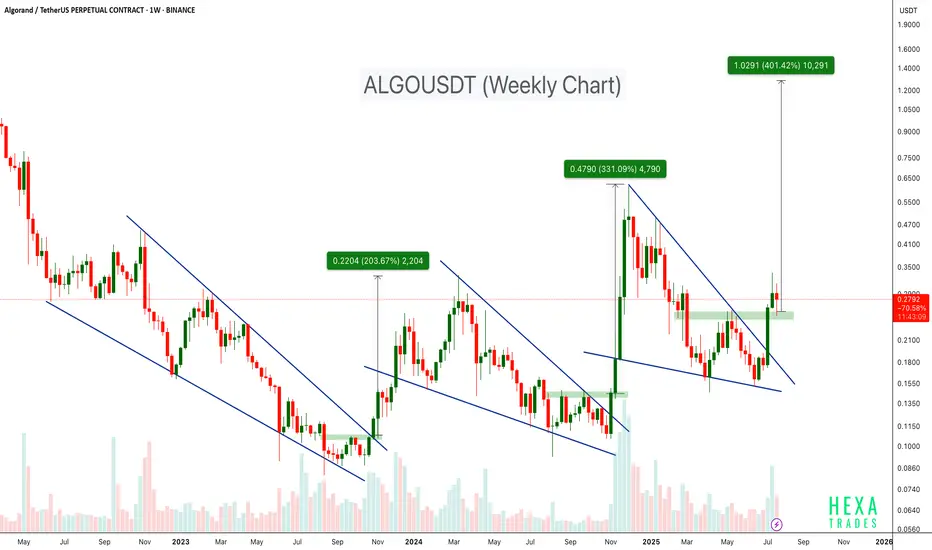
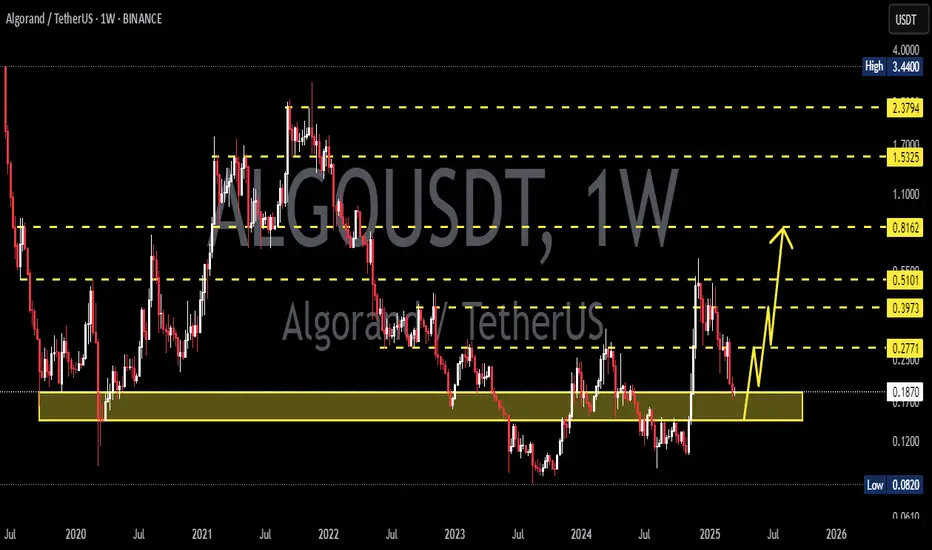
ALGO Breaks Out of Falling Wedge – 400% Target Ahead?BINANCE:ALGOUSDT has consistently followed a bullish pattern on the weekly timeframe. Each major rally has been preceded by a falling wedge breakout, as shown by the three highlighted instances on the chart.
- First breakout: ~200%+ move
- Second breakout: ~300%+ move
- Current breakout projection: Potential target up to +400%
The price has just broken above the wedge and is currently retesting the breakout zone. If history repeats itself, ALGO may be poised for a strong upside move from its current levels.
Cheers
Hexa🧘♀️
COINBASE:ALGOUSD EURONEXT:ALGO
ALGOUSDT Approaching Breakout!BINANCE:ALGOUSDT is showing a potential trend reversal after bouncing from a strong historical demand zone around $0.15. Price action is testing the descending trendline for a breakout, which could trigger a bullish continuation move. Similar to the previous breakout in late 2024, this setup hints at a possible repeat rally. A weekly close above the trendline would confirm strength, opening targets at $0.32 and $0.70+.
COINBASE:ALGOUSD
ALGOUSDT 1W AnalysisALGO ~ 1W Analysis
#ALGO Buy back gradually from here with a short-term target of at least 20%++.

ALGOUSDT 1D AnalysisALGO ~ 1D Analysis
#ALGO Buy back gradually from here with a short term target of at least 15%+ from here.
ALGOUSDT 1DALGO ~ 1D Analysis
#ALGO When this bullish pattern is successful, the sustainable increase may bring the price of this coin to increase at least 10%+ from here.

ALGOUSDT 1WALGO ~ 1W Analysis
#ALGO Buy from here if you still have a Conviction on this coin with a short -term target of at least 20%+.
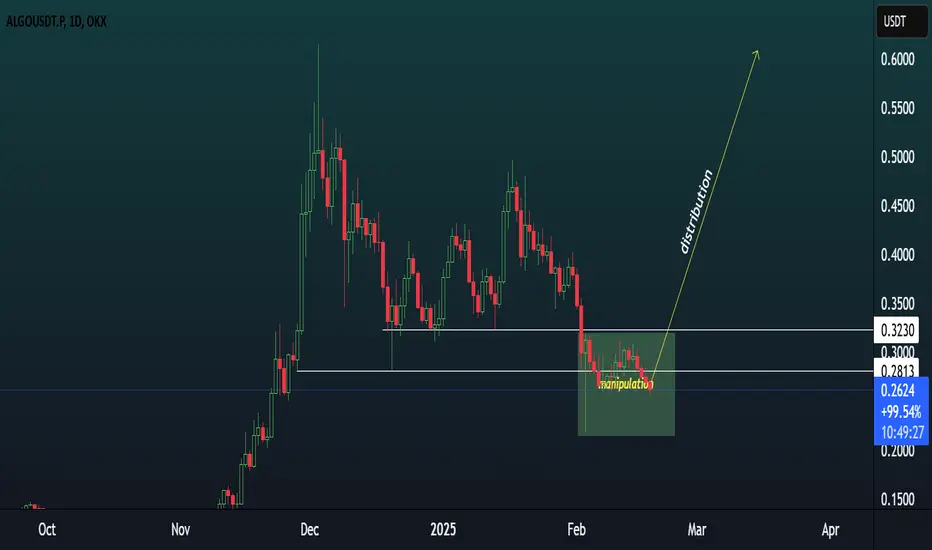
algo ready for distribution/pump.algousdt is in manipulation of po3 formation. Also their team is very active now a days and doing partnerships. which can also be a good factor to buy this.
ALGOUSDT 1WALGO ~ 1W Analysis
#ALGO If you still have a Conviction on this coin. Maybe this is very good support to start buying again from here.

Algorand middle term targetsAlgorand middle term targets BINANCE:ALGOUSDT
Possible Targets and explanation idea
➡️We already sweep covid historical march 2020 low
➡️On a W tf we can see money inflow based on my Money Power indicator
➡️Perfect scenario with test of Buy line of my Take Profit indicator
➡️Target will be break out of downtrend line and test with full fill around 0.53$ monthly FVG.
Hope you enjoyed the content I created, You can support with your likes and comments this idea so more people can watch!
✅Disclaimer: Please be aware of the risks involved in trading. This idea was made for educational purposes only not for financial Investment Purposes.
---
• Look at my ideas about interesting altcoins in the related section down below ↓
• For more ideas please hit "Like" and "Follow"!

ALGOUSDT %150 HUGE VOLUME SPIKE!Green Line and Blue Box: Excellent Buy Zones
Both the green line and the blue box are thoroughly analyzed and show tremendous potential.
Highlights:
Green Line: A critical support level—simple yet effective. Buyers are likely to step in here.
Blue Box: Carefully selected using the best tools: volume footprint, volume profile, CDV, and liquidity heatmap. It’s a high-probability zone.
Buyer Confirmation: Early signs of buyer activity make these levels even more compelling.
Key Observations:
"The blue box is very carefully picked using volume footprint, volume profile, cumulative delta volume, and liquidity heatmap. When trading this zone, I will look for buyers and upward market structure breaks in lower time frames for confirmation."
This setup looks promising, and I’m optimistic about its potential. Let’s watch for confirmation before acting! 🚀
Let me tell you, this is something special. These insights, these setups—they’re not just good; they’re game-changers. I've spent years refining my approach, and the results speak for themselves. People are always asking, "How do you spot these opportunities?" It’s simple: experience, clarity, and a focus on high-probability moves.
Want to know how I use heatmaps, cumulative volume delta, and volume footprint techniques to find demand zones with precision? I’m happy to share—just send me a message. No cost, no catch. I believe in helping people make smarter decisions.
Here are some of my recent analyses. Each one highlights key opportunities:
🚀 RENDERUSDT: Strategic Support Zones at the Blue Boxes +%45 Reaction
🎯 PUNDIXUSDT: Huge Opportunity | 250% Volume Spike - %60 Reaction Sniper Entry
🌐 CryptoMarkets TOTAL2: Support Zone
🚀 GMTUSDT: %35 FAST REJECTION FROM THE RED BOX
🎯 ZENUSDT.P: Patience & Profitability | %230 Reaction from the Sniper Entry
🎯 DEXEUSDT %180 Reaction with %9 Stop
🐶 DOGEUSDT.P: Next Move
🎨 RENDERUSDT.P: Opportunity of the Month
💎 ETHUSDT.P: Where to Retrace
🟢 BNBUSDT.P: Potential Surge
📊 BTC Dominance: Reaction Zone
🌊 WAVESUSDT.P: Demand Zone Potential
🟣 UNIUSDT.P: Long-Term Trade
🔵 XRPUSDT.P: Entry Zones
🔗 LINKUSDT.P: Follow The River
📈 BTCUSDT.P: Two Key Demand Zones
🟩 POLUSDT: Bullish Momentum
🌟 PENDLEUSDT.P: Where Opportunity Meets Precision
🔥 BTCUSDT.P: Liquidation of Highly Leveraged Longs
🌊 SOLUSDT.P: SOL's Dip - Your Opportunity
🐸 1000PEPEUSDT.P: Prime Bounce Zone Unlocked
🚀 ETHUSDT.P: Set to Explode - Don't Miss This Game Changer
🤖 IQUSDT: Smart Plan
⚡️ PONDUSDT: A Trade Not Taken Is Better Than a Losing One
💼 STMXUSDT: 2 Buying Areas
🐢 TURBOUSDT: Buy Zones and Buyer Presence
🌍 ICPUSDT.P: Massive Upside Potential | Check the Trade Update For Seeing Results
🟠 IDEXUSDT: Spot Buy Area | %26 Profit if You Trade with MSB
📌 USUALUSDT: Buyers Are Active + %70 Profit in Total
🌟 FORTHUSDT: Sniper Entry +%26 Reaction
🐳 QKCUSDT: Sniper Entry +%57 Reaction
📊 BTC.D: Retest of Key Area Highly Likely
This list? It’s just a small piece of what I’ve been working on. There’s so much more. Go check my profile, see the results for yourself. My goal is simple: provide value and help you win. If you’ve got questions, I’ve got answers. Let’s get to work!
ALGOUSDT 1WALGO Update ~ 1W
#ALGO So far it still maintains its bullish structure. This buy range is very wide, buy in stages with a minimum target of 20%+

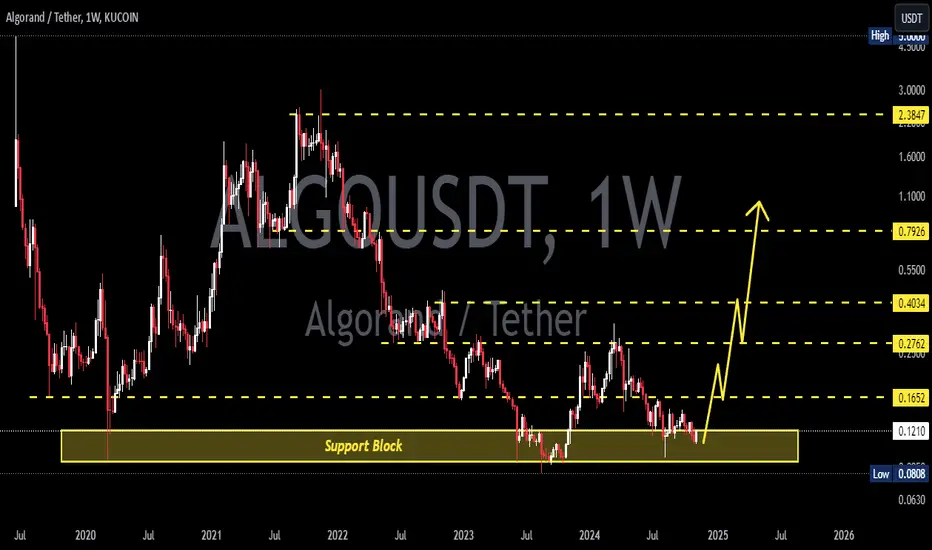
ALGOUSDTALGO ~ 1W
#ALGO If you still have Conviction on this coin,. This support block would be a very good buying place for now,. with a minimum target of 20%++
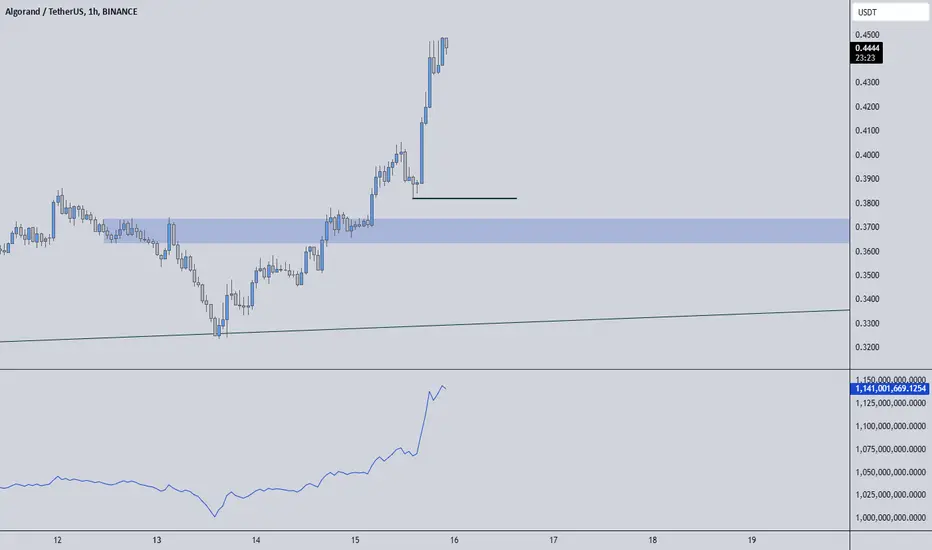
#ALGO/USDT#ALGO
The price is moving in a descending channel on the 1-hour frame and is sticking to it to a large extent and is expected to break it upwards
We have a bounce that was booked from the lower limit of the channel at a price of 0.1200
We have a downtrend on the RSI indicator which supports the rise
We have a trend to stabilize above the moving average 100
Entry price 0.1210
First target 0.1250
Second target 0.1300
Third target 0.1344

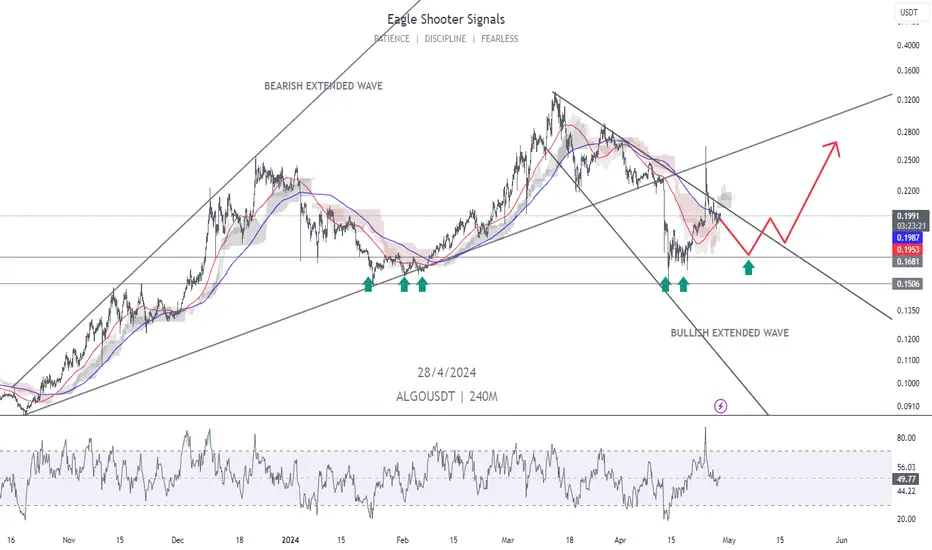
I'll let you know the direction of ALGO.Hello, my friends. Nice to meet you all
It's going from BEARISH EXTENDED WAVE to BULLISH EXTENDED WAVE.
We expect to break out the upper line of BULLISH WXTENDED WAVE with strong support from ZONE.
🚀💰 ALGOUSDT: 1 to 10 Trade Opportunity!Traders, get ready for a potential game-changer with ALGOUSDT! 🚀💰
🔍 Strong Support Zone:
We're eyeing a robust support zone where buyers are showing a strong reaction. It's highly probable that they'll step in again. Remember the last time? It sparked some impressive movement!
💡 Trade Strategy:
With the potential for a 1 to 10 trade, this setup could be a golden opportunity for profit! Keep a close watch on this support zone and be ready to seize the moment when the buyers make their move.
💬 Share Your Thoughts:
What's your take on this potential trade setup? Share your insights and let's discuss the possibilities together! Your input could be the key to unlocking this exciting opportunity!
💰 Unlock the Prize:
Remember, the best comment could unlock a special prize! So don't hold back—share your thoughts and join the conversation! 🏆💬

ALGO target 0.41D time frame
-
We are currently gaining almos 60% profit from ALGO since last entry on Jan 27, as below.
-
Furthermore, ALGO is breaking above the neckline of this potential head and shoulders structure, which means here is an opportunity to add positions or set up a new trading plan.
-
TP: 0.4 / 0.45
SL: 0.215

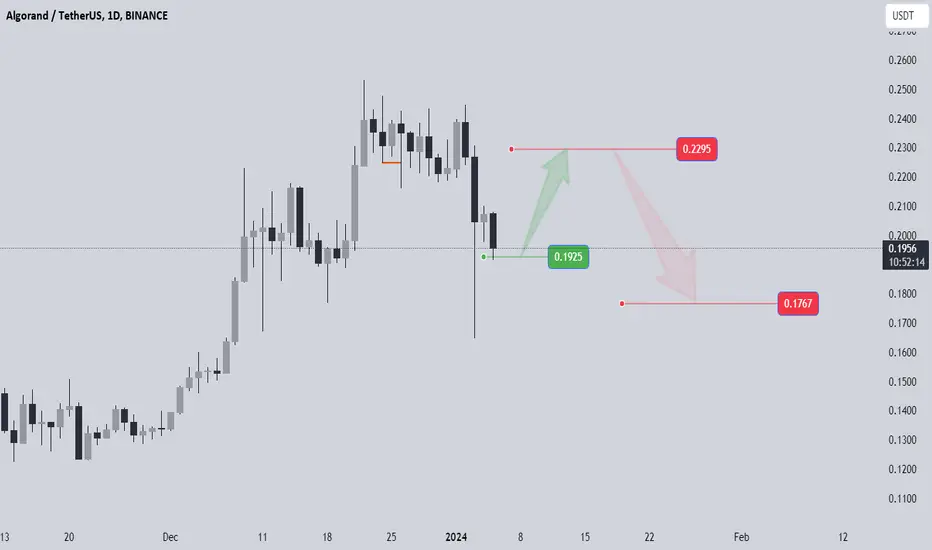
ALGO target 0.28 & 0.451D time frame
-
ALGO is retesting the structural support around 0.135~0.152, that is also the 0.618 Fibonacci Retracement, so here is a good timing to set up a perpetual trading plan with great RR. Also, we can easily see a strong support on higher time frame around 0.08~0.10, this zone is a sweet price to accumulate spot if ALGO come back again in future. Therefore, I provide two trading plans for perpetual and spot.
-
Perpetual:
TP: 0.28 / 0.44
SL: 0.135
Spot:
TP: 0.45 / 0.68
SL: 0.07

ALGOUSDTBINANCE:ALGOUSDT
⛔"Daily crypto market analyses I provide are personal opinions & not financial advice. Trading carries risks, so do your own research & seek advisor's help. #DYOR
Don't forget to 🚀 and comment
ALGOUSDTBINANCE:ALGOUSDT i think is ready for a huge move
⛔"Daily crypto market analyses I provide are personal opinions & not financial advice. Trading carries risks, so do your own research & seek advisor's help.#DYOR"
Don't forget to like and comment

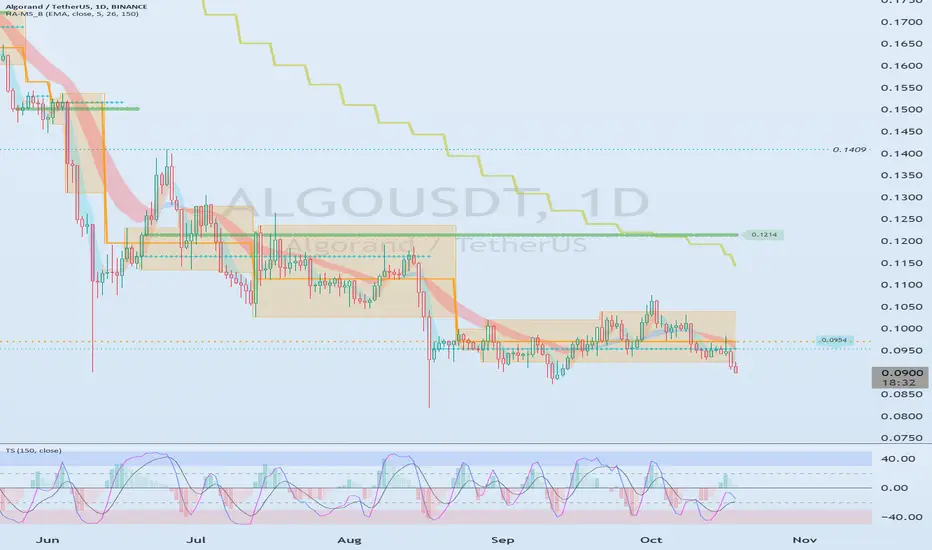
The key is whether it can rise above 0.1098Hello?
Hello traders!
If you "Follow" us, you can always get new information quickly.
Please also click “Boost”.
Have a good day.
-------------------------------------
(ALGOUSDT chart)
(1M charts)
The key is whether the price can be maintained by rising above 0.1098.
(1W chart)
Since the volume profile section spans 0.1881-0.4253, the key is whether it can rise beyond this section.
(1D chart)
A volume profile section is formed at 0.3091.
As it falls below the 0.0924-0.1039 range, the possibility of further decline is increasing.
Accordingly, the key is whether it can rise to the 0.0924-0.1039 range.
-------------------------------------------------- -------------------------------------------
** All explanations are for reference only and do not guarantee profit or loss in investment.
** Trading volume is displayed as a candle body based on 10EMA.
How to display (in order from darkest to darkest)
More than 3 times the trading volume of 10EMA > 2.5 times > 2.0 times > 1.25 times > Trading volume below 10EMA
** Even if you know other people’s know-how, it takes a considerable amount of time to make it your own.
** This chart was created using my know-how.
---------------------------------
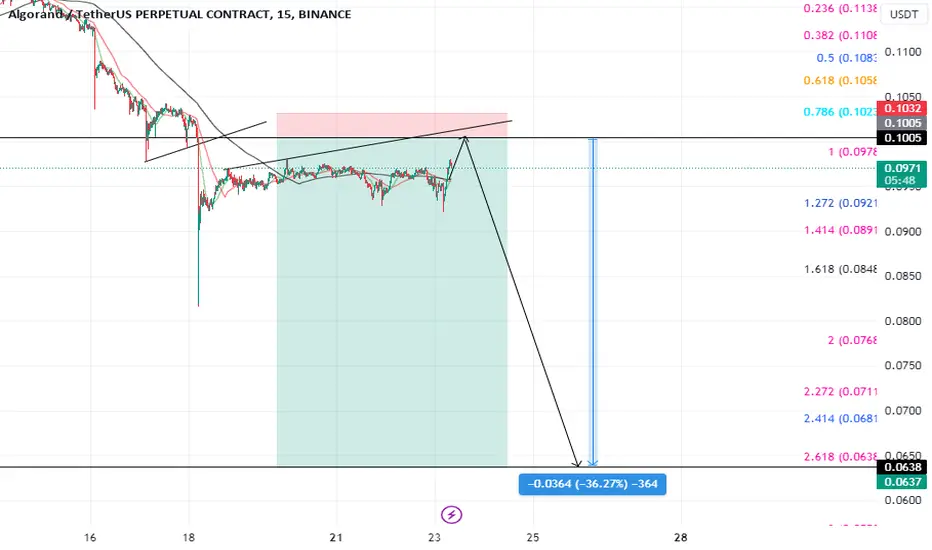
algo potensial shortalgo potensial break down again after failed close above 0.1031$
i think move to 0.0638$
short posision OP 0.1005
TP 0.0638$