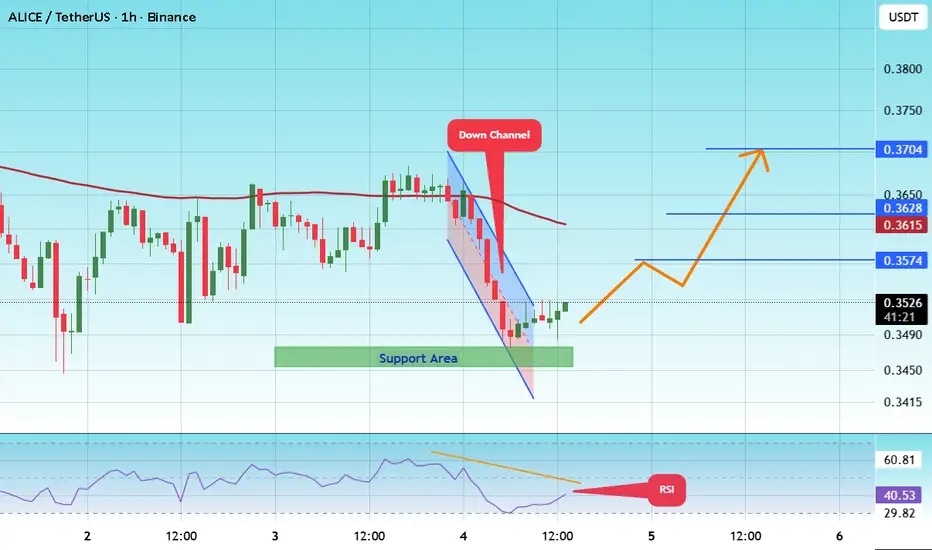
#ALICE/USDT — Descending Triangle at Demand Zone!#ALICE
The price is moving within a descending channel on the 1-hour frame and is expected to break and continue upward.
We have a trend to stabilize above the 100 moving average once again.
We have a downtrend on the RSI indicator that supports the upward move with a breakout.
We have a support area at the lower boundary of the channel at 0.3430, acting as strong support from which the price can rebound.
We have a major support area in green that pushed the price upward at 0.3470.
Entry price: 0.3520
First target: 0.3574
Second target: 0.3628
Third target: 0.3700
To manage risk, don't forget stop loss and capital management.
When you reach the first target, save some profits and then change the stop order to an entry order.
For inquiries, please comment.
Thank you.
Alicelong
ALICE/USDT — Descending Triangle at Demand Zone!ALICE/USDT has been trapped in a mid-term downtrend since early 2025, consistently forming lower highs along a descending trendline. Despite the bearish pressure, price has repeatedly defended the 0.34–0.39 demand zone (yellow box) since May, creating a strong support base.
This consolidation has now shaped a Descending Triangle — a high-tension pattern that often leads to explosive moves once price breaks out of its narrowing range.
📌 Why it matters?
Descending Triangle is statistically a bearish continuation pattern.
However, when price compresses to the tip of the triangle, the probability of a strong breakout in either direction rises sharply.
---
🔑 Key Levels
Critical Demand Zone: 0.39 – 0.34
Supports below: 0.3102 → 0.2900 → 0.2550
Resistance to watch: 0.4786 → 0.5672 → 0.6000 → 0.6481 → 0.7986 → 0.9721 → 1.3019 → 1.6257
---
📈 Bullish Scenario
A daily close above the descending trendline (~0.40–0.41) would signal breakout confirmation.
If confirmed with strong volume, upside targets may unfold:
🎯 Target 1: 0.4786
🎯 Target 2: 0.5672 – 0.6000
🎯 Target 3: 0.6481 – 0.7986
Breakout + Retest = high-probability setup for trend reversal in the short term.
---
📉 Bearish Scenario
A clean breakdown below 0.34 confirms the Descending Triangle as bearish continuation.
Potential downside targets:
🎯 Target 1: 0.3102
🎯 Target 2: 0.2900
🎯 Target 3: 0.2550 (major support)
As long as price remains capped under the descending trendline, sellers retain the upper hand.
---
⚖️ Conclusion
ALICE is at a major crossroads:
Holding above 0.34–0.39 and breaking the trendline could spark a recovery rally.
Losing the demand zone opens the door to deeper downside levels.
➡️ Wait for daily close confirmation before taking positions.
➡️ Manage risk carefully — Descending Triangle breakouts are usually followed by high volatility.
#ALICEUSDT #ALICE #CryptoAnalysis #DescendingTriangle #Altcoins #Breakout #Breakdown #CryptoTrading #SupportResistance #PriceAction
#ALICE/USDT Ready to go higher !#ALICE
The price is moving within an ascending channel on the 1-hour frame, adhering well to it, and is on track to break it strongly upwards and retest it.
We have support from the lower boundary of the ascending channel, at 3888.
We have a downtrend on the RSI indicator that is about to break and retest, supporting the upside.
There is a major support area in green at 0.3777, which represents a strong basis for the upside.
Don't forget a simple thing: ease and capital.
When you reach the first target, save some money and then change your stop-loss order to an entry order.
For inquiries, please leave a comment.
We have a trend to hold above the 100 Moving Average.
Entry price: 0.4250
First target: 0.4420
Second target: 0.4571
Third target: 0.4776
Don't forget a simple thing: ease and capital.
When you reach the first target, save some money and then change your stop-loss order to an entry order.
For inquiries, please leave a comment.
Thank you.
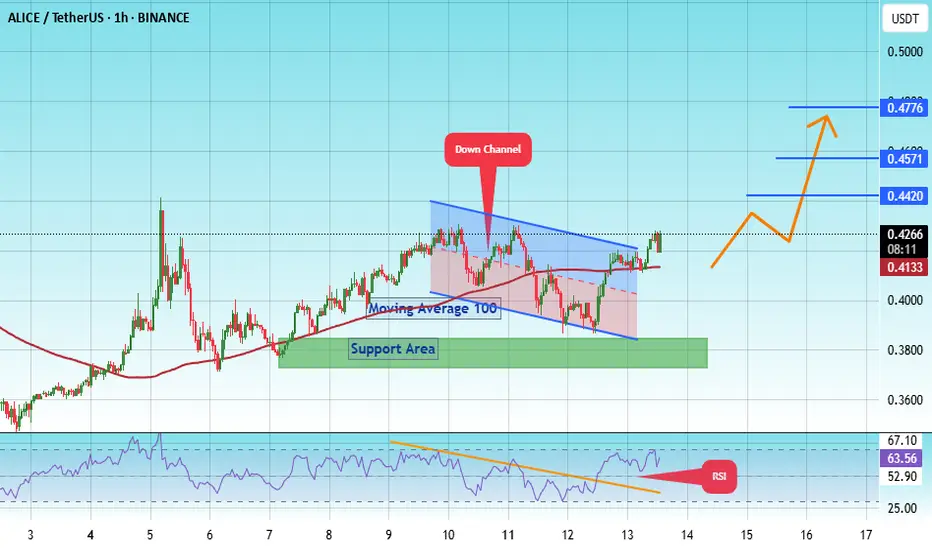
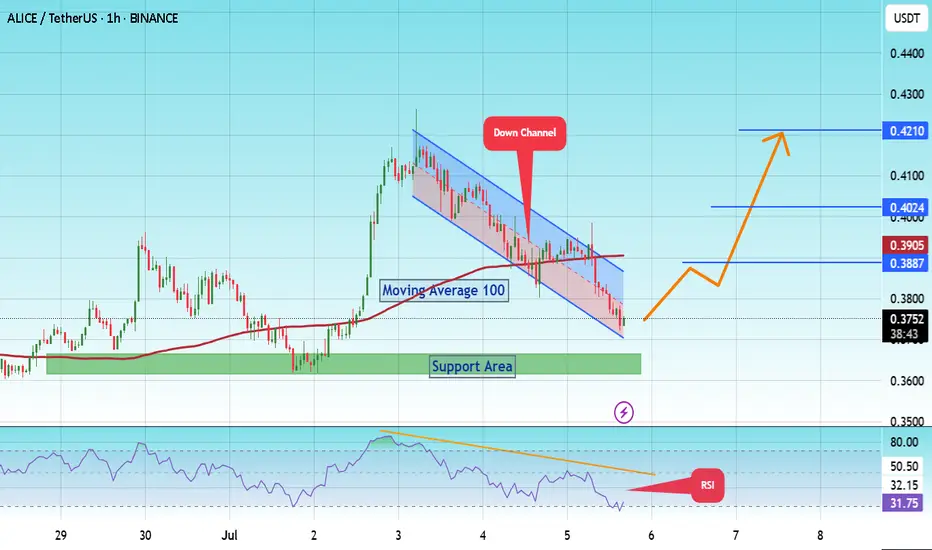
#ALICE/USDT Ready to go higher#ALICE
The price is moving within a descending channel on the 1-hour frame and is expected to break and continue upward.
We have a trend to stabilize above the 100 moving average once again.
We have a downtrend on the RSI indicator that supports the upward break.
We have a support area at the lower boundary of the channel at 0.3700, acting as strong support from which the price can rebound.
We have a major support area in green that pushed the price higher at 0.3632.
Entry price: 0.3753.
First target: 0.3887.
Second target: 0.4024.
Third target: 0.4210.
To manage risk, don't forget stop loss and capital management.
When you reach the first target, save some profits and then change the stop order to an entry order.
For inquiries, please comment.
Thank you.
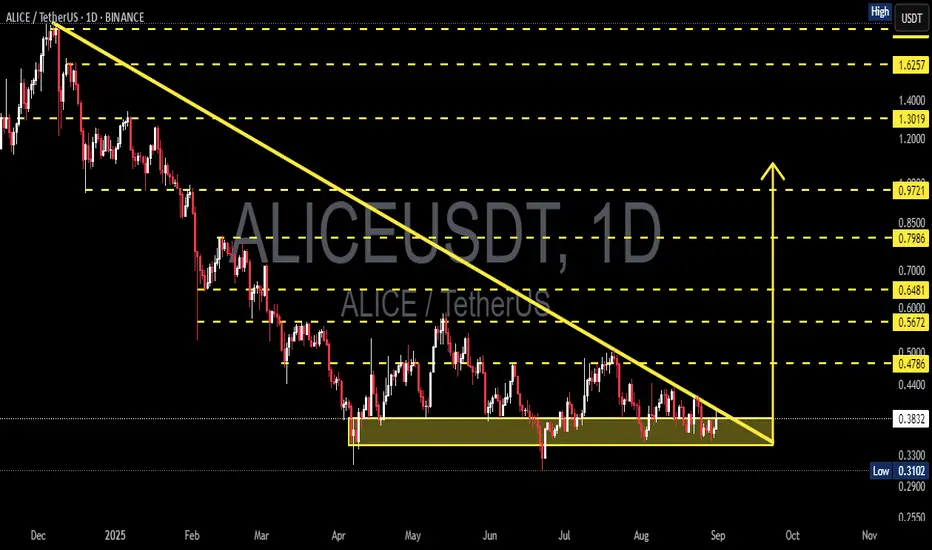
ALICE/USDT – Will It Rebound from Demand Zone or Break Down?🧭 Analysis Summary:
ALICE is at a critical turning point, once again testing a historical demand zone that has provided strong support since Q2 2025. The current price action suggests potential accumulation, setting the stage for a significant move — either a powerful bounce or a devastating breakdown.
---
📌 Chart Details (Daily Timeframe):
Main Trend: Still in a macro downtrend since December 2024
Current Price: $0.3714
Key Demand Zone: $0.35 – $0.41 (highlighted yellow box)
Nearest Supports: $0.35 → $0.3102 (2025 low)
Layered Resistance Levels: $0.4786 → $0.5672 → $0.6481 → $0.7986 → $0.9754
---
🧱 Market Structure & Patterns:
Price has been consolidating in a tight range over recent weeks — indicating possible accumulation or distribution.
The long-standing descending channel shows signs of exhaustion, with repeated rejections from the demand zone.
A small double bottom pattern appears to be forming, suggesting a possible reversal if validated.
---
📈 Bullish Scenario – Reversal Potential on Confirmation:
✅ If the price holds above $0.35 and forms a higher low, a trend reversal could take shape.
✅ A breakout above $0.41 would act as the first bullish confirmation.
🎯 Upside Targets:
$0.4786 → minor resistance, good for short-term swing trades
$0.5672 – $0.6481 → mid-range resistance & Fibonacci levels
$0.7986 – $0.9754 → longer-term recovery zone if sentiment improves
💡 Stronger confirmation would come from increasing volume and Daily RSI crossing above 50.
---
📉 Bearish Scenario – Breakdown and Trend Continuation:
❌ A breakdown below $0.35 would likely push price toward the $0.3102 support — the lowest level of the year.
❌ If $0.31 fails, further downside toward $0.25 or even $0.20 is possible, due to a lack of nearby historical support.
💀 This would confirm the continuation of the major downtrend, signaling sellers still have control.
---
📊 Market Sentiment:
On a broader scale, altcoins are still under pressure amid regulatory uncertainty and declining DeFi activity.
However, ALICE’s demand zone remains a high-interest area for traders seeking mid-term accumulation opportunities.
---
🎯 Strategy Ideas:
Strategy Type Action Key Levels
Buy on Breakout Enter on confirmed breakout > $0.41 Target: $0.48 – $0.64
Sell on Breakdown Short below $0.35 Target: $0.31 or lower
Range Trade Buy low, sell high between $0.35–$0.41 Tight stop-loss recommended
---
📝 Conclusion:
ALICE/USDT is at a technical and psychological crossroads. This yellow zone is where big moves often begin — the question is, will bulls take control or will bears pull it deeper? All eyes should be on how price reacts to this demand area.
#ALICEUSDT #CryptoTA #AltcoinAnalysis #DemandZone #BreakoutOrBreakdown #PriceAction #VolumeAnalysis #CryptoReversal #SwingTradeSetup #ALICEAnalysis #CryptoTrend

#ALICE/USDT#ALICE
The price is moving within a descending channel on the 1-hour frame, adhering well to it, and is on its way to breaking it strongly upwards and retesting it.
We are seeing a bounce from the lower boundary of the descending channel, which is support at 0.4560.
We have a downtrend on the RSI indicator that is about to break and retest, supporting the upward trend.
We are looking for stability above the 100 moving average.
Entry price: 0.4835
First target: 0.5028
Second target: 0.5263
Third target: 0.5533

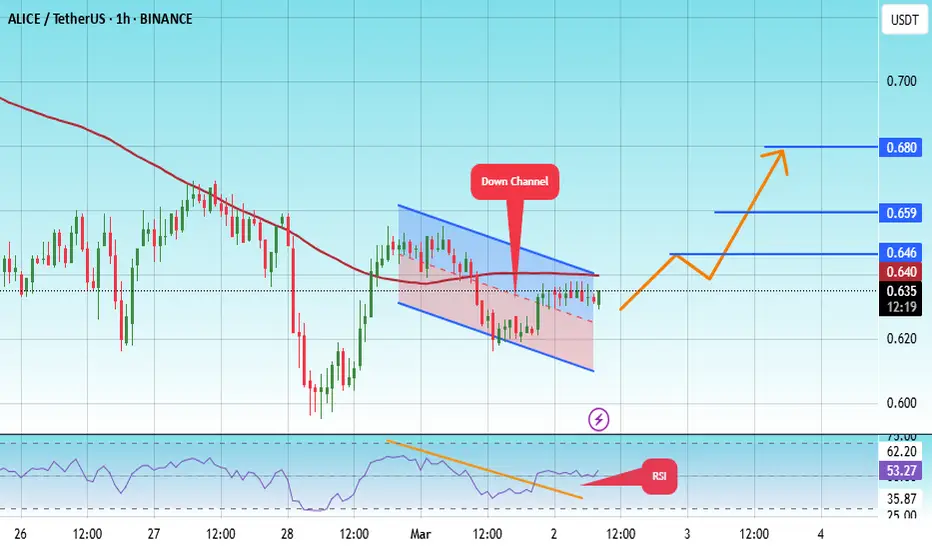
#ALICE/USDT#ALICE
The price is moving in a descending channel on the 1-hour frame and is adhering to it well and is heading to break it strongly upwards and retest it
We have a bounce from the lower limit of the descending channel, this support is at a price of 0.615
We have a downtrend on the RSI indicator that is about to break and retest, which supports the rise
We have a trend to stabilize above the moving average 100
Entry price 0635
First target 0.646
Second target 0.660
Third target 0.680
#ALICE/USDT Ready to go higher#ALICE
The price is moving in a descending channel on the 1-hour frame and sticking to it well
We have a bounce from the lower limit of the descending channel, this support is at 1.08
We have a downtrend on the RSI indicator that is about to break, which supports the rise
We have a trend to stabilize above the moving average 100
Entry price 1.18
First target 1.22
Second target 1.264
Third target 1.325

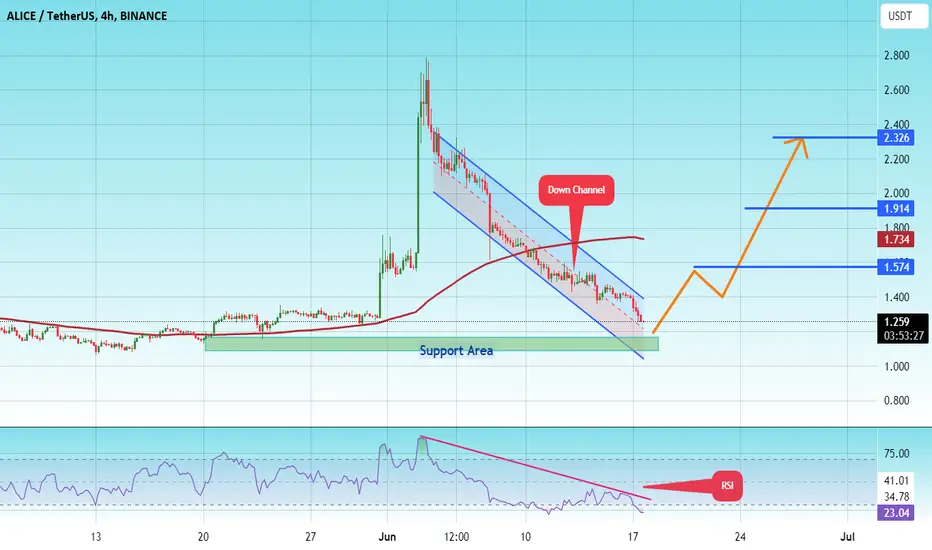
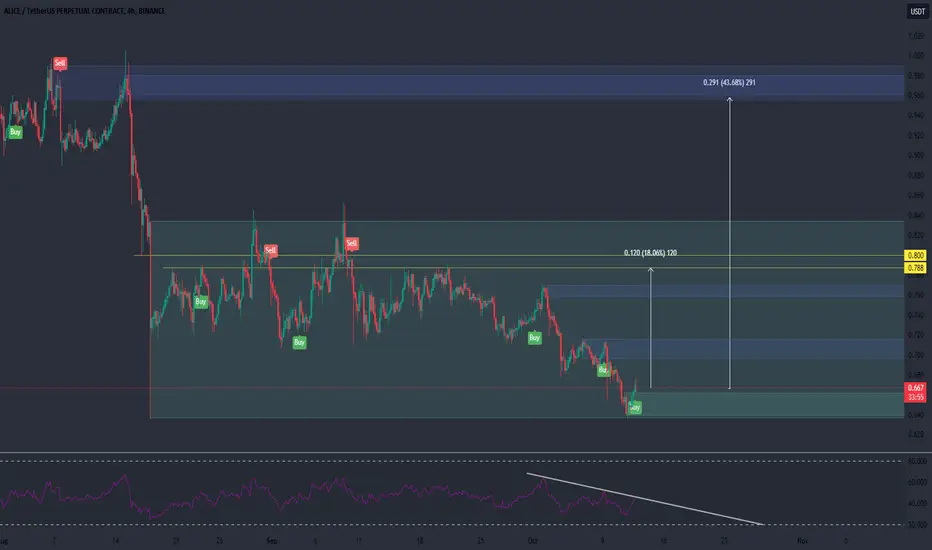
#ALICE/USDT#ALICE
The price is moving in a bearish channel on a 4-hour frame and is holding it strongly and is about to break it upward
We have a bounce from the green support area at 1.10
We have a tendency to stabilize above the Moving Average 100
We have a downtrend on the RSI indicator that is about to break higher and supports the rise
Entry price 1.26
The first goal is 1.57
Second goal 1.91
Third goal 2.32
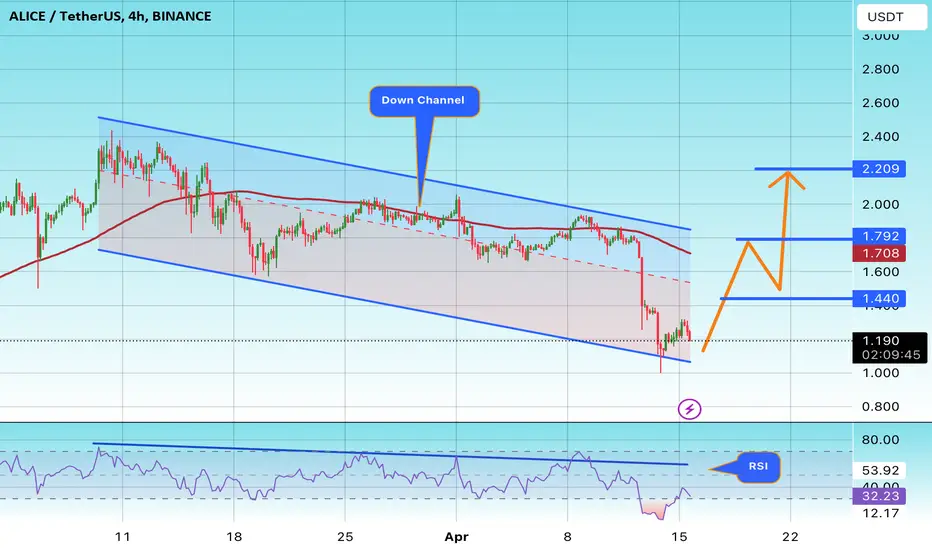
#ALICE/USDT#ALICE
We have a bearish channel on a 4-hour frame,
the price moves within it and adheres to its limits well
We have a major support area at Saad 1.0
We have a tendency to stabilize above moving average 100
We have a downtrend on the RSI indicator that has been broken to the upside
Entry price is 1.19
The first goal is 1.44
Second goal 1.79
Third goal 2.20
#ALICE/USDT#ALICE
The price has been moving in a bearish flag since April 2022
We are now on the verge of breaking that pattern by breaking the downtrend
Supported by oversold on MACD
Current price 1.030
First goal 1.18
Second goal 1.255
The rise will be supported by the break of Moving Average 100
You must pay attention to the correction points on the chart
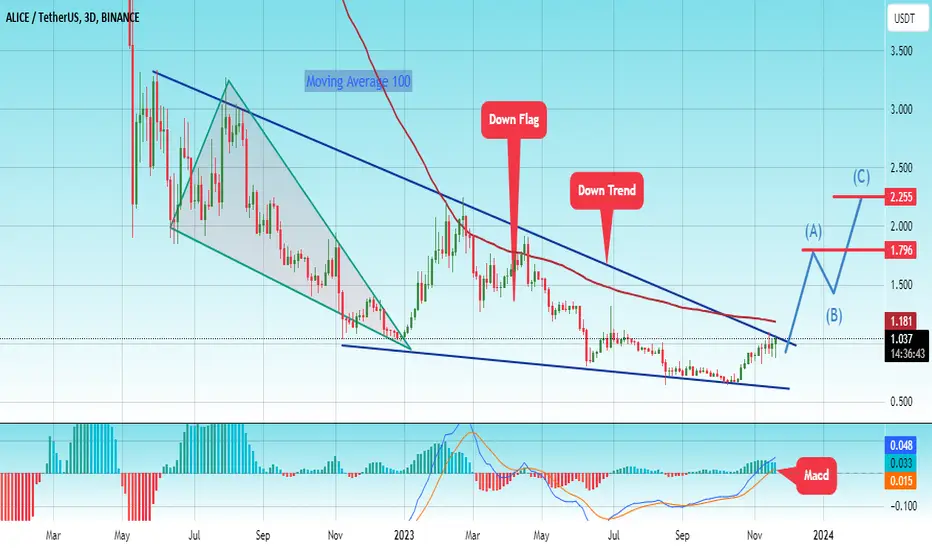
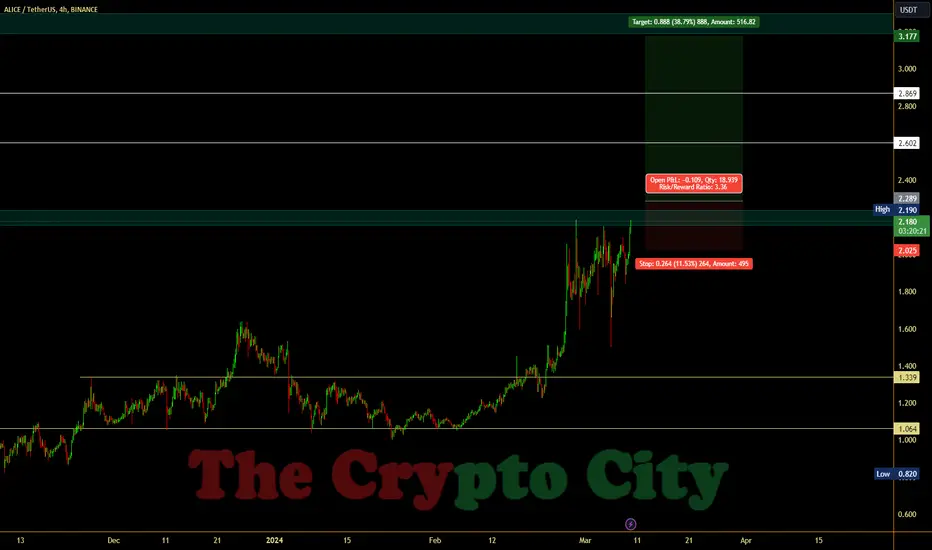
#ALICE/USDT LONG#ALICE
The price has been moving in a bearish flag since April 2022
This pattern was broken by breaking the downtrend
Supported by my sell saturation on the MACD on a daily frame
Current price 1.18
First goal 1.79
Second goal 2.25
The rise is supported by the moving average 100 break of
We have a lot of bullishness in Bitcoin

ALICE Price Update#ALICE Price Update: After a successful breakout from a zone marked in green, we will see massive gains. We could take entry after 4 hours candle close above the marked zone. Always use stop-loss. Everything is on the chart.
#Alice/Usdt
#Alice
The chart represents a bullish prediction for the ALICE cryptocurrency, indicating that it is preparing for a massive breakout and 2-3x price increase.
Once the descending channel is broken, we expect a strong bullish trend
With significant oversold support that supports the rise in the mid-term.

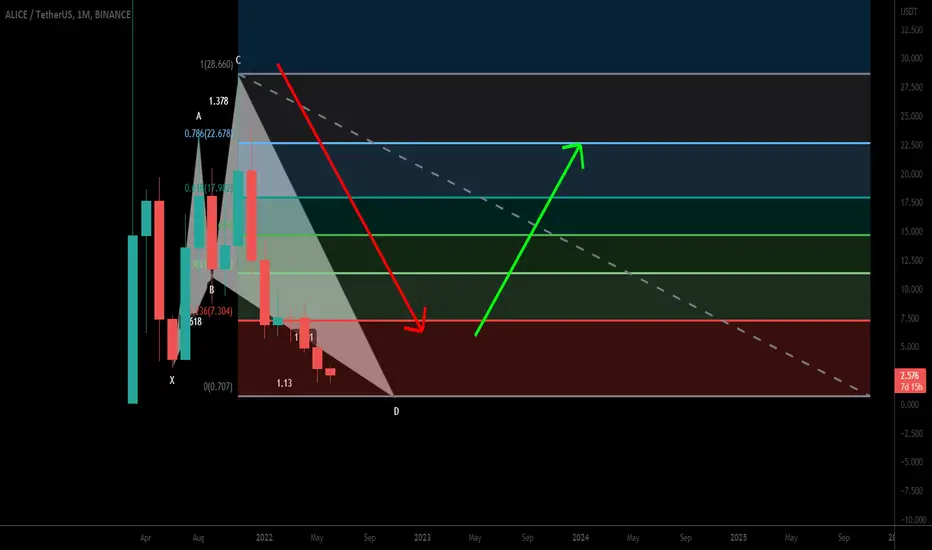
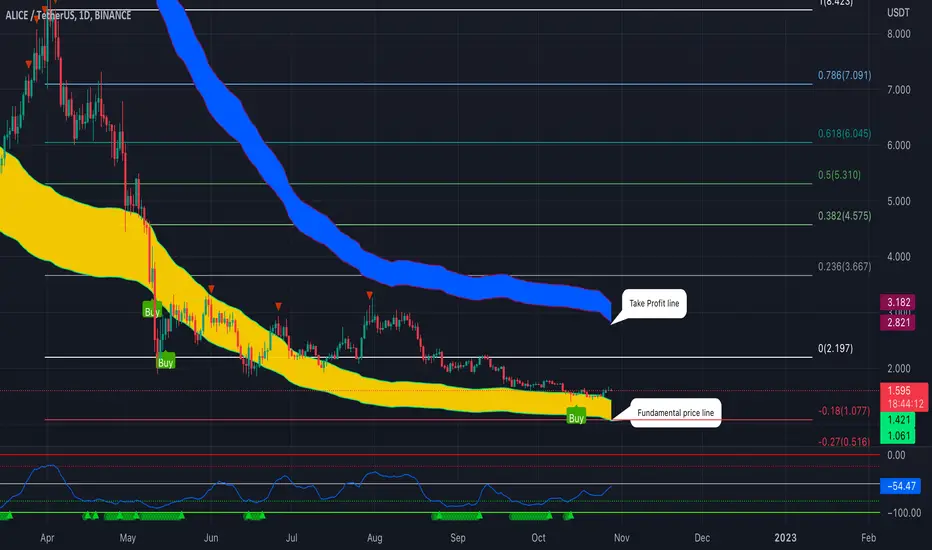
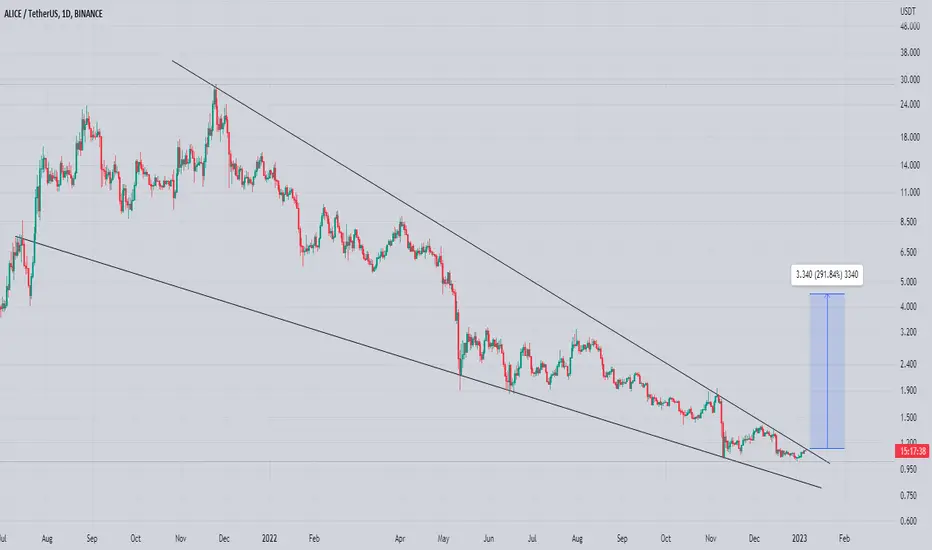
Alice to WonderLand or Dump?BINANCE:ALICEUSDT
✅Before we start to discuss, I would be glad if you share your opinion on this post's comment section and hit the like button if you enjoyed it.
Thank you.
Possible Targets and Explanation
➡️Fib since April 2022 drop. We probably can retest -0.18 Zones
➡️At this level now is fundamental value of Alice by "Take Profit" indicator last green line
➡️Every time when we touch this line or trade under than we can expect massive bounce
➡️Now we trade under 0 level and bounced from Buy line on "Take profit" indicator which is also good enter point
➡️Signal to Buy on "TradeON" indicator
➡️Take profit target for this trade will be at 2.82 and 3.18
➡️But this is dynamic metrics use stop loss even if you trade by limit orders.
Hope you enjoyed the content I created, You can support with your likes and comments this idea so more people can watch!
✅Disclaimer: Please be aware of the risks involved in trading. This idea was made for educational purposes only not for financial Investment Purposes.
* Look at my ideas about interesting altcoins in the related section down below ↓
* For more ideas please hit "Like" and "Follow"!

Alice Forming Falling Wedge In Daily Timeframe
Incase Of Breakout Expecting Massive Bounce ( Entry Will Be Only Valid After Breakout)
Safest Stoploss Would Be Last Swing Low Or Below WEdge
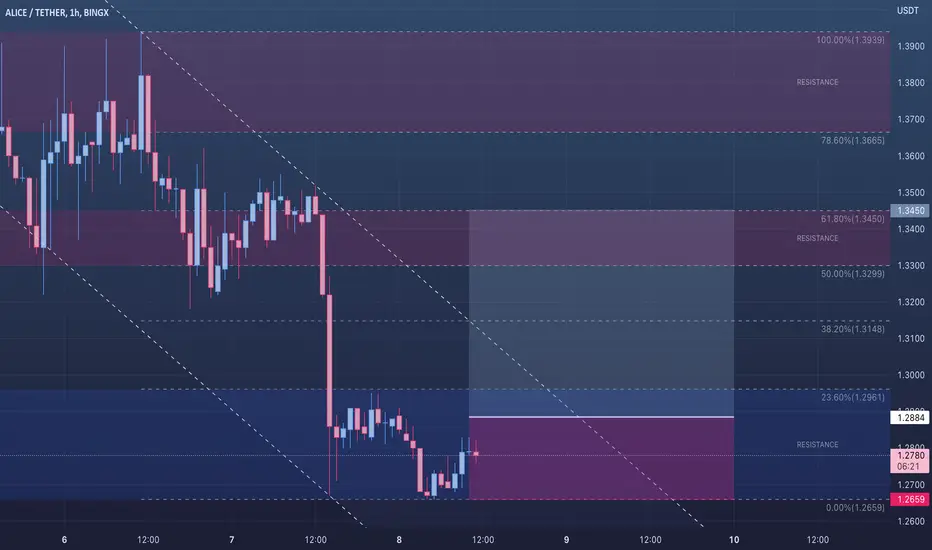
🟢 ALICEUSDT -1H (08/12/2022)🟢 ALICEUSDT
TF: 1H
Side: Long
SL: 10%
TP 1: $1.2961
TP 2: $1.3148
TP 3: $1.3299
ALICE looks like it is getting to move.
Bullish divergence and an FVG to fill.
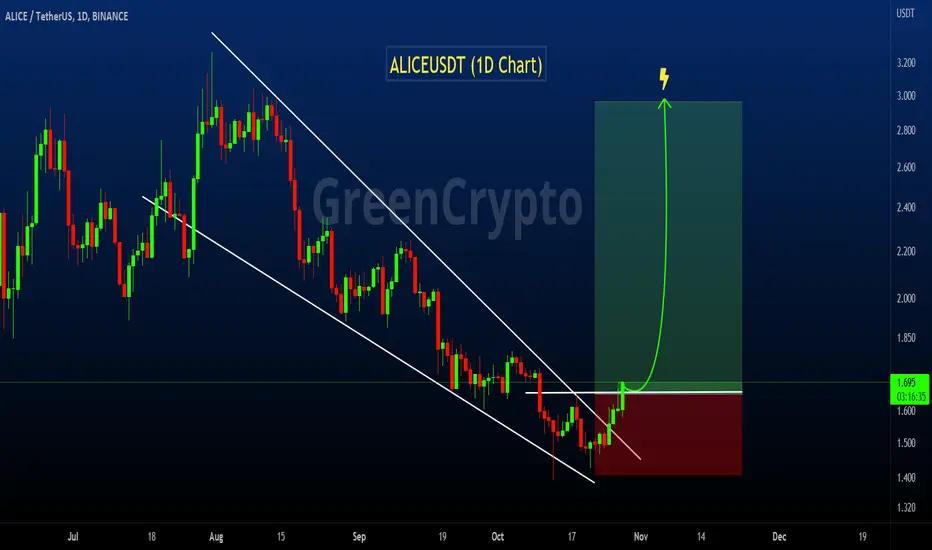
ALICEUSDT - Falling Wedge Pattern!!ALICEUSDT (1D Chart) Technical analysis
ALICEUSDT (1D Chart) Currently trading at $1.67
Buy level: Above $1.65
Stop loss: Below $1.37
TP1:$1.80
TP2: $2.2
TP3: $2.5
TP4: $2.9
Max Leverage 2x
Always keep Stop loss
Follow Our Tradingview Account for More Technical Analysis Updates, | Like, Share and Comment Your thoughts
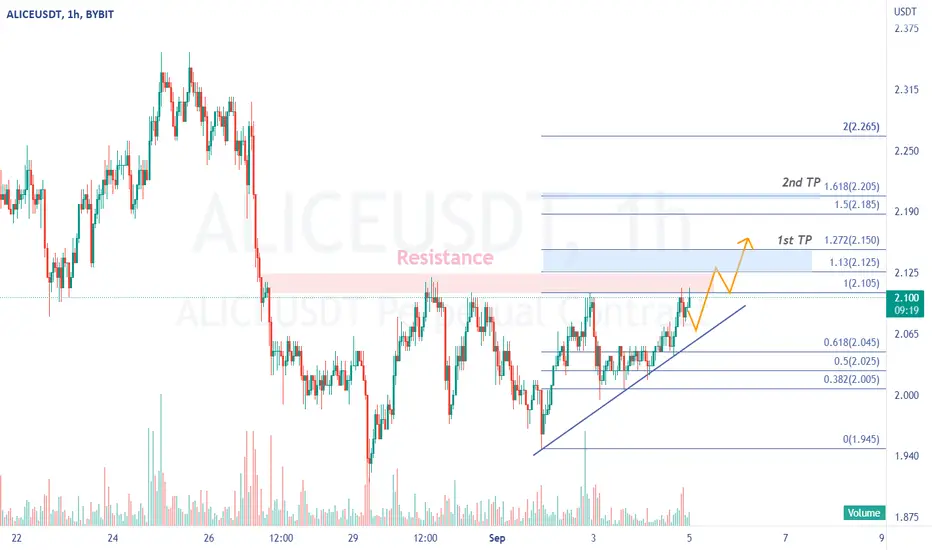
ALICE - Buying SignalBYBIT:ALICEUSDT
1H time frame
-
ALICE is breaking out the resistance zone currently.
If this candle can close above 2.105, we can open long here and aim to 2.125, 2.150, 2.205
Stop loss if this is a false BO.
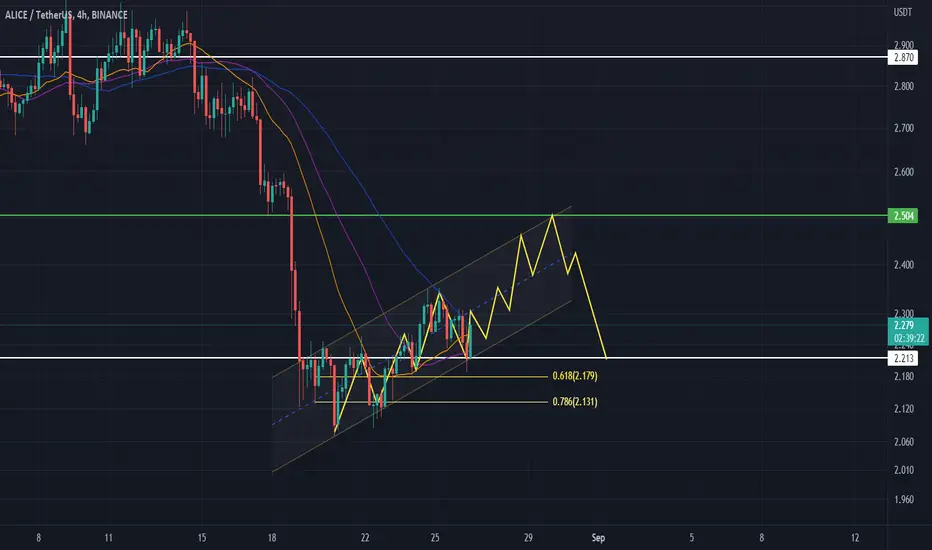
$ALICE LONG for Short-term!!! We all know, alice doing some event, LAND SALE for Alice Project. Until end of August. Maybe the team have a surprize. Consider Long for this moment.
as long as alice still maintaince their movement at aschending channel it will be great for a little rally.
SL : under 2.1 or 2.050
TP : 2.4-2.5 something.
u can use TP with ur risk too.. Don't forget to use small leverage :) don't greedy and plesae reanalyze again. Cheers guys
MyNeighborAlice (ALICE) formed bullish Shark for upto 4575% pumpHi dear friends, hope you are well and welcome to the new trade setup of MyNeighborAlice (ALICE) token.
On a monthly time frame, Alice has formed a bullish Shark pattern:
Note: Above idea is for educational purpose only. It is advised to diversify and strictly follow the stop loss, and don't get stuck with trade.