ALICE/USDT — Descending Triangle at Demand Zone!ALICE/USDT has been trapped in a mid-term downtrend since early 2025, consistently forming lower highs along a descending trendline. Despite the bearish pressure, price has repeatedly defended the 0.34–0.39 demand zone (yellow box) since May, creating a strong support base.
This consolidation has now shaped a Descending Triangle — a high-tension pattern that often leads to explosive moves once price breaks out of its narrowing range.
📌 Why it matters?
Descending Triangle is statistically a bearish continuation pattern.
However, when price compresses to the tip of the triangle, the probability of a strong breakout in either direction rises sharply.
---
🔑 Key Levels
Critical Demand Zone: 0.39 – 0.34
Supports below: 0.3102 → 0.2900 → 0.2550
Resistance to watch: 0.4786 → 0.5672 → 0.6000 → 0.6481 → 0.7986 → 0.9721 → 1.3019 → 1.6257
---
📈 Bullish Scenario
A daily close above the descending trendline (~0.40–0.41) would signal breakout confirmation.
If confirmed with strong volume, upside targets may unfold:
🎯 Target 1: 0.4786
🎯 Target 2: 0.5672 – 0.6000
🎯 Target 3: 0.6481 – 0.7986
Breakout + Retest = high-probability setup for trend reversal in the short term.
---
📉 Bearish Scenario
A clean breakdown below 0.34 confirms the Descending Triangle as bearish continuation.
Potential downside targets:
🎯 Target 1: 0.3102
🎯 Target 2: 0.2900
🎯 Target 3: 0.2550 (major support)
As long as price remains capped under the descending trendline, sellers retain the upper hand.
---
⚖️ Conclusion
ALICE is at a major crossroads:
Holding above 0.34–0.39 and breaking the trendline could spark a recovery rally.
Losing the demand zone opens the door to deeper downside levels.
➡️ Wait for daily close confirmation before taking positions.
➡️ Manage risk carefully — Descending Triangle breakouts are usually followed by high volatility.
#ALICEUSDT #ALICE #CryptoAnalysis #DescendingTriangle #Altcoins #Breakout #Breakdown #CryptoTrading #SupportResistance #PriceAction
Aliceusdtanalysis
ALICE/USDT – Will It Rebound from Demand Zone or Break Down?🧭 Analysis Summary:
ALICE is at a critical turning point, once again testing a historical demand zone that has provided strong support since Q2 2025. The current price action suggests potential accumulation, setting the stage for a significant move — either a powerful bounce or a devastating breakdown.
---
📌 Chart Details (Daily Timeframe):
Main Trend: Still in a macro downtrend since December 2024
Current Price: $0.3714
Key Demand Zone: $0.35 – $0.41 (highlighted yellow box)
Nearest Supports: $0.35 → $0.3102 (2025 low)
Layered Resistance Levels: $0.4786 → $0.5672 → $0.6481 → $0.7986 → $0.9754
---
🧱 Market Structure & Patterns:
Price has been consolidating in a tight range over recent weeks — indicating possible accumulation or distribution.
The long-standing descending channel shows signs of exhaustion, with repeated rejections from the demand zone.
A small double bottom pattern appears to be forming, suggesting a possible reversal if validated.
---
📈 Bullish Scenario – Reversal Potential on Confirmation:
✅ If the price holds above $0.35 and forms a higher low, a trend reversal could take shape.
✅ A breakout above $0.41 would act as the first bullish confirmation.
🎯 Upside Targets:
$0.4786 → minor resistance, good for short-term swing trades
$0.5672 – $0.6481 → mid-range resistance & Fibonacci levels
$0.7986 – $0.9754 → longer-term recovery zone if sentiment improves
💡 Stronger confirmation would come from increasing volume and Daily RSI crossing above 50.
---
📉 Bearish Scenario – Breakdown and Trend Continuation:
❌ A breakdown below $0.35 would likely push price toward the $0.3102 support — the lowest level of the year.
❌ If $0.31 fails, further downside toward $0.25 or even $0.20 is possible, due to a lack of nearby historical support.
💀 This would confirm the continuation of the major downtrend, signaling sellers still have control.
---
📊 Market Sentiment:
On a broader scale, altcoins are still under pressure amid regulatory uncertainty and declining DeFi activity.
However, ALICE’s demand zone remains a high-interest area for traders seeking mid-term accumulation opportunities.
---
🎯 Strategy Ideas:
Strategy Type Action Key Levels
Buy on Breakout Enter on confirmed breakout > $0.41 Target: $0.48 – $0.64
Sell on Breakdown Short below $0.35 Target: $0.31 or lower
Range Trade Buy low, sell high between $0.35–$0.41 Tight stop-loss recommended
---
📝 Conclusion:
ALICE/USDT is at a technical and psychological crossroads. This yellow zone is where big moves often begin — the question is, will bulls take control or will bears pull it deeper? All eyes should be on how price reacts to this demand area.
#ALICEUSDT #CryptoTA #AltcoinAnalysis #DemandZone #BreakoutOrBreakdown #PriceAction #VolumeAnalysis #CryptoReversal #SwingTradeSetup #ALICEAnalysis #CryptoTrend

ALICEUSDT: Massive Trendline Breakout + Fibonacci Confluence🔍 Overview:
After months of relentless selling pressure, ALICE has finally broken out of a long-term downtrend that began back in late 2024. But this isn’t just any breakout—it's a strong technical signal pointing toward a potential shift from accumulation to expansion, and possibly a major bullish run.
📌 Key Technical Highlights:
✅ 1. Long-Term Downtrend Breakout:
The descending trendline that has acted as resistance since November 2024 has now been cleanly broken, indicating a reversal in trend and the start of a potential new bullish cycle.
✅ 2. Bullish Accumulation Box (April – July):
ALICE formed a solid horizontal accumulation range between $0.385 and $0.42 for more than three months. A breakout from this range is often the trigger for an impulsive rally.
✅ 3. Golden Pocket Fibonacci Retest:
Price has recently bounced precisely from the 0.5 (0.4088) and 0.618 (0.3855) Fibonacci retracement levels, also known as the “golden pocket”—a high-probability bounce zone favored by smart money.
✅ 4. Clean Fibonacci-Based Targets:
Future resistance levels are well-defined by historical supply zones and Fibonacci extensions—offering a structured pathway for swing trade setups.
🧠 Market Psychology Right Now:
Retail traders are still hesitant after a prolonged downtrend (reduced FOMO = smart entry zone).
Smart money likely completed accumulation within the yellow box range.
This type of breakout often triggers "delayed FOMO" once initial resistances start getting taken out.
📈 Bullish Scenario (High Probability):
As long as ALICE holds above the breakout support at $0.408–$0.42:
🚀 Target 1: $0.5672
🚀 Target 2: $0.6481
🚀 Target 3: $0.7986
🎯 Main Target: $0.9754 (potential 100%+ upside from breakout box)
📉 Bearish Scenario (If Breakout Fails):
If price drops below $0.385:
⛔ It could re-enter the boring sideways range
⛔ Loss of bullish momentum
⛔ Potential retest of $0.31 (previous cycle low)
🟠 This would signal a false breakout — although this scenario currently seems less likely due to strong breakout structure.
🔎 Additional Confirmations:
✅ Breakout volume higher than average
✅ Formation of Higher Highs and Higher Lows
✅ Daily close above both trendline and accumulation box
🧭 Trading Strategy Idea:
Ideal Entry: Pullback to $0.408–$0.42
Stop Loss: Below $0.385
Targets: Use Fibonacci levels for gradual take-profits
Risk/Reward: Setup offers 3:1 or better R/R
✍️ Final Thoughts:
> “The longer the base, the stronger the breakout.”
ALICE has built a solid foundation over several months and now shows all the right signs of a textbook bullish breakout. With a clean structure, Fibonacci alignment, and growing momentum—this setup should be on every swing trader’s radar.
#ALICEUSDT #TrendlineBreakout #FibonacciConfluence #CryptoSetup #AltcoinWatch #BreakoutTrading #TechnicalAnalysis #SwingTradeCrypto #VolumeBreakout

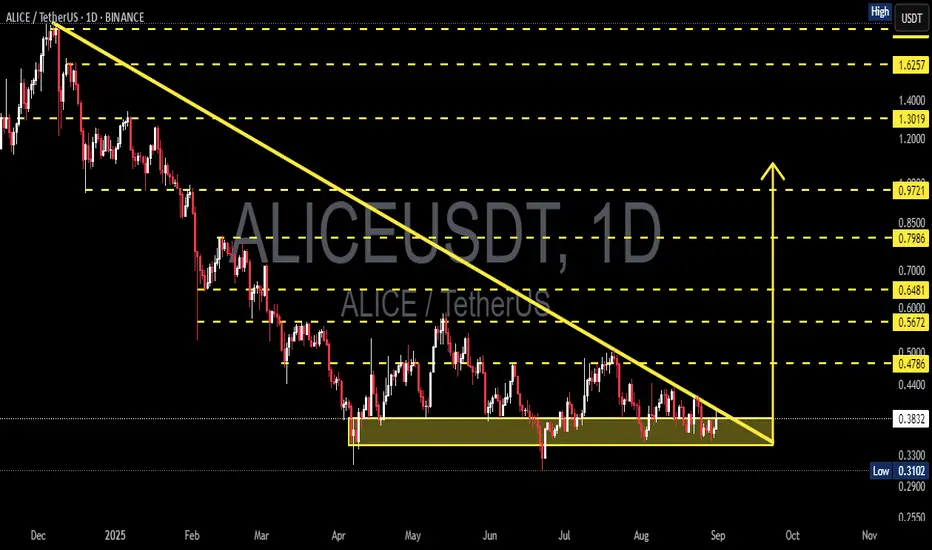
ALICEUSDT 1D AnalysisALICE ~ 1D Analysis
#ALICE Currently it comes out of this declining zone. Maybe this support block you can consider to start buying back from here with a short -term target of at least 10%+.

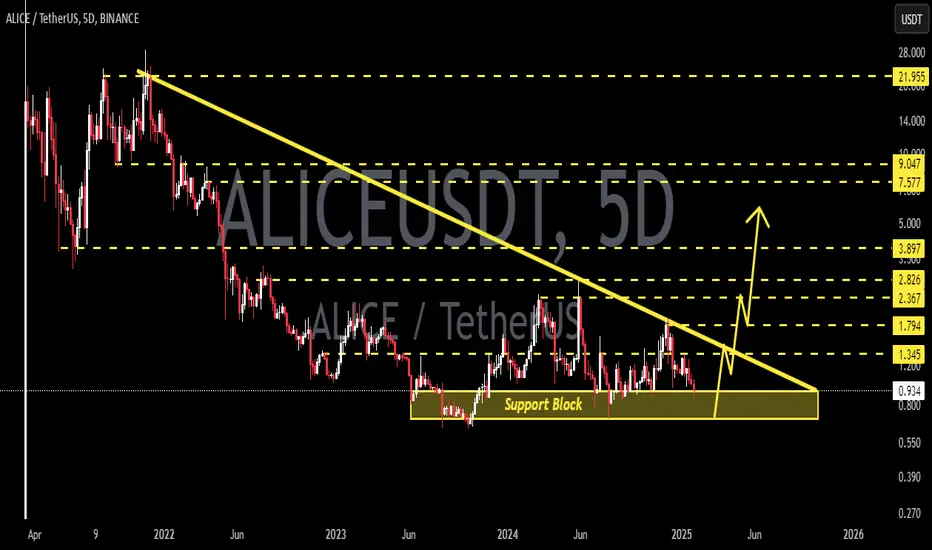
ALICEUSDT 5DALICE ~ 5D Analysis
#ALICE Test this support block. Buy from here if you still have a Conviction on this coin with a minimum target of 20%+.
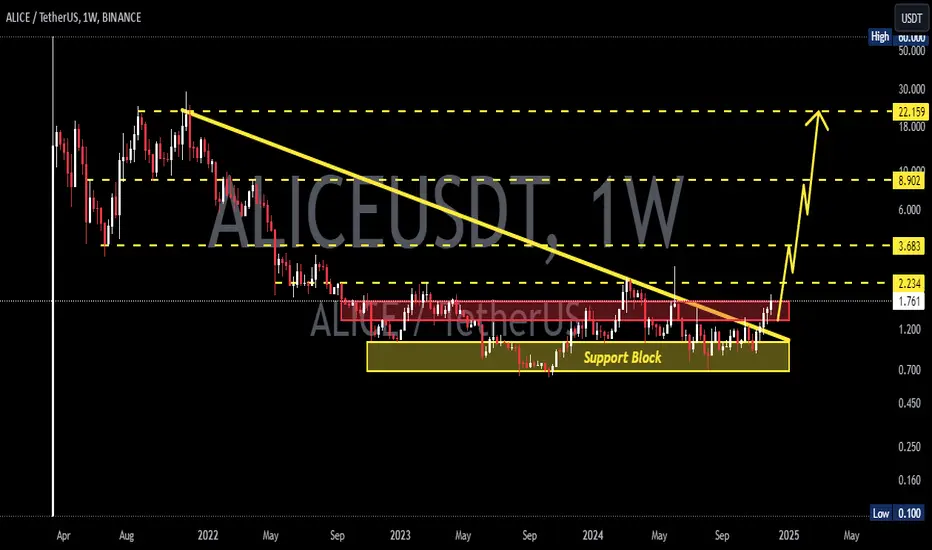
ALICEUSDT 1WALICE ~ 1W
#ALICE This is an important support block on this coin. If you still have Conviction on this coin,. This support block would be a very good buying place for now. Buy gradually within this support block.

ALICEUSDT 1WALICE ~ 1W
#ALICE If you still have Conviction on this coin. Buy in increments within this block. The downtrend on this coin has ended. bulls will dominate from here. Minimum target 20%+
ALICEUSD 1WALICE ~ 1W 📈
#ALICE Make purchases gradually from here, with a long-term target of at least 20%++ 📈
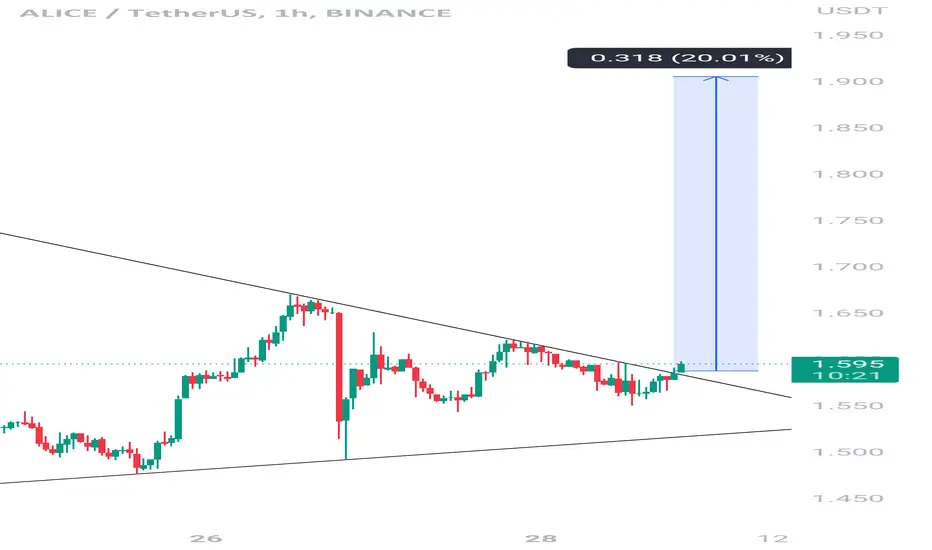
Alice/usdt Short Term Aliceusdt
Breaking Out Trendline resistance on hourly time frame
Short Term - Expecting 20-30% Bullish Move
Note :Risk Management Must & Do Your Own Research Before Entering Any Trade
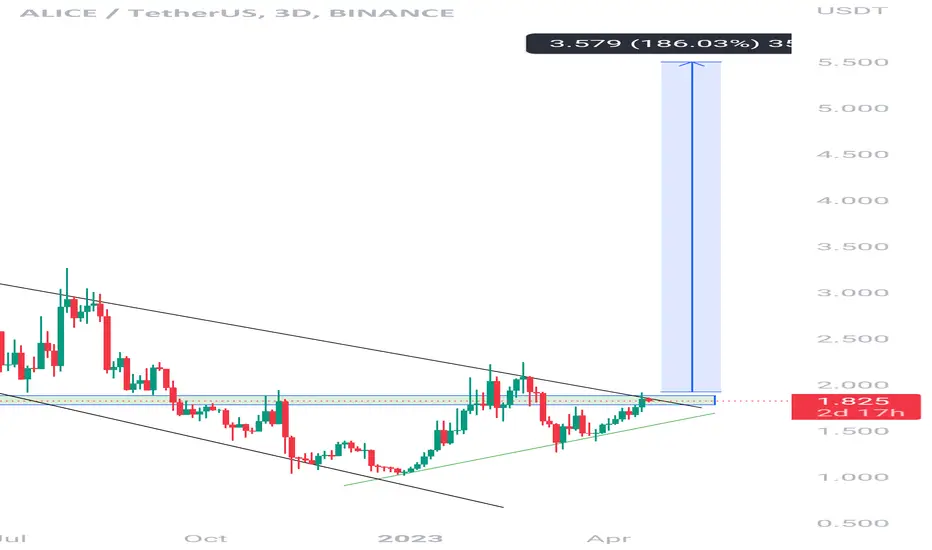
Alice/usdt Getting Ready For Breakout Aliceusdt
Alice/USDT appears to be gearing up for a breakout. If the breakout is successful, we could see a bullish move of 150-250% in the mid-term.
[ALTCOIN]ALICEUSDT TREND LINE ANALYSISHello, everyone
We're a team that specializes in chart analysis
We will always analyze and provide you with charts to help you sell
There are so many trading laws and there are so many good technologies that come with them, but I'm confident that the trend line is really strong.
If you read the point of view and get to know the line, every line will adjust
Thank you.
------------------------------------------------------------------------------------------------
Chart Analysis Content -
#ALICEUSDT Trend Line Analysis
It is rebounding from the deep sky blue downward trend line and rising along the red upward trend line, but meeting the blue sharp upward trend line and rising at an angle.
It fell from the thick red upward trend and went down the sky blue downward trend, but now it has to turn upward and move back up to the thick upward trend.

ALICEUSDT Analysis (LOCAL VISION)Hello friends.
Please support my work by clicking the LIKE button👍(If you liked). Also i will appreciate for ur activity. Thank you!
Everything on the chart.
recently i've mistake in markup, this is correct, so far we are going at least to retest 10$,
for further growth we need to break through 12$, if we break through then it will be possible to buy on corrections with higher targets.
Entry: market and lower
Target: 8.5 and 9.9
after first target reached move ur stop to breakeven
Stop: (depending of ur risk). ALWAYS follow ur RM .
risk is justified
Good luck everyone!
Follow me on TRADINGView, if you don't want to miss my next analysis or signals.
It's not financial advice.
Dont Forget, always make your own research before to trade my ideas!
Open to any questions and suggestions.

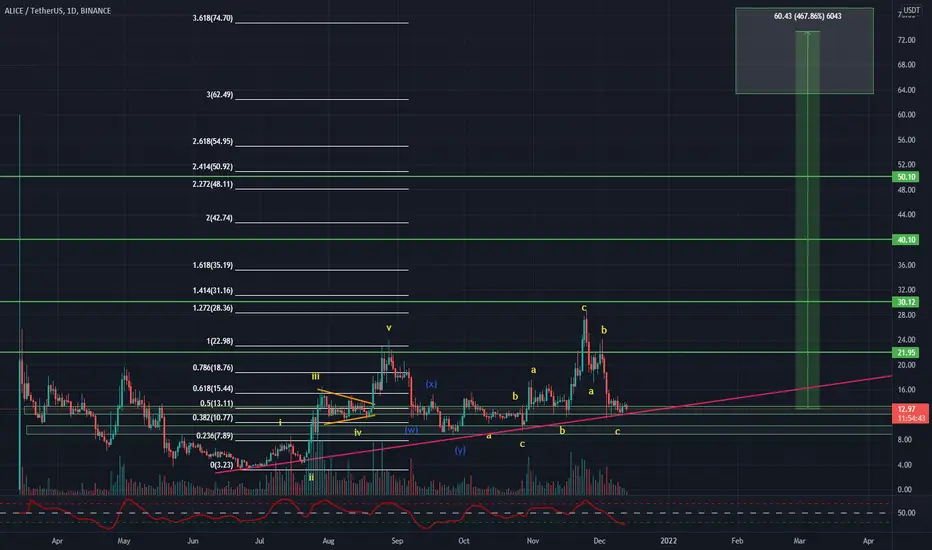
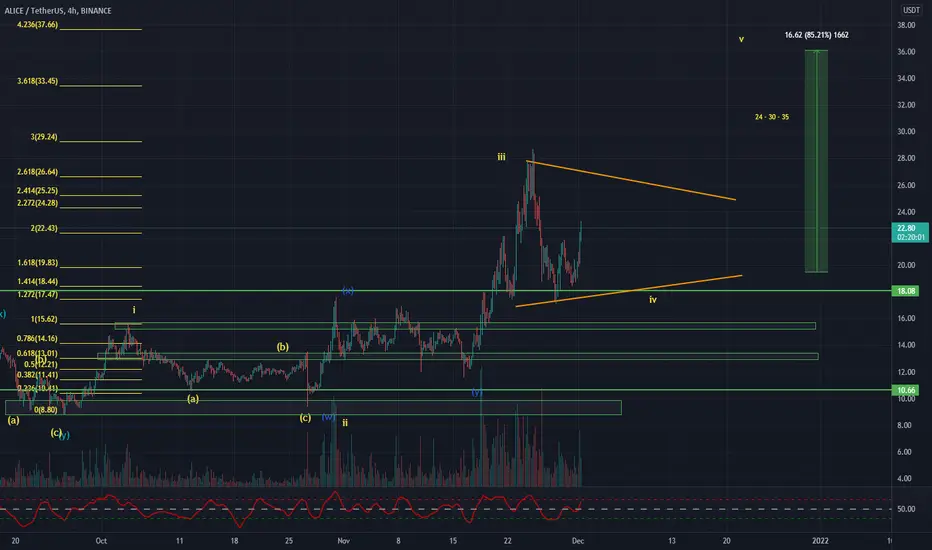
ALICEUSDT WAVE ANALYSIS (GLOBAL VISION)Hello friends.
Please support my work by clicking the LIKE button👍(If you liked). Also i will appreciate for ur activity. Thank you!
Everything on the chart.
We fell a little bit lower than I expected earlier, but the targets from above are relevant.
Entry: market and lower
Target: 15 - 22 - 35
after first target reached move ur stop to breakeven
Stop: (depending of ur risk). ALWAYS follow ur RM.
cancellation of growth consolidation below 3.5
Risk/reward: 1 to 10
risk is justified
Good luck everyone!
Follow me on TRADINGView, if you don't want to miss my next analysis or signals.
It's not financial advice.
Dont Forget, always make your own research before to trade my ideas!
Open to any questions and suggestions.

ALICEUSDT LONGTERM VISION (STRONG BUY)Hello friends.
Please support my work by clicking the LIKE button(If you liked).Thank you!
Everything on the chart.
We are stay on strong horizontal support,
We are above MA200 on 1D TF,
We are above trendline,
We are above horizontal volume on 1D TF,
RSX 1D TF on the bottom,
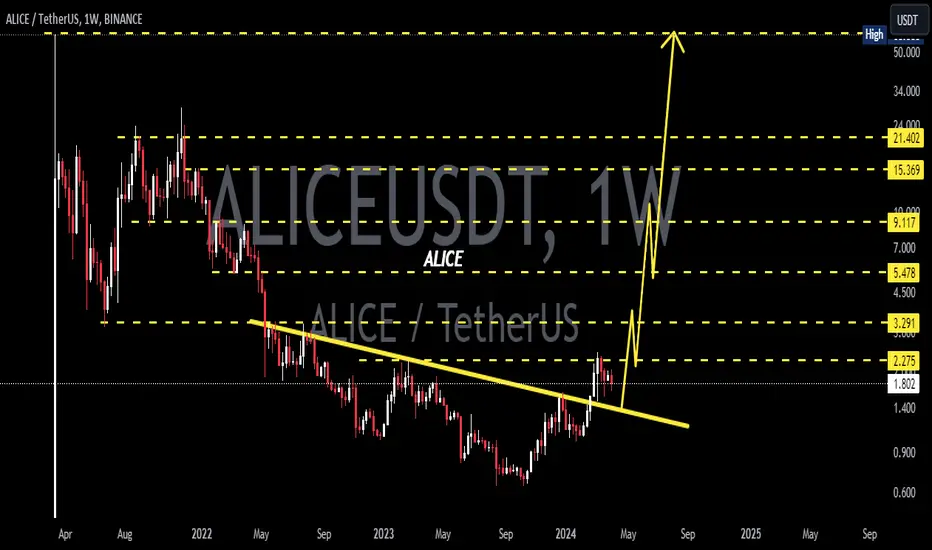
Also from 3$ to 23$ was impulse(5waves), after impulse should be atleast one more impulse, so in the worst case, we will see at least $ 35. At best, with a strong bull run, $ 65-75 looks quite real.
buy zone: 11-13$
midterm targets: 24 - 30 - 35$
longterm targets: 35 - 55 - (65-75$ zone)
after first target reached move ur stop to breakeven
cancellation of growth, consolidation below ~7.5-8$
stop: im w/o stop (depending of ur risk). ALWAYS follow ur RM .
risk is justified
Good luck everyone!
Follow me on TRADINGView, if you don't want to miss my next analysis or signals.
It's not financial advice.
Dont Forget, always make your own research before to trade my ideas!
ALICEUSDT AnalysisHello friends.
Please support my work by clicking the LIKE button(If you liked).Thank you!
Everything on the chart.
open pos: market and lower
target: 25 - 30 - 35
after first target reached move ur stop to breakeven
stop: (depending of ur risk). ALWAYS follow ur RM .
risk is justified
Good luck everyone!
Follow me on TRADINGView, if you don't want to miss my next analysis or signals.
It's not financial advice.
Dont Forget, always make your own research before to trade my ideas!
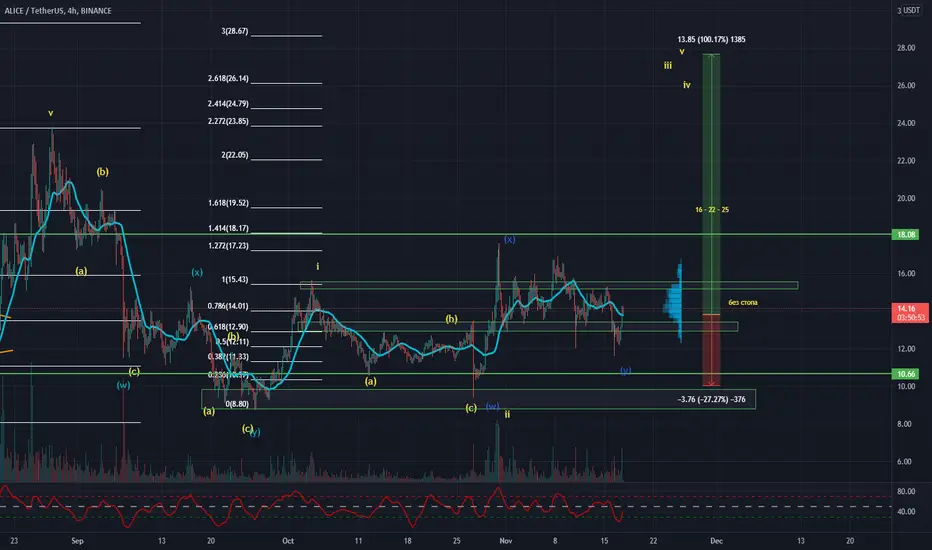
ALICEUSDT AnalysisHello friends.
Please support my work by clicking the LIKE button(If you liked).Thank you!
Everything on the chart.
open pos: market and lower
target: 16 - 22 - 25
after first target reached move ur stop to breakeven
stop: under 10 (depending of ur risk). ALWAYS follow ur RM .
risk/reward 1 to 4
risk is justified
Good luck everyone!
Follow me on TRADINGView, if you don't want to miss my next analysis or signals.
It's not financial advice.
Dont Forget, always make your own research before to trade my ideas!
Open to your questions or suggestions.
ALICEUSDT , It can break resistance because ...Hello everyone
One the new project in metavers base is ALICE
Their team is working nice and have many good fundamental news and many event new month
This event and news can rise the price and can break the resistance zone toward the price and can reach to the target that we shown on chart
Maybe we have some correction but the important thing is it can break the resistance
Dont forget use stop loss and observe money management
Good Luck
Abtin

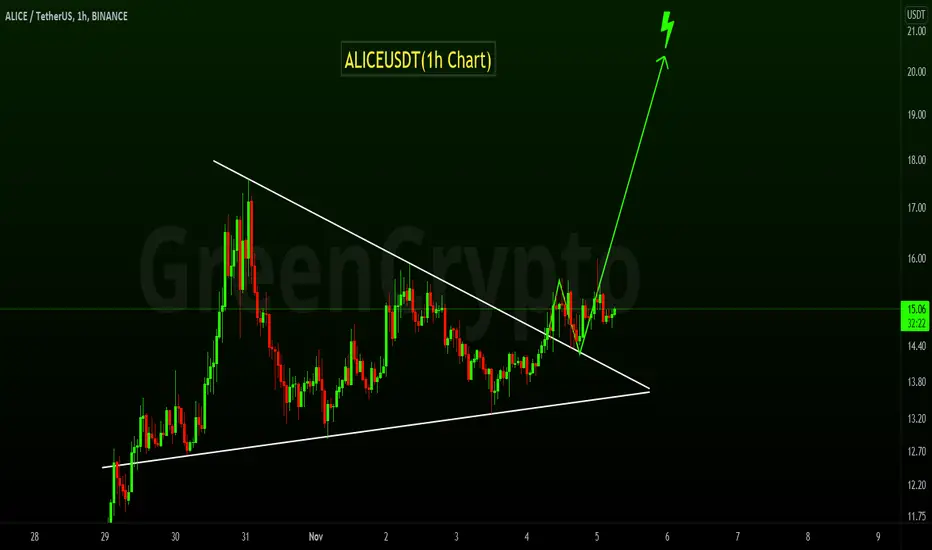
ALICEUSDT - Symmetric Triangle PatternALICEUSDT (1h Chart) Technical analysis
ALICEUSDT (1h Chart) Currently trading at $14.9
Buy level :Above $14.6
Stop loss: Below $13.70
TP1: $16.2
TP2: $17.3
TP3: $18.5
TP4: $20
Max Leverage 5x
Always keep Stop loss
Follow Our Tradingview Account for More Technical Analysis Updates, | Like, Share and Comment Your thoughts.
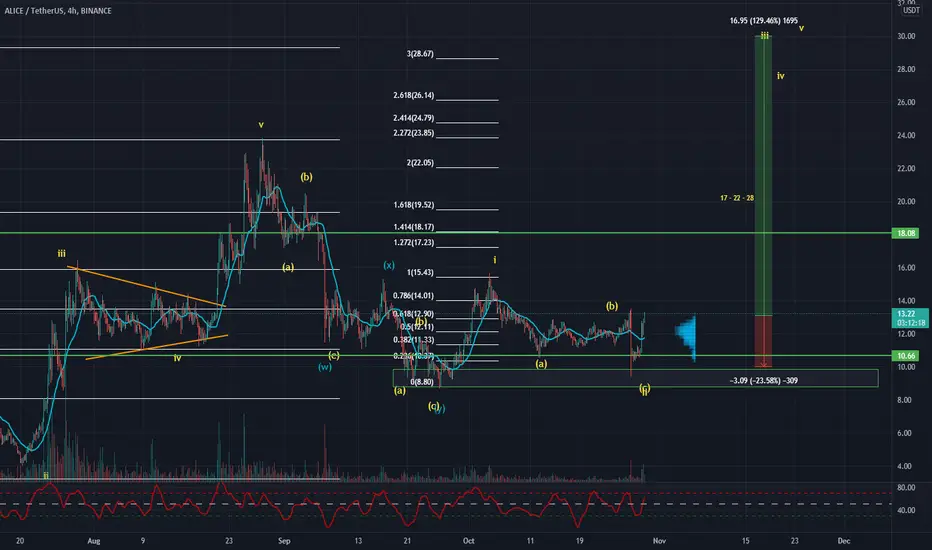
ALICEUSDT AnalysisHello friends.
Please support my work by clicking the LIKE button(If you liked).Thank you!
Everything on the chart.
open pos: market and lower
target: 17 - 22 - 28
after first target reached move ur stop to breakeven
stop: ~10 (depending of ur risk). ALWAYS follow ur RM .
risk/reward 1 to 5
risk is justified
Good luck everyone!
Follow me on TRADINGView, if you don't want to miss my next analysis or signals.
It's not financial advice.
Dont Forget, always make your own research before to trade my ideas!
Will be very APPRECIATE FOR UR DONAT/coins :)
Open to your questions or suggestions(Looking for investors!).