Flying into the sun or about to get burnt?Market is about to reach all-time highs again. Many trade deals must have been made. Interest rates must have been cut. Wars must have been resolved. Personal debt must have come under control. Corporate debt must have been resolved.
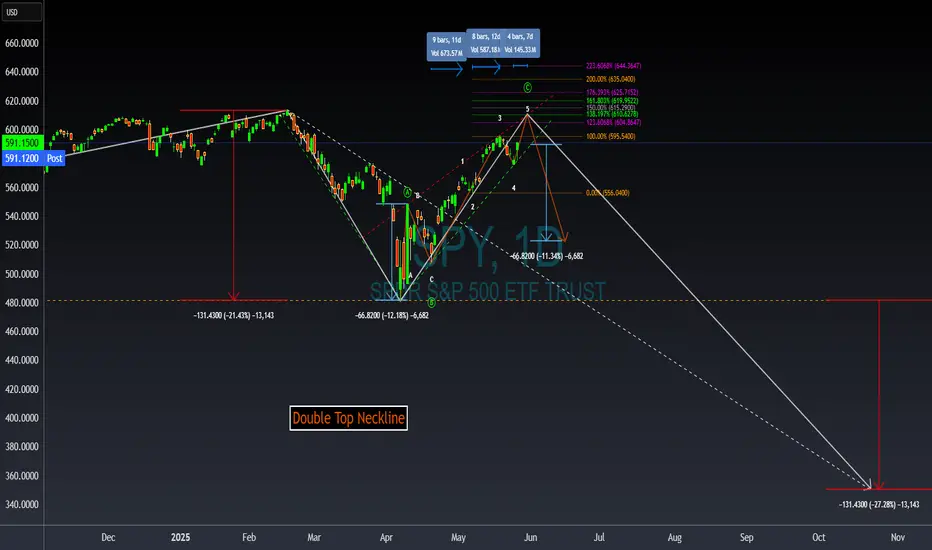
Wait, nothing has changed? Things are worse? Well why is the index about to hit new all-time highs? My take is a major fake out. We are about to set a double top as we complete a rising wedge pattern.
The rising wedge.
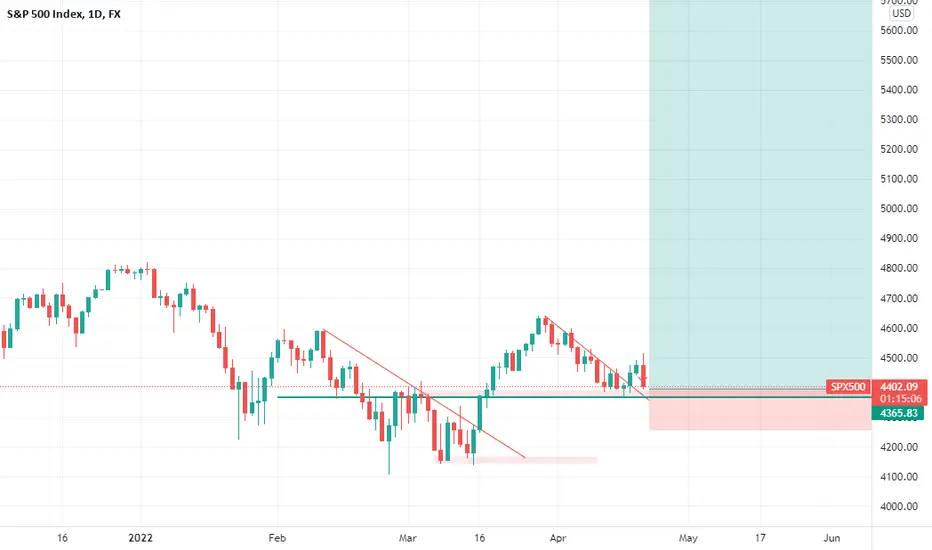
What began at the market bottom on 7 April, has remained bound in a channel. If the first pump up was an A followed by the declaration of the channel bottom as B, wave C has last over a month upward. We have wave 3 signals identifying wave 3 of C ending with the high on 19 May. Last week's dip was wave 4 and now we fly high this week. It is unclear if we actually make a new all-time high or fall just short. The below chart has 138.197% extension around 610.63. Inside wave C, my wave 1 was nine days long, and wave 3 was only 8. This points to wave 5 lasting less than 8 days. A common wave 1-3-5 duration in relation to wave 3 is around 114% for 1 and 50% for wave 5.
The height of the rising wedge covers 66.82 points. This same distance should provide the first target bottom once we exit the channel, possibly as early as next week. Once the bottom falls, we then examine the double top pattern. Although the neckline stretches far backwards, the bottom is established at the 7 April low. The distance from the neckline to the all-time high in February provides the next possible minimum target bottom by taking this 131.43 drop and subtracting it from the neckline of 481.80. This puts the initial low around 350.37 sometime later this year or early next.
There is a perfect storm of calamity brewing with zero resolutions in place or even planned. Do we finally drop or keep rising into the sun?
ALL-TIME
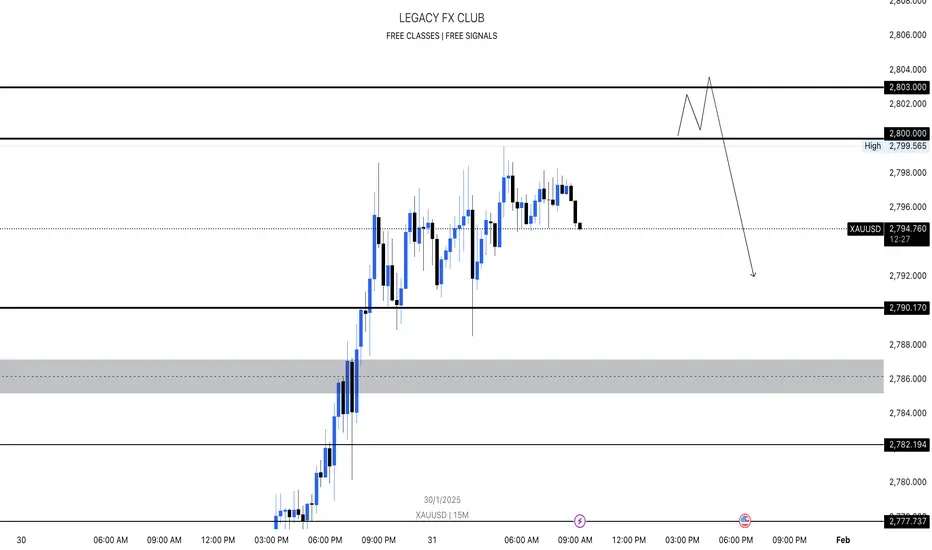
XAUUSD selling prediction after breaking All time highAfter sweeping All time high Sell XAU/USD at 2800 - 2803 📉
Stop Loss: 2806 🚫
Take Profit:
TP1: 60 pips 💰
TP2: 100 pips 💸
TP3: Open 🔓
Please ensure to apply proper risk and money management practices ⚖️.
📈TON Breaks ATH: Eyes on $6-7 Target?🚀🔥🔍TON coin has recently shattered its all-time high (ATH) with a convincing candle on the weekly timeframe, marking a significant 32% move from the trigger candle. The uptrend appears to be continuing, with a potential next target range around $6-7 based on Fibonacci levels. If you bought at lower levels, it is advisable to hold for now.
✨Taking a glance at the annual pivot points, TON has reached the R2 level and seems to be consolidating. Observing the reaction at this level will be crucial in determining the next move. A break above R2 could indicate further upward momentum, while failure and a trigger candle might signal a potential sell-off.
📊The recent influx of volume into this coin over the past two weeks suggests strong interest from investors. If there's a reaction to the annual R2 level, monitoring the trendline drawn can provide insights. In case of a breakdown and confirmation candle, selling could be considered.
💥The RSI oscillator has entered overbought territory, signaling a potential sharp movement similar to the recent 30% surge. Fundamentally, TON is associated with the Telegram messaging platform. If you believe in the widespread adoption of this messenger, investing in its coin could be lucrative.
🛒Waiting for a pullback to the trendline with confirmation from a candle could be a viable strategy if you're still on the sidelines. Keep an eye on the market dynamics and react accordingly for potential profit opportunities.
🧠💼Just remember, jumping into trades too quickly before the main trigger can be risky. Always manage your money wisely and be aware of the risks involved.

Breakout in tata consumer 23% upside possible A good breakout with heavy volumes ND strong rsi was done in tata consumer.
Buy it at 1191-1240
Target 1280 1470
Sl 1165
There is high possibility that 23% will be achieved with in 5-11 week

All time high breakout!!!The chart has given previous all time high breakout and now trending above that levels. So, it has technically good potential for upside momentum. A clear cup and handle pattern breakout.

AUDCHF short. my august bearish pairhi,
there is audchf. as you know aud bearish and chf bullish trends are on.
this is my roadmap for this asset, i wrote to chart some important levels for target.
wait for price to come discount levels which is there some supply zones.
take 1 and go
take a stoploss
cy

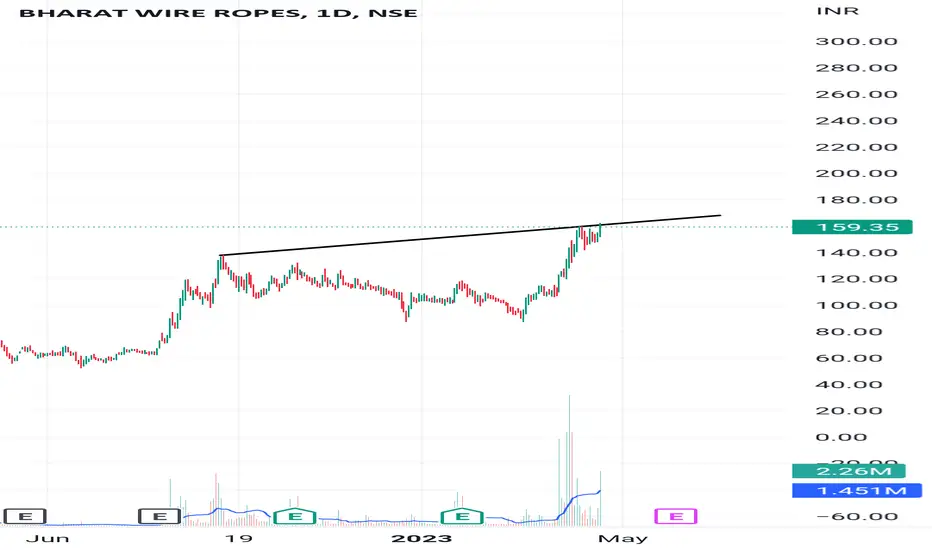
Bharat wire Bharat at all time high breakout
Enter above 161
Keep sl at today's low of candle
Tgt are 180 200
Ask your financial advisor before buying
Only for educational purposes
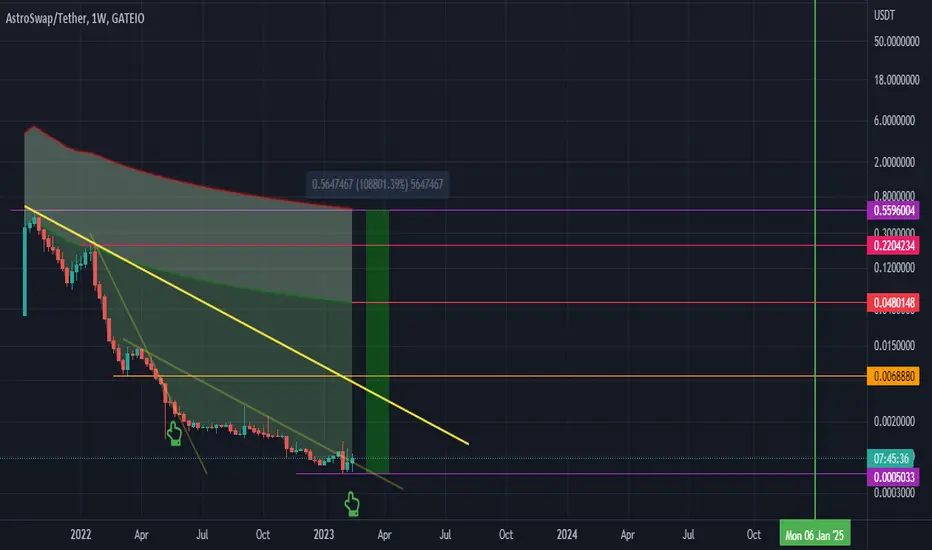
Astroswap a sleeping giant for 2025 bullrunAstroswap is a decentralized exchange on top of the Velas blockchain. Astro will eventually migrate to the Cardano (ADA) protocol in the near future at some point. As you can see by the trendlines from the previous price action we have three key prices to target; $0.048, $0.22, and the all-time high of $0.52. Coincidentally this $0.52 sits right at the high of the beam bands. Could Astroswap move back to its all-time high? Well, once they migrate over to the Cardano network it will be interesting to test this theory. Only time will tell but before this milestone is achieved we need to break through these two trendlines first and then we challenge the all-time high.
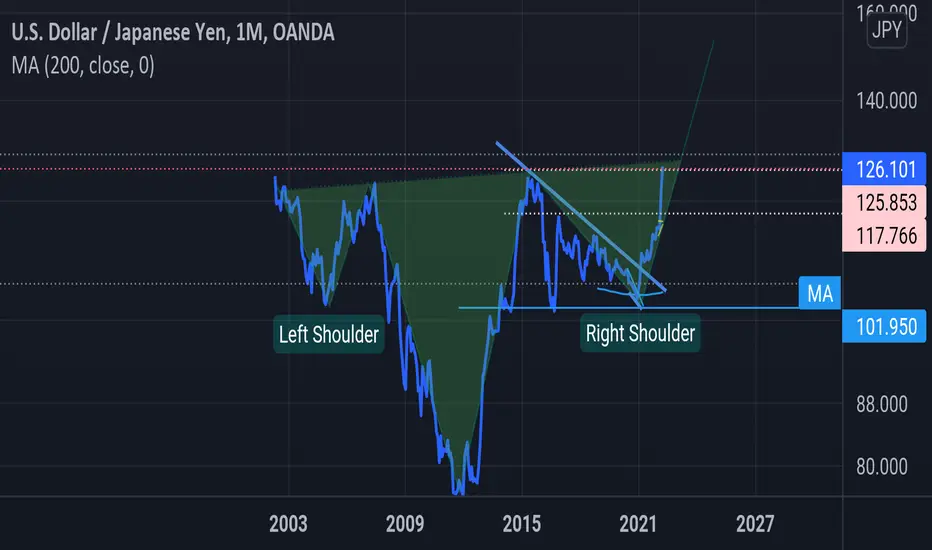
INVERTED HEAD AND SHOULDER PATTERN.🤳USDJPY is currently at the neckline of a well formed Inverted head and shoulder pattern.
I have clearly drawn it so we use Fib Extension to take our profits.🙏
Note: price is at it's ATH.😁
Can Bitcoin fall to the All-Time High from 2017?Can Bitcoin fall to the All-Time High from 2017?
Adjusted the Bitcoin Investor Tool that current price is in contact to the green bottom line.
Measuring the percentage drop from the past 3 times and transfer it to the current price...
...that would make it within the realm of possibility.
But what do you think? 😎
Drop me a nice comment if you'd like me to analyze any other cryptocurrency.
*not financial advice
do your own research before investing

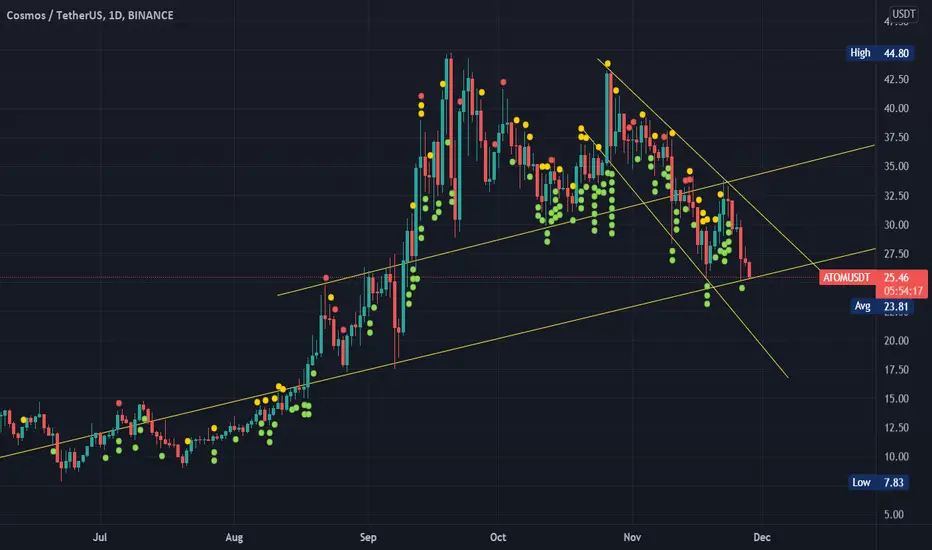
ATOM COSMOS at 1 day chart is respecting the strong support Strong support since may 21 is maintained by Cosmos, if this support does not break then 1 more All time high may occur, and most probably this will be the last ATH and cosmos will down then... lets hope for the best...

ETH will hit new All-time-high, upcoming $6,000 and $8,000 ETHEthereum has remained strong but slow this year, which has a lot to do with the failures it has faced, or challenges it has faced in becoming scalable. It was first to come out, as a leader of the pack, and showed other projects what not to do. But, it still remains very much a leader today, and I wouldn't be surprised if this eventually jumps Bitcoin for highest market cap.
We have an ascending triangle pattern, with a recent ATH. Once we move past this region, which can bring a lot of resistance to break through. Depending on if Bitcoin remains bullish, and continues to go up - Eth will absolutely cross to new highs, and beyond. Personally, I think Bitcoin will take a minor break here, starting the real rally in early - mid November.
When ETH does reach upwards, it will shoot for these 2 areas: $6,000 and $8,000 - which are fibonacci extension targets on the 1w chart.

Play the breakout on GRTOn the weekly chart we see a large pattern forming, my bias is to an upside break to continue the rally from earlier this year.
Once a weekly candle closes above this pattern expect new all time highs in weeks/months.
If prices fall out the bottom of this pattern and sets a weekly close, that would invalidate this idea.

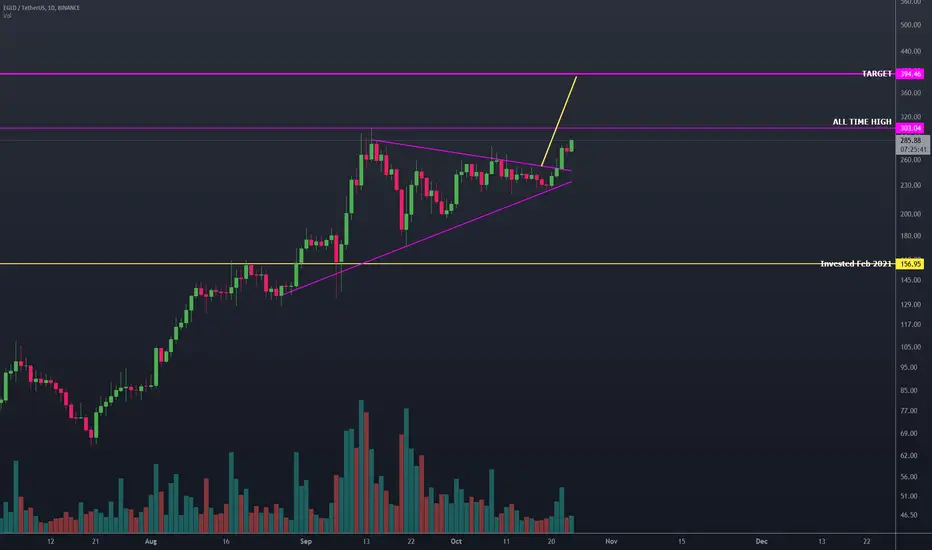
EGLD to $400 and beyondRisk to reward ratio on EGLD looks very attractive right now.
1. Its just broken bullish out of a huge pattern
2. DEX is due to launch soon driving up demand
3. wen coinbase listing <3
$400 is the most conservative target.
Cardano (ADA) to all time highsCardano has done this in the past, it turns into a stablecoin and looks like its painting a head and shoulders pattern, but then blasts to the upside.
I see the same pattern happening, price is already getting pulled tight. I think once RSI breaks above 50 (seen below) and price breaks UP out of this pattern, we will see cardano returning to all time high within weeks/months.
If we break down out of this pattern, it would invalidate this idea.

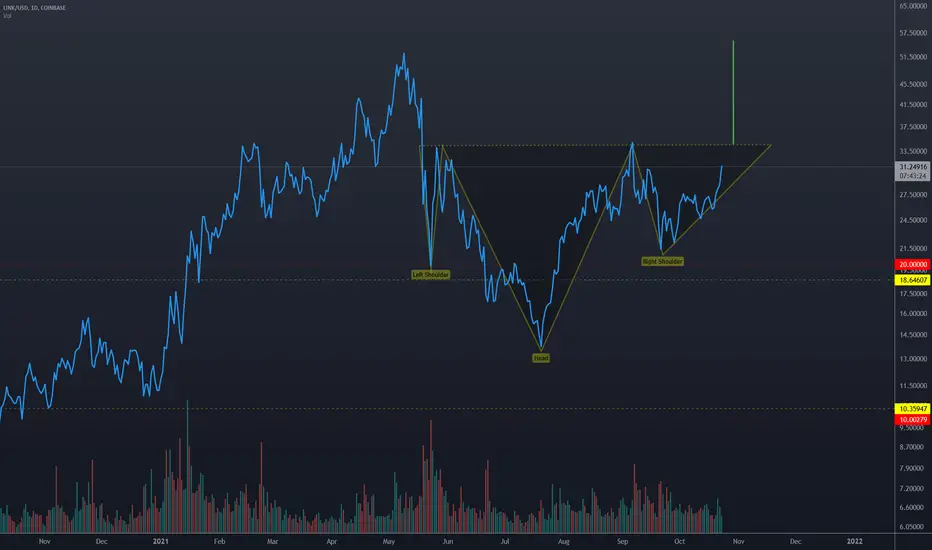
LINK to all time highs $55+We see this inverse head and shoulder on lots of major alts right now.
I like LINK, im a long term holder, it has nice tokenomics.
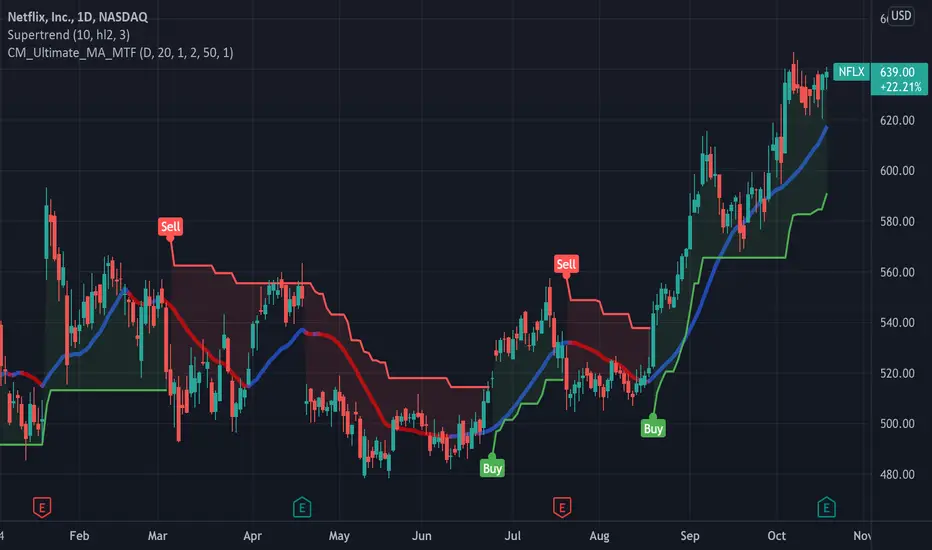
Netflix Post Q3 Earnings Analysis$NFLX - Netflix neared a record all-time high after market close - as the largest streaming service brought in more subscribers than analysts projected in Q3. Profit also beat forecasts, while Revenue was in line with estimates.
EPS of $3.19
Sales +16.3% to $7.48 billion - anticipates another +16% gain in revenue Q4
Profit of $1.4B
Revenue of $7.5B
Netflix added +4.4M subscribers globally to total 213M - expects to increase its subscriber base by +8.5M in Q4
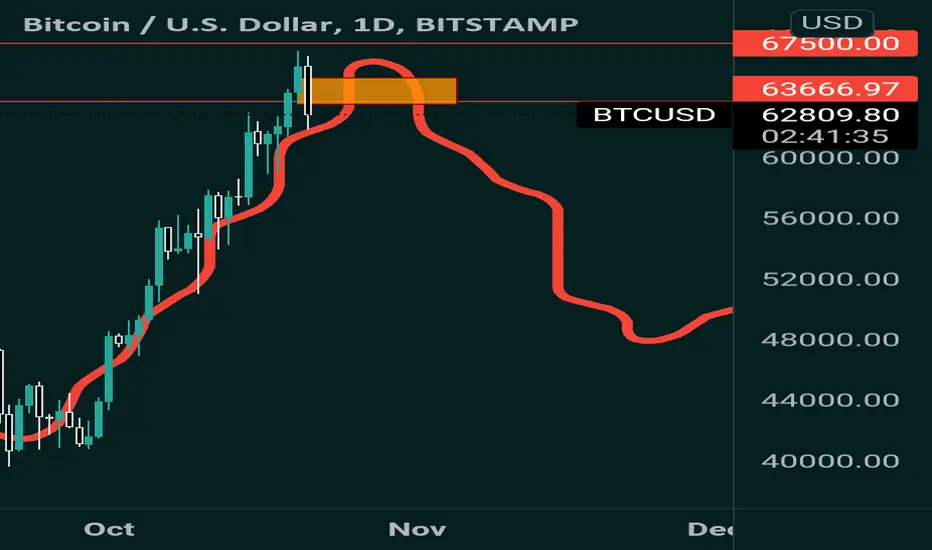
Bitcoin Price Aligned Off Mid-Cycle Low SETTING UP Blow Off TopPrevious cycles from mid-cycle low to blow off top took approximately 150 days each time, price moving in two waves before reaching "lift off" a pullback 35 days prior to the cycle peak.
We broke 2 of the most important resistances.
The price is set to broke ATH end of October or first days of November.

the bottom line ¯\_(:|)_/¯finally reached the all-time low. I'm in, how about you?
❤️Please, support our work with like & comment!❤️
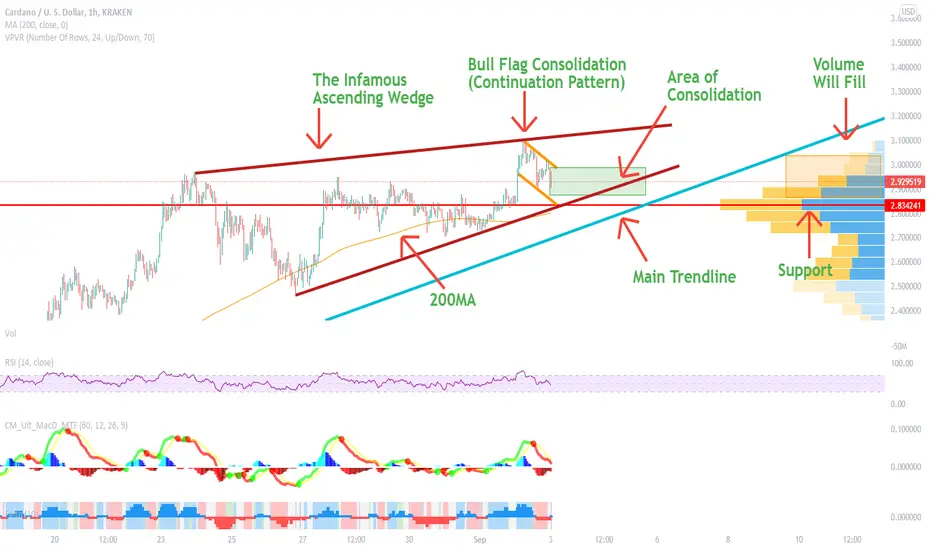
ADA Makes Small Gains Market SidewaysI have been in a bit of a time crunch lately and realized that I made some mistakes that might not have mattered to someone that understands technical analysis, however it would completely confuse a beginner. Since, I assume I have some beginners here, I decided to take some extra time out of my day, slow down, and explain what I see properly. This way, it will avoid any undue confusion, because that is the last thing I want to do. If you want to understand why the gains are so small, and we are seeing bullish and bearish patterns, you have to take a look at BTC. BTC has been trading sideways for about 2 weeks now. When an asset is trading sideways it becomes vulnerable to price movements by either bears or bulls, and really, there is no way to tell which way it is going to go. Traders hate sideways markets the most due to their unpredictability. So, that being said, it is taking the steam out of a lot of assets. Now lets look at ADA, you can see the slope of ADA is beginning to flatten, this means it is losing steam and its bull run is coming to and end. This can always change depending on the direction of the market, but right now, people are reluctant to trade when the market is sideways. Not to mention the ascending wedge that is forming, which is letting you know a pullback is on its way. However, like I said in my last chart, this happens very slowly, and usually takes more than 2 major higher highs and 2 higher lows to occur. The important thing to know is that a pullback is likely on its way. That being said, there is a possibility that ADA can reach the target between 2.16 and 2.24. That is not very far from its last high. However, unless I see another sign like a change in the overall market direction, I will assume a pullback. So if you think about it, the risk reward isn't too good if you are entering ADA at this point. We are looking at smaller highs, a flattening slope, tiny highs, an ascending wedge, and overall market uncertainty. On Sep 15th El Salvador will make a decision whether or not BTC becomes legal tender. That is important to note. Another important thing to note is that there are likely people holding out on ADA until they see smart contracts released live on the 12th, I expect a small bump from that. The most important thing here is the overall market and the signs. I expect ADA to keep consolidating, however if there is a break below the 200MA, watch it carefully, and I mean that. I will continue to update you on this as much as I can. Again, I apologize for any confusion from my last post and I hope this helps clear things up.
Now for some good news. As a person who follows ADA closely, I know that the adoption of the platform will happen very quickly with the release of smart contracts on the 12th of September. In fact, I think it was built with such a great foundation, I might just do an entire post on the fundamentals of Cardano sometime in the future. Pretty soon, we will see NFTs being created, DeFi, applications being developed, and overall strong adoption of the ADA blockchain platform as a whole. If there will be any immediate reason for ADA to move higher, it will likely be news coming from the summit on the 25-26 of September. So I would keep an eye on their twitter accounts around that time.
Again, I apologize for having less time to post at the moment, but that will change in a couple weeks.
I am going to make a video soon teaching everyone my approach to charting. I will cover the entire workflow process I go through. I hope you enjoy it.
Tell me what you think?
This is not financial advice. DYODD.