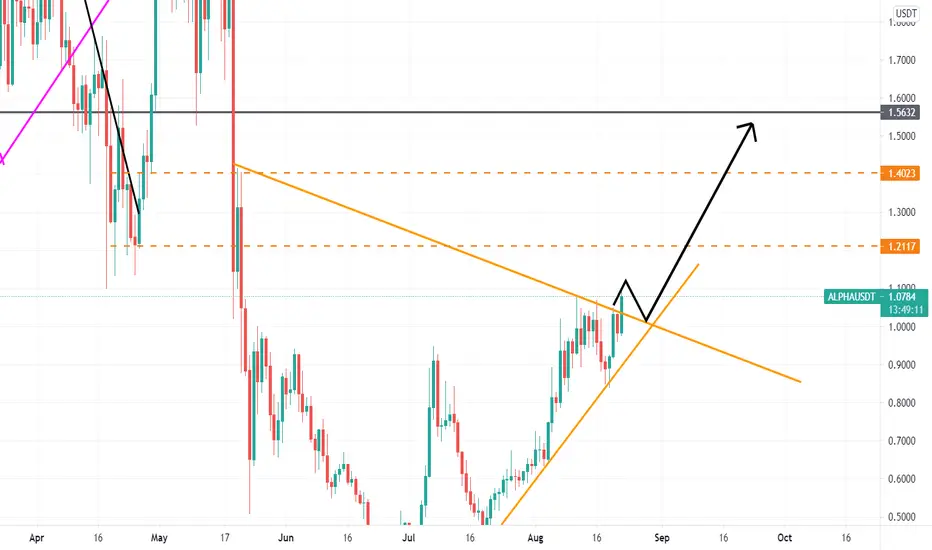
ALPHA/USDTKeep an eye on alpha here ,
will try to long after a successful breakout or another test of trend line ( $0.93 - $0.94 )
Targets are :
- $1.30
- $1.51
- $1.72
- $1.85
ALPHA-C

ALPHA another try?ALPHA pulled back from resistance at 1.3789, we could see another try to break this level...Volume falls down and it looks like it's ready...

ALPHAUSD 1D - Potential Path Into 2022 - Double May After BreakPretty obvious charting. If we break the prices that we encountered in May then we are in no man land with no resistance, I see us doubling from ATH easily if those prices are broken.
NOT FINANCIAL ADVICE.

Alpha/Usdt breaks up and heads towards $1.4Update idea for Alpha/usdt
Seems to have broken the trendline and will break towards the price of $1.4
Alphausdt(short)It’s seems today bear take control for while and I’m going to have short postion with small stop loss

ALPHAUSDTsee and watch :)
The trend line has been broken and the price has hit it and it seems that it can increase up to the specified range ...
Alpha long tradeWill go log if Alpha breaks the resistance line
__________________
𝐅𝐨𝐥𝐥𝐨𝐰 𝐭𝐡𝐢𝐬 𝐚𝐜𝐜𝐨𝐮𝐧𝐭 𝐟𝐨𝐫 𝐦𝐨𝐫𝐞 𝐮𝐩𝐝𝐚𝐭𝐞𝐬
𝐈𝐧𝐬𝐭𝐚𝐠𝐫𝐚𝐦:- 𝐜𝐫𝐲𝐩𝐭𝐨__𝐩𝐚𝐧𝐭𝐡𝐞𝐫
𝐓𝐰𝐢𝐭𝐭𝐞𝐫:- 𝐜𝐫𝐲𝐩𝐭𝐨__𝐩𝐚𝐧𝐭𝐡𝐞𝐫
𝐘𝐨𝐮𝐭𝐮𝐛𝐞:- 𝐲𝐨𝐮𝐭𝐮𝐛𝐞.𝐜𝐨𝐦/𝐜/𝐂𝐫𝐲𝐩𝐭𝐨𝐏𝐚𝐧𝐭𝐡𝐞𝐫
𝐓𝐞𝐥𝐞𝐠𝐫𝐚𝐦:- 𝐭𝐡𝐞𝐜𝐫𝐲𝐩𝐭𝐨𝐩𝐚𝐧𝐭𝐡𝐞𝐫
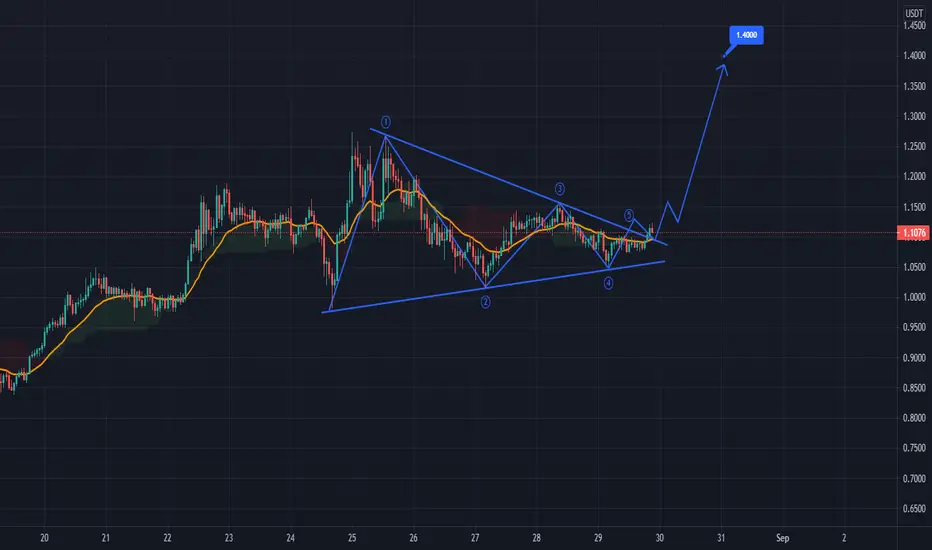
alpha usdt daily chartlong idea for alpha usdt daily chart
you can enter a long position after rstest or you can buy at 2 level...half right now and another half after a correction or retest
.
.
.
.
.
.
comment your idea
Alpha Long You don't see something similar??
Same pattern, same fib retracement, maybe the same goals at the end ... Let's see
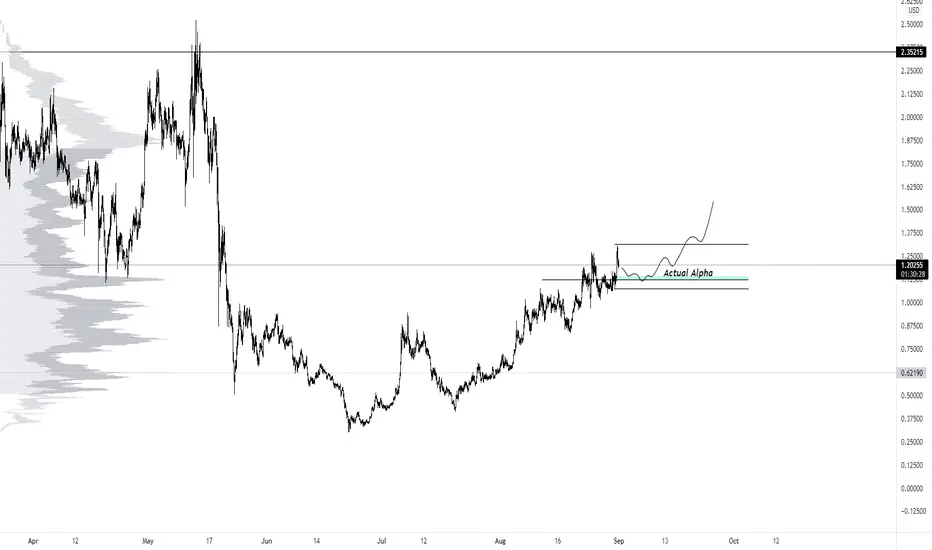
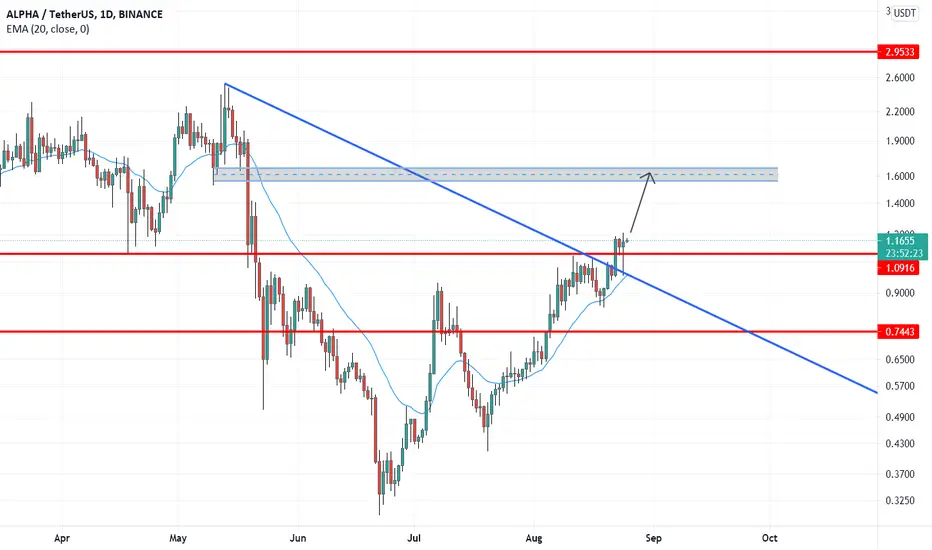
KEY RESISTANCE AHEADI want to see the price clearly close above this last grey area, clear S/R, close and consolidate above, and thats a clear long to those levels in chart, probably new ATH.
Good luck!

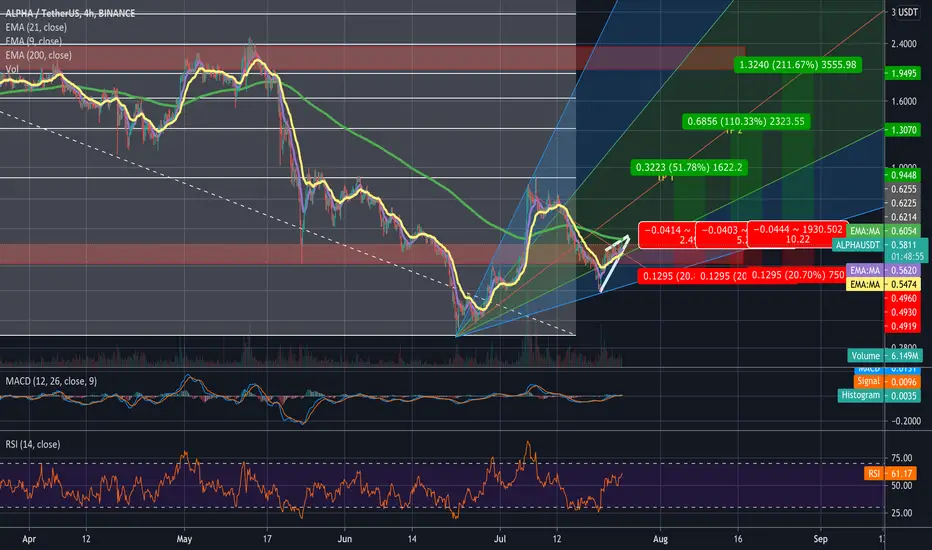
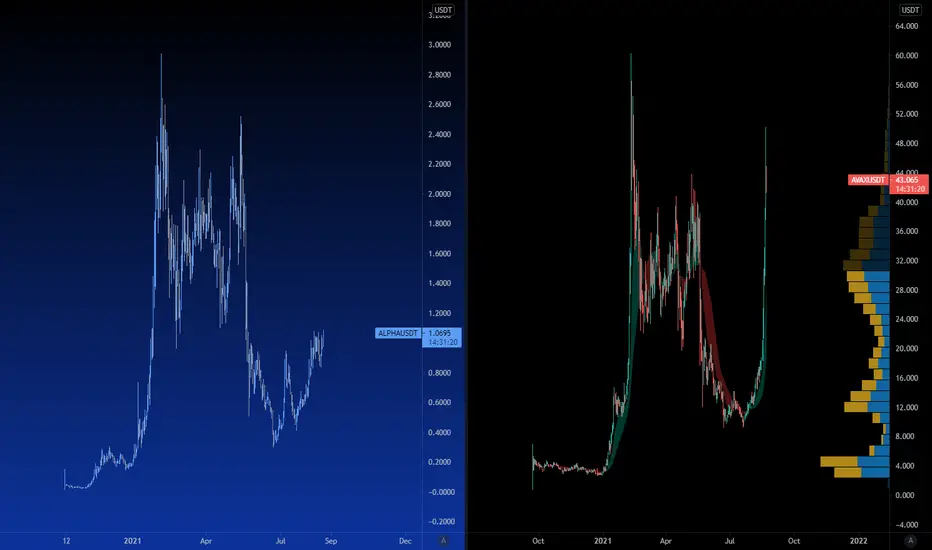
Alpha Comprehensive AnalysisI see a static resistance around 2230 satoshi which is tested and then denied about 7 times lately. In theory I assume that resistance is finally broken so what is the target? A giant dynamic resistance has been formed since day One of alpha(The great gray line). Price has been playing below that grey line for about 90 days. That is a strong and serious line which may cause a delay on price growth. Now Price around that line is around 2800 satoshi.
Above is another trendline which has been formed since the local top around Mid-May.Now Price around that line is around 3000 satoshi. That is a focal point which may let price grow through last top area (7k satoshi).
So There is a road to ride for Alpha and there is a safer way with fundamentals. Team has released many great news about a product called Alpha X. I personally think if price tend to break aforementioned lines, it absolutely needs driving fundamentals like Alpha X( In case of a great product). Below I highlighted a Fibo channel which shows good points to take profits.

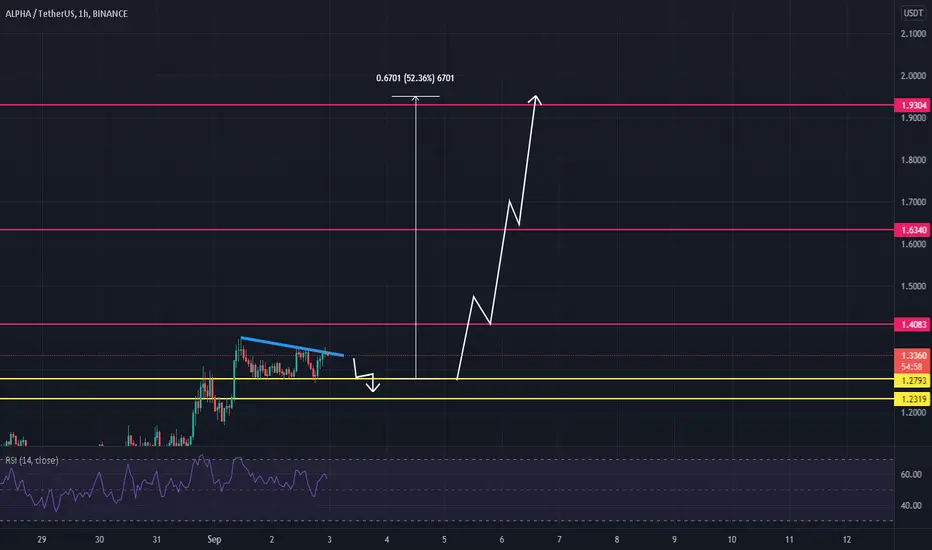
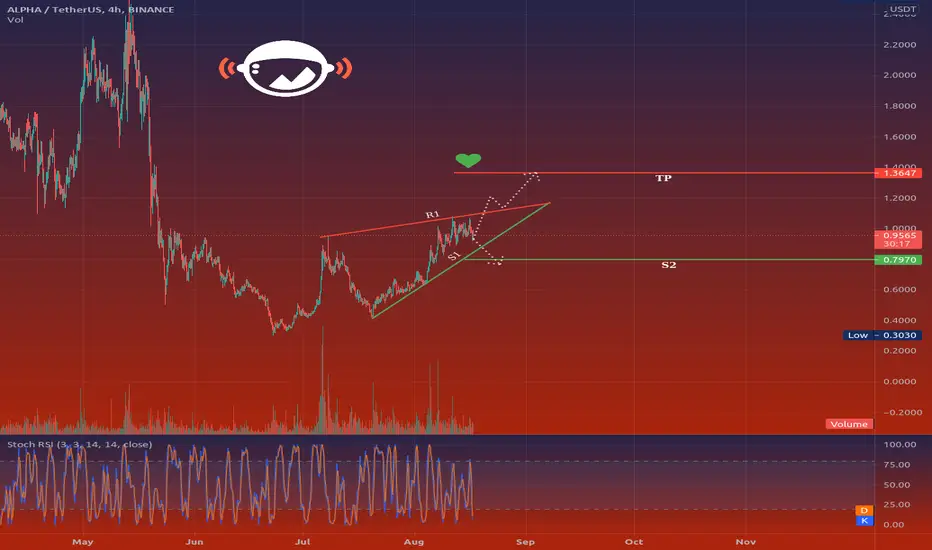
🆓Alpha Finance Lab (ALPHA) Aug-20 #ALPHA $ALPHABuying power has returned to ALPHA and it can help ALPHA surge to the $1.3 and $1.9 zones in the next few days. But if it loses the $0.9 zone, it will correct to the $0.75 support zone
📈BUY
🔴Buy : 0.88-0.92$. SL if B
📉SELL
🔴Sell : 1.27-1.33$. SL if A
🔴Sell : 1.85-1.95$. SL if A
♻️BACK-UP
🔵Buy : 0.73-0.77$. SL if B
❓Details
🕯Timeframe : 1 Day
📈Red Arrow : Main Direction as BUY and SELL section
📉Blue Arrow : Back-Up Direction as BACK-UP section
🟩Green zone : Support zone as BUY section
🟥Red zone : Resistance zone as SELL section
🅰️A : The Close price of candlestick is Above the zone
🅱️B : The Close price of candlestick is Below the zone

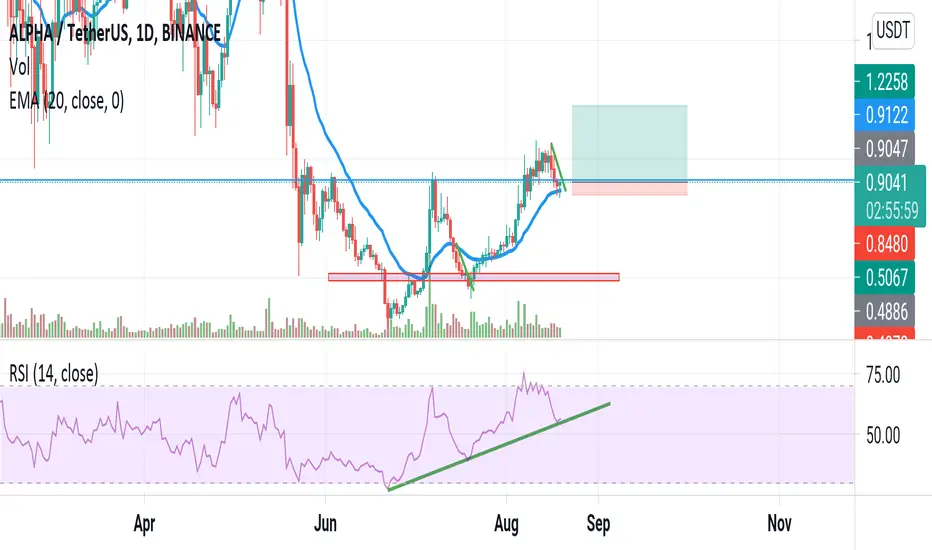
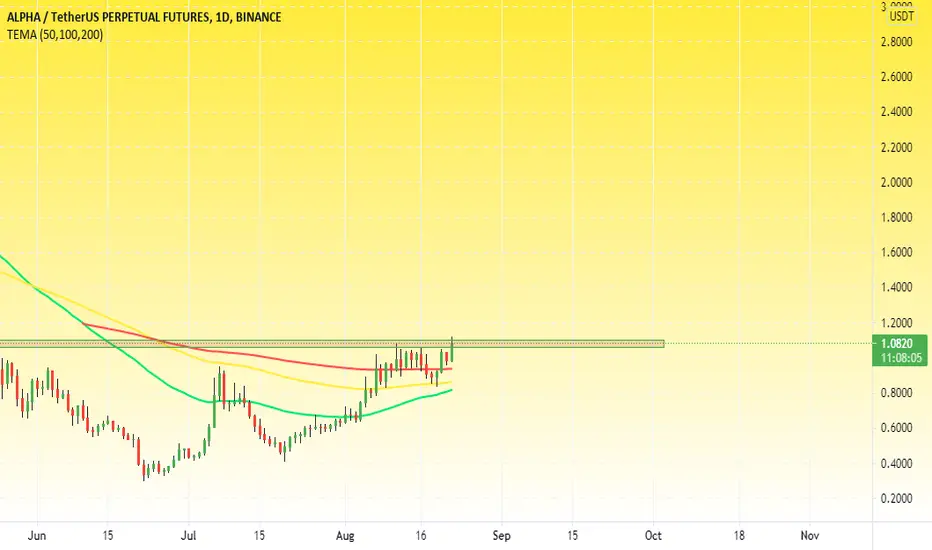
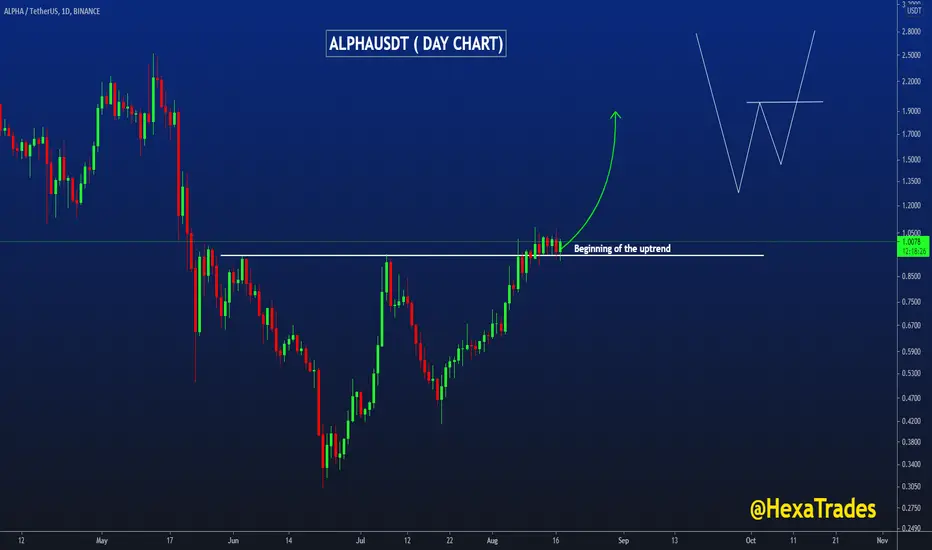
ALPHAUSDT beginning of the uptrend!ALPHAUSDT Technical analaysis Update
ALPHA/USDT currently trading at $1.00
swing trade setup
Short level : Below $6.93
Stop loss: $0.80
TP1: $1.18
TP2: $1.40
TP3: $1.62
TP4: $2.00
Max Leverage 1x
Always keep Stop loss
Note: please do your own research before investing. Never invest money that you can't afford to lose.
ALPHAUSDTHello to you all. Mars Signals team wishes you high profits at all times.
We are in a 4-hour time frame. As you can see, the price could not break the resistance upwards and was pulled down again. We have now identified a support line for you that the price can react to and move up again. But if the price is below the penetration line and stabilizes, we consider the fall to the next support.
Warning: This is just a suggestion to you and we do not guarantee profits.
Wish you luck!
Alpha Finance Lab - ALPHAUSD- Head and Shoulders!- Alpha Finance Lab - Rank #132, Volume 24h $62,118,554.
- On the chart we can clearly see and Head and Shoulders bullish pattern.
- Target is previous swing high & HaS & 1.1618 FIB!
- We can also spot a bullish volume, which dominates!
- For expected duration of the trade, probability, stop loss, profit target, entry price and risk to reward ratio (RRR) - please check my signature below ↓
- If you want to see more of these ideas, hit "Like" & "Follow"!

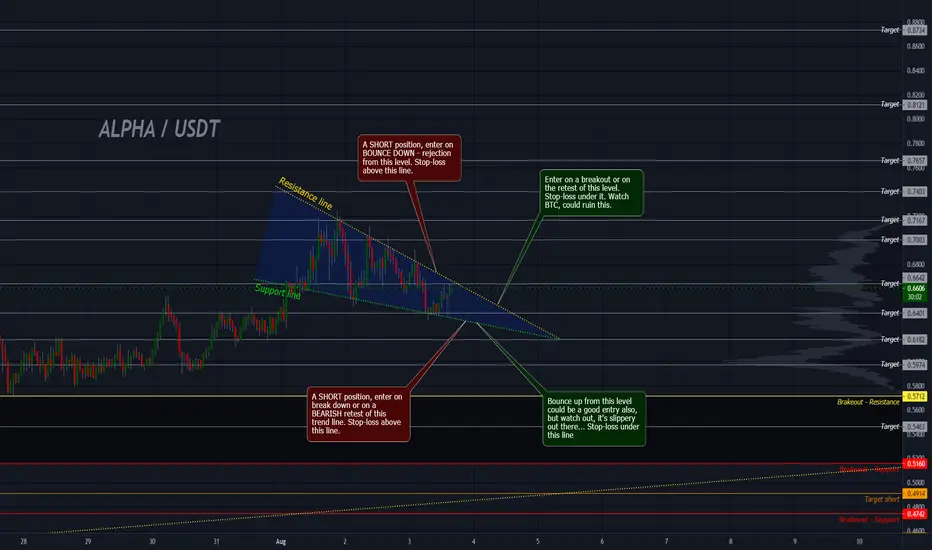
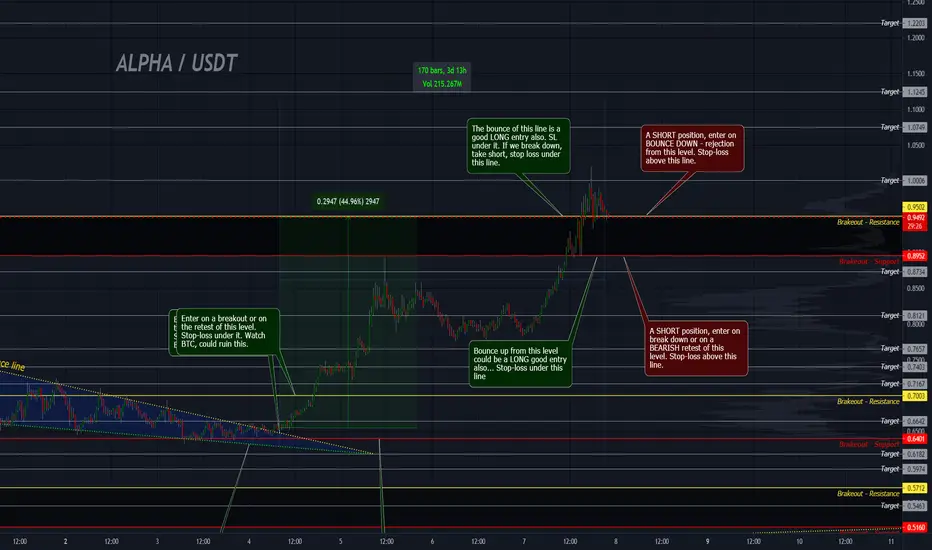
ALPHA, long or short ?I try to react not to predict, the only prediction for me is how am I going to reacting to some things. That's the situation right here. ALPHA had a nice run-up, about 100% for the last two weeks without any big correction, so maybe it's time. Also the market is very very bullish so we can also go more... Here are the levels that I am going to watch. The last published idea for ALPHA bring us about 47% profit, so let's hope the next trade could be also profitable...
$ALPHA,~30% on the daily ...$ALPHA
~30% on the daily , showing increasing volume as its facing ~2300 sats resistance
From here, looking for a breakout/flip over this level as continuation..
UCTS took the entry at 12H Buy (usually strong) and ~25% up so far..
Let it run
#ALPHA

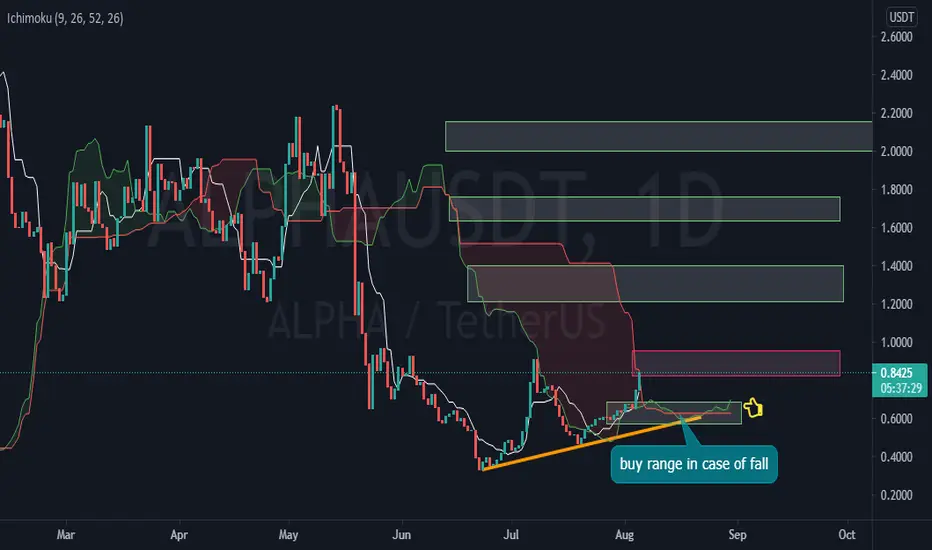
alphaIt seems to be breaking its resistance range
One of the signs is the formation of Ichimoku green cloud
target are clear in case of resistance failure
ALPHA USDT falling wedge I like this wedge, it looks good and "should" broke up, unless BTC poop... Alarms are set, waiting...