🚀 Catch the Classic Rise: ETCUSD Long Trade Alert! 🚀Hello, Traders! Looking to spice up your portfolio with a flavor of classic gains? Let's break down why Ethereum Classic (ETCUSD) is gearing up for a notable uptrend and why you might not want to miss out!
Current Summary for ETCUSD
Currently, there's no direct news about Ethereum Classic, but we can contextualize its position in the broader crypto market. Recent significant crypto transactions involve a whale depositing a substantial amount of ETH into Binance. This action signals potential volatility or strategic positioning in the market, which indirectly affects all related cryptocurrencies, including ETC.
For example, a whale deposited 11,550 ETH into Binance, worth about $37 million. This move might suggest a preparation for price movement or a strategic shift in holdings. Such large-scale activities often impact market sentiment and can lead to price fluctuations across the board, including for Ethereum Classic. 🐋
Although these activities primarily involve Ethereum, they reflect general market behaviors that could influence Ethereum Classic, given their shared blockchain heritage and investor base.
Why Go Long on ETCUSD?
Ethereum Classic's transaction value in USD recently dipped to a noteworthy low of $523.06. Why care? Historically, such lows have been the catapults for upward price trends. This isn't just a hunch — data dives deep!
Big Data Insights 📊:
On-chain metrics have shown a pattern — when certain metrics fall, ETC tends to bounce back stronger, much like a phoenix rising from its ashes. Here’s the scoop:
Transaction Value USD : Below $1150.6
Puell Multiple : Below 1.3 (52-day change below -0.1)
Total Fees in USD : Below $70
Each time these conditions were met historically, ETCUSD saw a median price increase of 24.19% over the following three months. We've crunched numbers from 11 similar past events, showing an impressive 85% of those periods ended in price surges. 💹
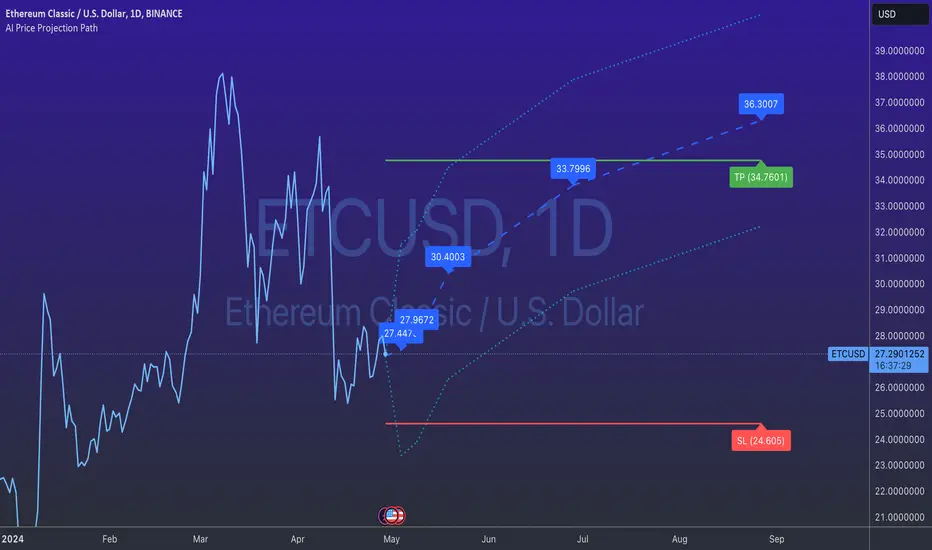
Price Projections:
1 Week : $27.4473 📈
2 Weeks : $27.9672 📈
1 Month : $30.4003 📈
3 Months : $33.7996 📈
6 Months : $36.3007 📈
Trade Strategy:
Take Profit: $34.7601
Stop Loss: $24.605
🌟 Why Follow This Trade?
It's backed by consistent historical data, promising a high accuracy and attractive risk-reward ratio. This isn’t just trading—it’s trading with the wisdom of the crowd, refined through big data!
Let's ride the wave of historical momentum with Ethereum Classic. Are you in? Drop a comment, share your views, or toss a like if you're ready to catch the classic rise! 🌊🏄
Altcoin
CAKE is about to give one HUGE birthday surpriseChart is marked with targets
Yes, I realize the targets that I've marked
When it crashes, it might be BIG.
It won't make it to 25 without retracing on the way up.
I could see it top out around 6.9 in an alt coin pump
Personally, I'm quite bullish on this coin.

Eth offering up an Elliott Wave soft ball here?If you find this information inspiring/helpful, please consider a boost and follow!
Ethereum appears to be printing a beautiful impulse here.
An impulse is a fantastic anchor in Elliott Waves.
There are many ways it can develop that could telegraph a potential for continuation, or a reversal.
I want to see a completed impulse down here at a lessor degree, followed by a retrace to an area of confluence, about 50% back internally to the smaller degree impulse, before looking for a continuation down.
Since, per Elliott wave, price is fractal it could snow ball into a larger move to the down side.
3356 would be the invalidation for a the short.
If that is broken I would wait for further upside to complete, and look for the same clues higher up.
If it completes down and the impulsive move up is complete here, PA does not move up past 3356, I would be looking for a reaction, in the form of an impulsive move up. If this occurs I would scout for an internal retracement of the reactionary impulse to confluence before looking for a long.

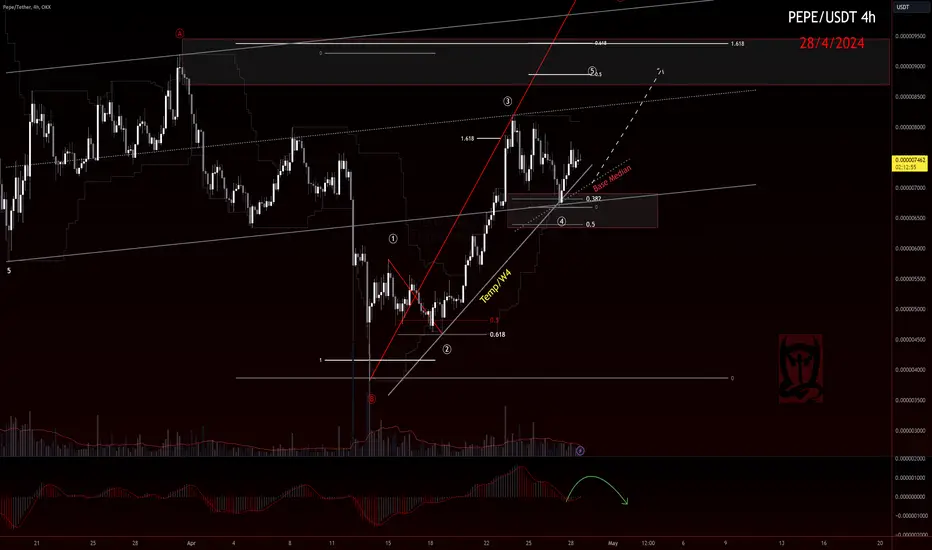
PEPE Elliott Wave TakeIf you find this information inspiring/helpful, please consider a boost and follow!
#PEPE
Not sure what this company does.
If it prints an impulse, I'm interested.
LINKUSDTLINKUSDT have done a perfect impulse to the upside in 1 2 3 4 5 Wave. After that it is correcting the entire impulse. For now it looks like it is going the collection in WXY. The 1:1 Extension and the .618 Golden pocket lines are perfectly. This chart looks extremely bullish. Let's see if we get a good reaction around the golden pocket. NFA.

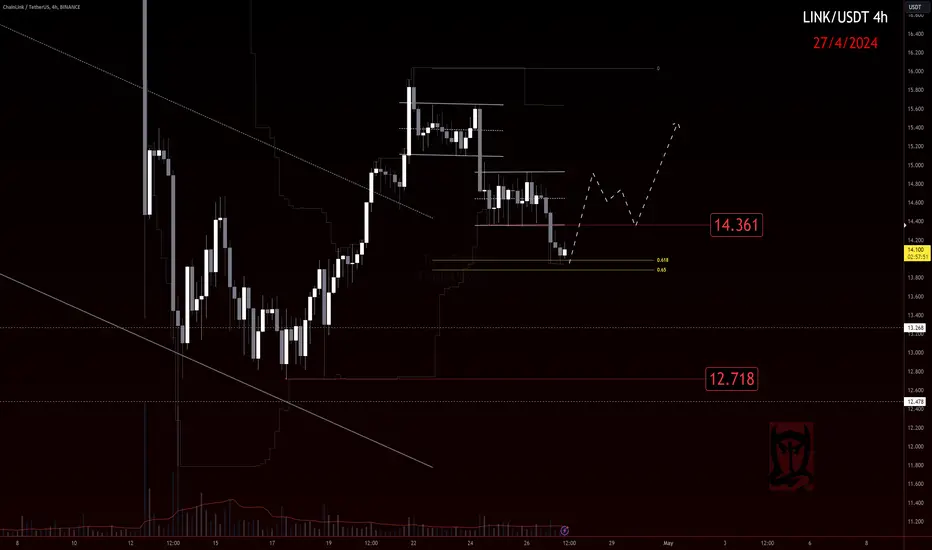
Link, Keeping It Stupid SimpleIf you find this information inspiring/helpful, please consider a boost and follow!
NASDAQ:LINK update 🧵
Went deeper than expected...🤔
But it's making it simple for me.
IF
gives a bounce out of the GZ,
breaks 14.361 impulsively, or higher,
Then
I will consider a long at some degree, on a retrace back to one of these level with confluence.
Till then, 5s down and correction sideways at this degree.
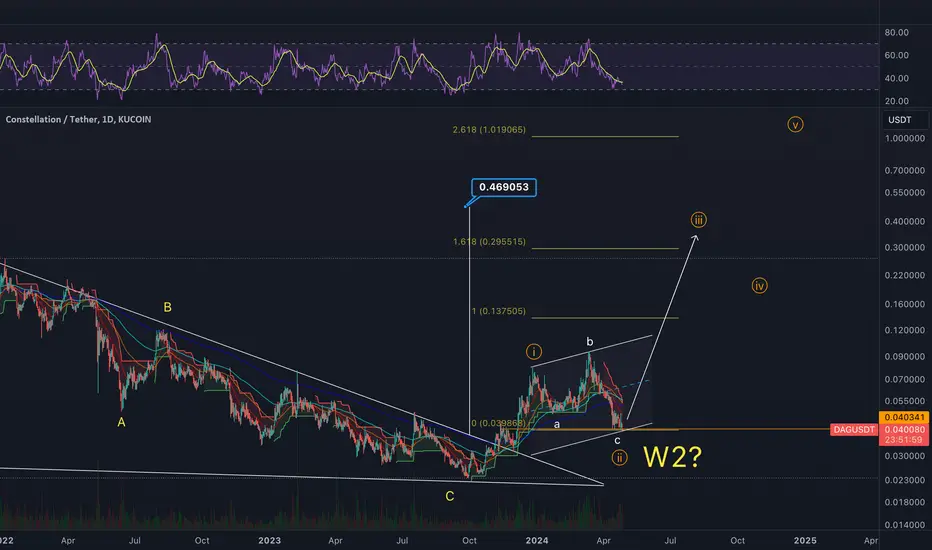
DAGLooks like dag has completed an irregular falt correction where wave B overshoots the start of the A.
Needless to say I expect a strong w3 here to about .45-.50c CRYPTOCAP:USDT
Set a high HBARHBAR is looking good on the daily chart. We have tested a local support and rejected north.
RSI is still oversold and appears to have started trending up. Fib extensions are targets, also marked by horizontal ones.
R:R 1:13
stoploss below second support marked in red
This is NFA
Do your own DD
Good luck!

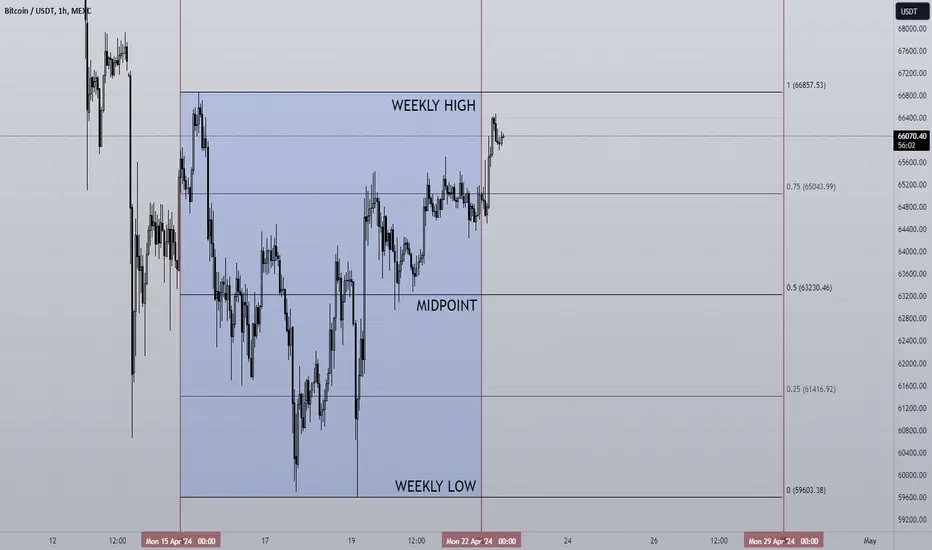
22/04/24 Weekly outlookLast weeks high: $66857.53
Last weeks low: $63230.46
Midpoint: $59603.38
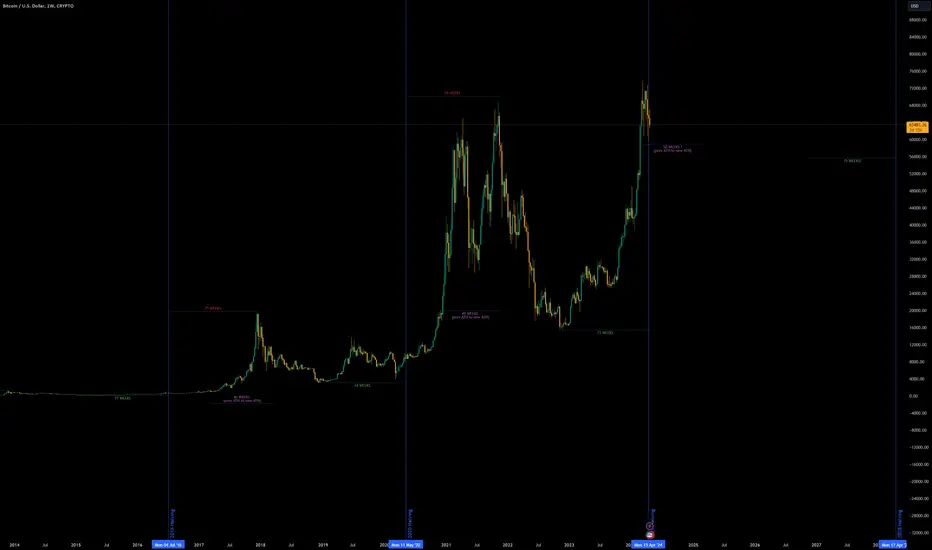
The 4th Bitcoin Halving is now complete , the block reward has been cut from 6.25BTC to 3.125BTC . The reduction in reward creates a supply shock that changes the the tokenomics drastically. We now have a situation were miners revenue effectively halves overnight , despite this miners would have had ample time to plan for this as the halving is every 4 years consistently and would have been able to plan accordingly.
Last week we saw Bitcoins price drop back to sub 60k after losing the 4H 200EMA support level . After a double bottom price rose back towards the underside of the 4H 200EMA and now retesting as resistance. This week will be key for the direction of BTC in the short term. We know post-halving we see new highs within a year, often very quickly after the event, but the short term price direction is very difficult to predict at this time.
Institutional buyers are here, we have big players like BlackRock and MicroStrategy buying up large amounts of BTC to hold long term, the Hong Kong ETF begins on 30th April and could potentially bring Billions of dollars in additional in-flows. Grayscale has been the lead seller in the last few months as they sell large amounts of their GBTC, currently $16.4B in total . A large reason for the sell off is the high fees on Grayscales ETF compared to the newer low fee options presented by BlackRock, WisdomTree, Valkyrie etf all at 0.25%. Grayscale have now tackled this problem by creating a "Mini-GBTC" with 0.15% fees making it the lowest on the market . It will be interesting to see if this stops the consistent outflows. If it does and yet more demand enters the market in Asia coupled with a stunted supply of new Bitcoins we are looking at a good environment for price growth.
This week I will be keeping a close eye on how BTC reacts around the 4H 200EMA, If we hover at this area with now real emphasis on direction then this is a traders environment where money can be made both ways before resuming the overall HTF uptrend.
Alts took a huge hit last week and have given some good entry opportunities, naturally a strong BTC is needed to see progress in the alt market, with a strong reclaim of the 4H 200EMA alts can return to being risk on with a tight stop loss in my opinion.
GAL - scalping ideaStill looking at GAL after this surge the last days. Looking on opening an scalp position to our swing position which is up 35% 🚀
On the 12H tf I am looking for the FVG to get filled, we shouldn't fall much lower but the "worst" scenario for now would be a pullback to our swing entry and the demand resting there. Target for the scalp is the range high at 5.41$

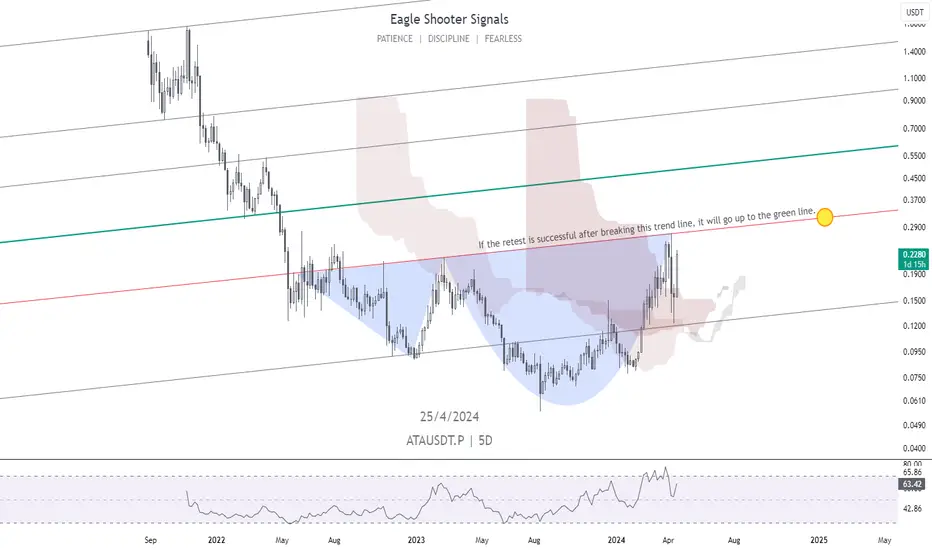
Ideas you need when investing "ATAUSDT"Hello, friends. Nice to meet you
This chart exhibits a classic Adam and Eve pattern. A decisive breach above the red neckline (resistance) could propel prices towards the green line (target).
Solana - SOL Fractal NO ONE talks about📉Hi Traders, Investors and Speculators of Charts📈
SOLANA is on the list of my top 20 altcoins to watch in 2024.
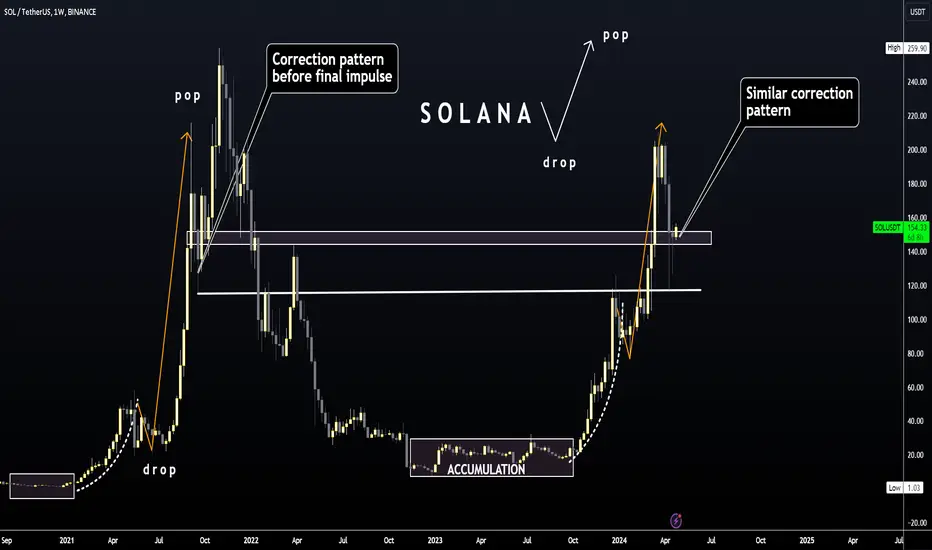
From a macro chart perspective, I'd like to point out a large-scale fractal that I'm labelling as the "drop-and-pop".
What we observe here is 1)accumulation phase followed by 2)first impulse up after which we se a 3)correction and then finally the 4)second impulse wave .
From a technical indicator view we know that the price is bullish because we see a "Overbought" flash on the weekly, which usually indicates strong bullish momentum :
Note that this, again, confirms the need for a pullback/drop before considering the start of impulse wave 2 /pop.
If you found this content helpful, please remember to hit like and subscribe and never miss a moment in the markets.
_______________________
📢Follow us here on TradingView for daily updates📢
👍Hit like & Follow 👍
CryptoCheck
BINANCE:SOLUSDT

SOL - Solana follows THIS FRACTAL📉Hi Traders, Investors and Speculators of Charts📈
Solana has made some great increases, and it's retraced back to support levels.
By looking at the Drop-and-Pop fractal we've been watching, we can conclude tat for the short term, the support zones should hold at $140, with wicks as low as $120.
We can also take a look at moving averages to get an idea of possible wick zones.
We should continue to trade above the 50d moving averages (green) for the price to remain bullish. Losing the 50d will be a bearish indicator:
"Overbought" flash in the weekly usually takes us into a short term correction phase, with prices trading closer to the green trendline:
If you found this content helpful, please remember to hit like and subscribe and never miss a moment in the markets.
_______________________
📢Follow us here on TradingView for daily updates📢
👍Hit like & Follow 👍
CryptoCheck
BINANCE:SOLUSDT
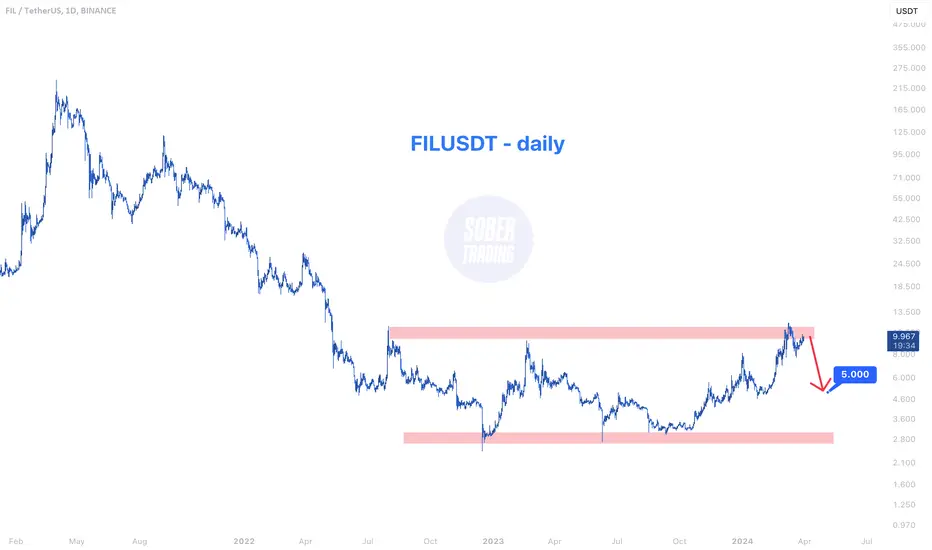
FIL - daily bearish signsFIL, after a substantial drop from its all-time high, showed some recovery. However, it seems to have met a strong resistance zone it couldn't breach. From this vantage point, it looks poised for a potential fall, possibly retracing back below the $5 mark again. This could represent a significant move for those keeping an eye on FIL, suggesting a bearish outlook in the near term.
ATOM - Trading The Range 📦Hello TradingView Family / Fellow Traders. This is Richard, also known as theSignalyst.
📦 ATOM has been hovering within a big range between $5-$6.5 support zone and $15-$16.5 resistance zone.
📉 Currently, ATOM is in a correction phase and approaching the lower bound of the range.
📚 As per my trading style:
As #ATOM approaches the lower bound of the range, I will be looking for bullish reversal setups (like a double bottom pattern, trendline break , and so on...)
📚 Always follow your trading plan regarding entry, risk management, and trade management.
Good luck!
All Strategies Are Good; If Managed Properly!
~Rich
