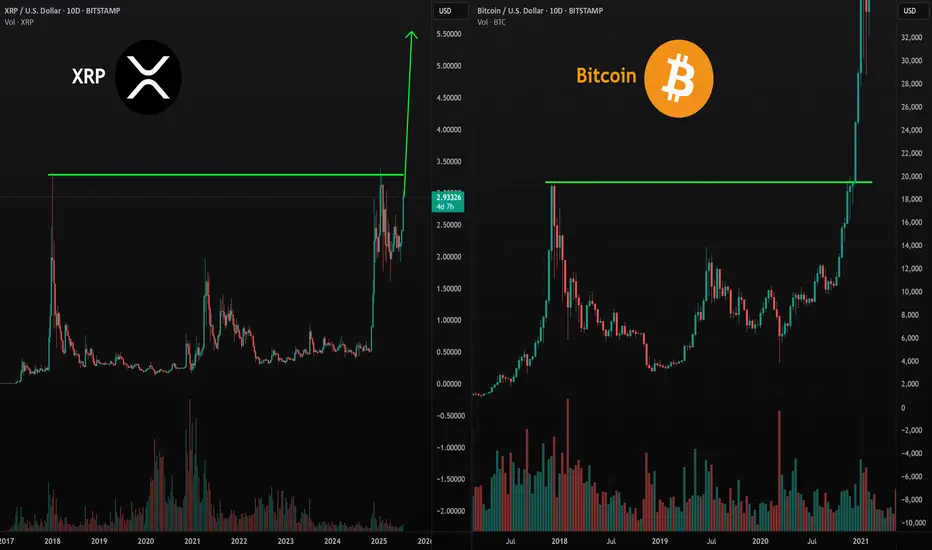
Why XRP Holders Are About to Get Super Rich!I believe XRP is heading into a mass adoption cycle—something even bigger than what Bitcoin saw in 2021. We’re looking at a truly sustainable growth pattern fueled by a longer accumulation phase and crypto being adopted and invested in by major institutions.
This means we could see XRP skyrocket to $22 as my lowest target— and potentially even well over $100 per coin . This coin is truly ready for massive things. Be prepared!
Let me know what you think: Will XRP crash? Or is it heading for mass adoption? Share your thoughts in the comments below.
As always, stay profitable,
– Dalin Anderson
Altcoins
Notcoin 1884% BullishWave · Conservative Target · Will Go HigherThe first very easy target for Notcoin in the coming days will give you 230%, which is amazing because we only saw something similar in May 2024 and rather than just the start it was the end.
Then higher Notcoin will move, 100% certainty, to give you 640% profits or more. This is still easy and short-term, within 30 days or a month. Can extend a bit but there is more.
Long-term for us is within 6 months and this is the time-horizon for all targets on this chart to hit. Very easy indeed. We have 1,057% and 1,884%. Nothing extraordinary, in fact, these are just conservative projections. Notcoin is likely to move much higher in the coming months.
We looked at this pair and recommend 7X to maximize profits, it still isn't too late. If you do decide to approach this market with leverage after reading this, remember to consider the potential risks. Leveraged trading is for experts only and can result in total loss. I cannot be held responsible for your actions. If you lose money and I am responsible, then I am responsible also for any and all wins. But, we are all adults.
This is not financial advice. Just my opinion based on more than a decade of experience with charts, trading, Crypto and Bitcoin. This is not financial advice but you can bet your house that Crypto is going up. Time is running out, Notcoin will be really strong in this bull market. Do what you have to do to take advantage of this information. You will be happy with the results.
Thank you for reading.
Namaste.

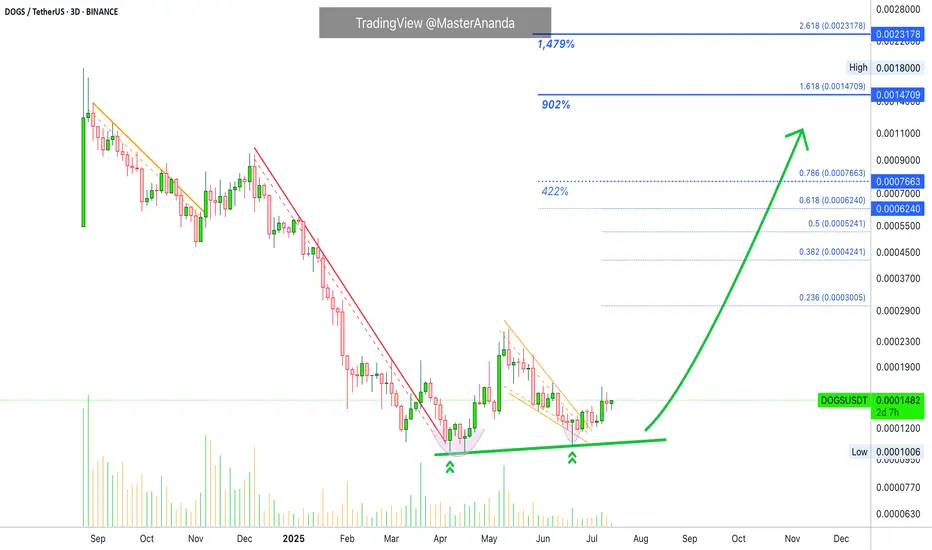
Dogs Update · 1,479% Easy Profits Potential TargetThe first target will be an easy target of 422%. We already talked about creating a position with leverage on this trade. This position is now live and secure, safe and effective, highly profitable with 8X.
Now we are looking at it again because there is still time to have a good entry before a major run. Time is running out though, we have only a few days left. After just a few days, prices will be 100% to 200% up, and then we will see more, more and more. Sustained long-term growth. Additional growth. Higher prices, higher highs, higher heights, forever more.
The bottom and reversal pattern here started in March and the bottom range was activated in February, which means the market is now 162 days sideways at bottom prices. This much consolidation at a market low will result in a massive wave of growth. This consolidation is already over, we just need to see the effect on the market, price and chart.
In a matter of days, one single candle with 3 digits green will change everything and this will happen to hundreds of pairs at the same time. Low prices will be gone but it will be the start of the market euphoria, major excitement and bullish growth.
This is a friendly reminder just to let you know that it isn't too late, but we are running out of time. You will do great. I promise. You have what it takes. It is simple when you know what to expect. Expect growth. Knowing this, you already won.
Namaste.
Arbitrum 1,322% Profits Potential · Easy · Crypto is Going Up!This will be intense, truly intense. Arbitrum will perform one of the strongest bullish waves in the entire market. Just one red session and we are back up, back green and ready to move. It will be huge.
This is a big project and yet, we have a standard, easy target, around 1,322%. Such huge potential for growth and there is no doubt now, 100% certainty; you can bet your house on it. We are going up.
When the market goes down, it is unforgiving, it gives no break. It goes down and down and down long-term.
When the market goes up, it is unforgiving, it gives no break. It goes up and up and up, many times higher and much more stronger than any previous bearish wave.
So the market is biased in favor of going up. Just as new all-time lows can be hit on a crash, new all-time highs will be hit during a major bullish impulse. Mark my words.
We are not talking about just "another bullish wave." Not just an "advance." We are talking about the strongest, biggest, longest, exciting and highly profitable bullish phase the Cryptocurrency market has yet to offer. We are talking about exceptional exponential growth. We are talking about a bull market like nothing you've seen before.
Get ready because Crypto is going up.
Namaste.

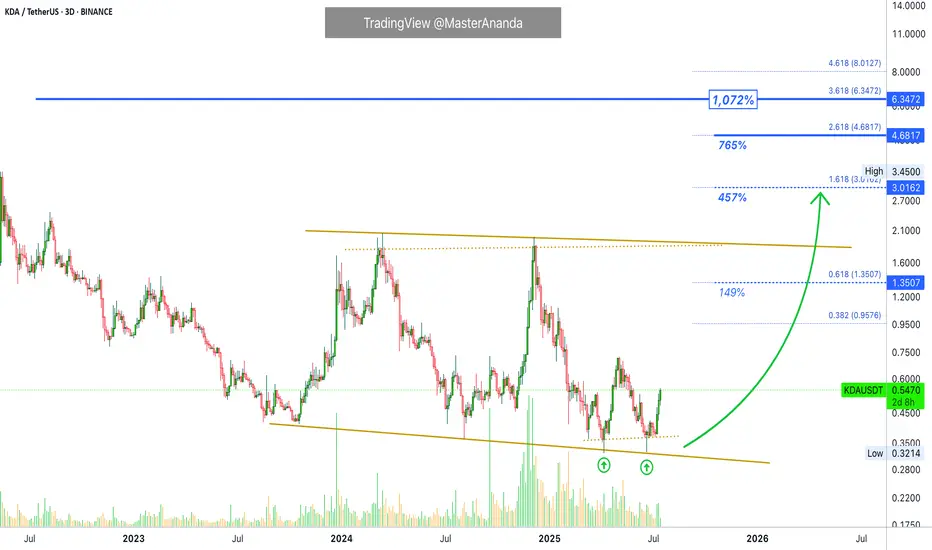
Kadena · 457% First Followed by Additional GrowthWhat should we be calling the first impulse? It is already here.
Good afternoon my fellow Cryptocurrency trader, the altcoins bull market is now.
It is already here. We are now seeing marketwide bullish action. There is only one variant present, one possible outcome only; increased bullish momentum. From now on, you will see daily bullish momentum grow.
Kadena is ready to move higher. The current move will produce a minimum of 450%, and this won't be all this project has to offer, this will signal the end of the first portion of the bullish wave. There will be additional growth after a stop after this first target is hit.
Since 9-July we have only full green candles. There will be more, more and more. Trust and you will be rewarded. Hold now, buy (yesterday), sell in several weeks or in a matter of months. You can sell—when prices are high—just to buy back lower when the correction comes. You can sell and move to a new trading pair because there will be hundreds of options blowing up.
This is just a friendly reminder. The time is now. 100% certainty.
We are moving ahead. Profits are yours to make.
Namaste.
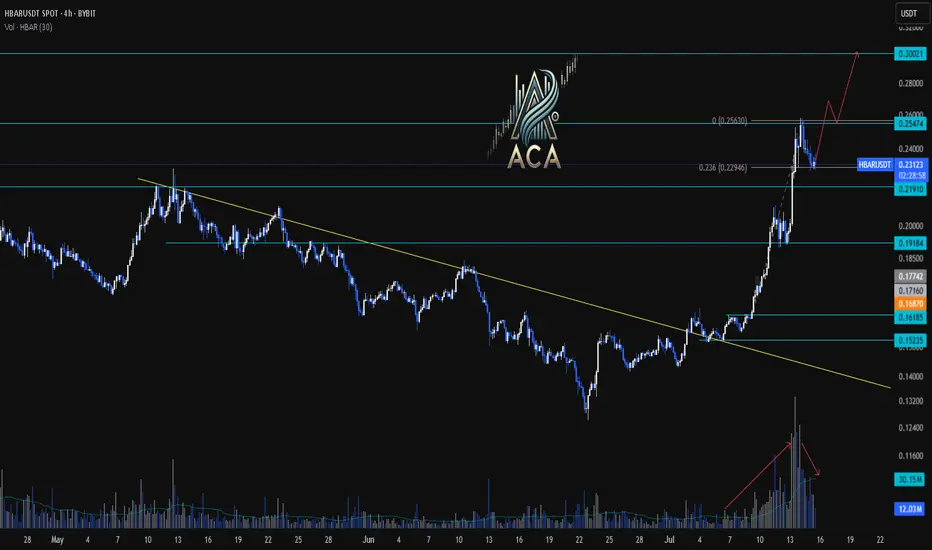
HBARUSDT 4H Chart Analysis |Volume & Fibonacci Reaction in FocusHBARUSDT 4H Chart Analysis | Volume & Fibonacci Reaction in Focus
🔍 Let’s break down the latest HBAR/USDT setup, highlighting a clear technical reaction and a new opportunity on the horizon.
⏳ 4-Hour Overview
HBAR has completed a strong impulsive leg after breaking above the RR2 of the key reversal trendline, supported by notable volume confirmation. This impressive surge was then followed by a corrective leg—a healthy sign for bulls, especially for those who missed the initial breakout.
📉 Corrective Phase & Fibonacci Support
- The current corrective leg is characterized by decreasing volume, suggesting profit-taking rather than heavy selling pressure.
- Notably, price has reacted firmly at the 0.236 Fibonacci retracement level, aligning with classic pullback zones for continuation setups.
- This volume pattern shows traders are waiting for the next major move rather than exiting positions.
🔺 Bullish Continuation Setup
- A strong candle close above the $0.255 level on either the 1H or 4H timeframe will serve as a clear bullish confirmation.
- Such a breakout may pave the way for another impulsive leg upward, with the first upside target identified near $0.30—roughly 19% higher from the recent candle close.
📊 Key Highlights:
- The prior trend reversal was validated by surge in volume and momentum.
- Volume decline during the correction favors further upside rather than distribution.
- Price is respecting key Fibonacci levels, hinting at trend continuity.
- A confirmed close above $0.255 unlocks the next target at $0.30, marking a potential 19% move.
🚨 Conclusion:
HBAR is showing textbook trend continuation signals. For those sidelined after the initial move, the current consolidation offers a safer re-entry point, with actionable confirmation above $0.255. Stay alert for a strong candle close and keep the $0.30 target in view as bullish momentum builds.
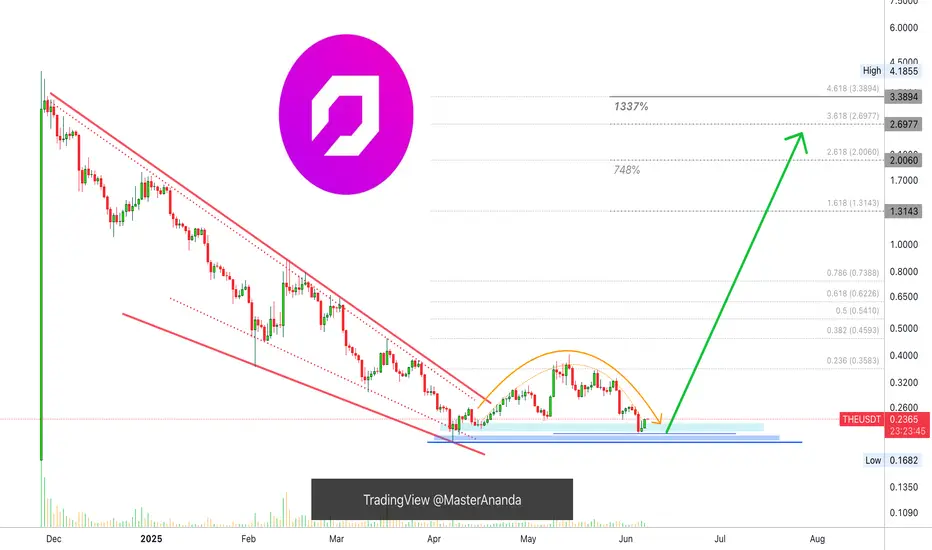
Thena: Hold Until The End (1,337% Profits Potential)Which one will you take? Endless opportunities the Cryptocurrency market has to offer; which one will you take?
Doesn't need to be just one can be many. You can choose many pairs to trade.
Countless opportunities are available now and these will be generating huge profits in the coming days.
The first burst forward will produce 100%, in 1-3 days. And this will be followed by sustained long-term growth. It will grow so much and for so long, that you will become bored. It won't be exciting anymore... Until the correction of course.
Thena here has more than 1,000% potential for growth. Right now this pair, THEUSDT, is sitting on a higher low or double-bottom, in this case it is the same.
This is the same pattern produced by Ravencoin, remember?
That project that grew more than 150% in a single day. "Altcoins Market Bull Market Confirmed, Ravencoin." And it is true, watch everything grow.
This same pattern is present on so many altcoins, not all of them but many and we know exactly what will happen next because what one does, the rest follows.
THEUSDT is about to go bullish, can take a few weeks or less, a few days.
When the bullish wave starts it will go for months, months of sustained growth. You simply hold until the end.
Thank you for reading.
Namaste.
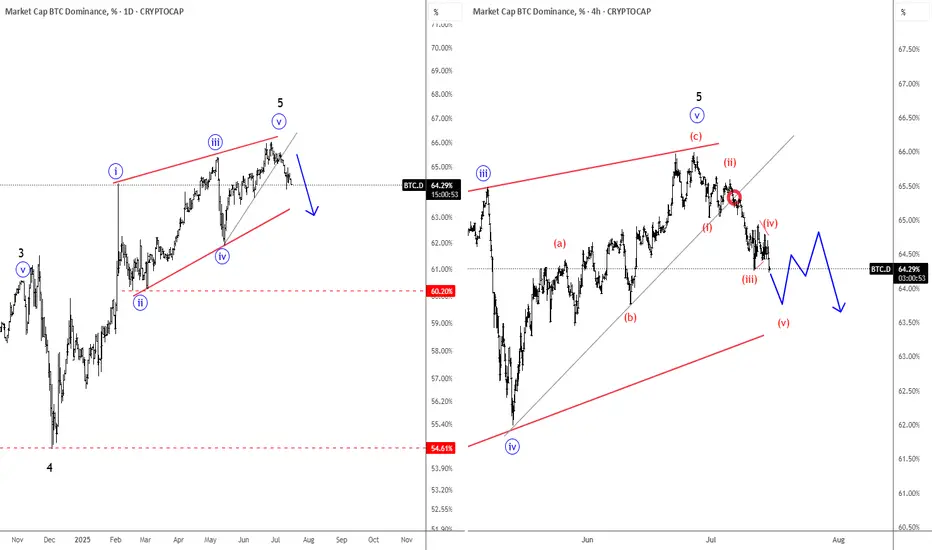
Bitcoin Dominance Found The Top; ALTcoin Dominance Stepping InHello Crypto traders! BTC.Dominance is falling in an impulsive fashion after we spotted the top within the wedge pattern. Now that is trading in wave (v) of a five-wave impulse from the highs, it just confirms a bearish reversal, which indicates that ALTcoin dominance is stepping in. And with still bullish Crypto market, we might be in the ALTseason.
An 8.8:1 risk-to-reward trade setup for AVAX.A small pullback is likely at this point. This setup offers an 8.8:1 risk-to-reward ratio with a target of 50.
Entry at 20.8,
Stop loss at 17.50
Target at 50.

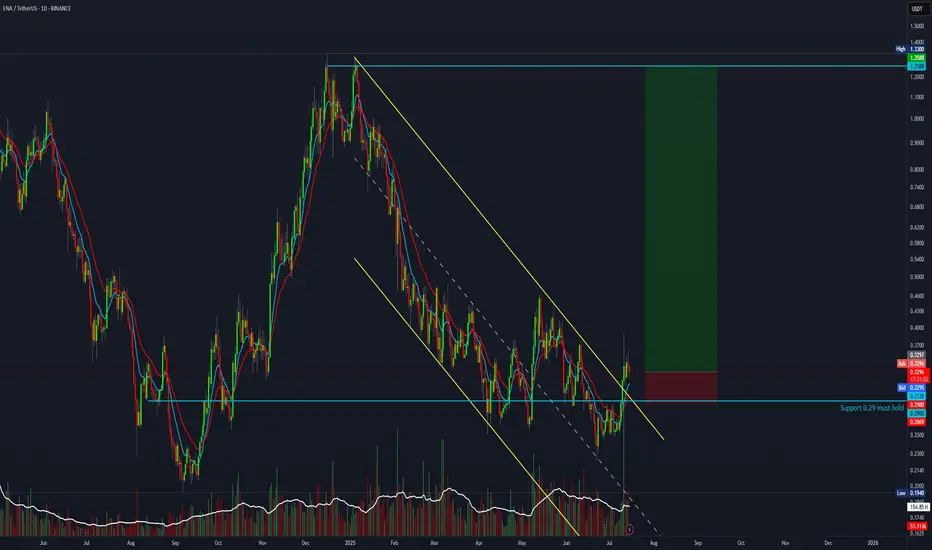
21:1 risk-to-reward trade setup for EthenaIs it time for the bulls to push it higher? This setup offers a 21:1 risk-to-reward ratio with a target of 1.25.
Entry 0.32
Stop loss 0.25
Target 1.25
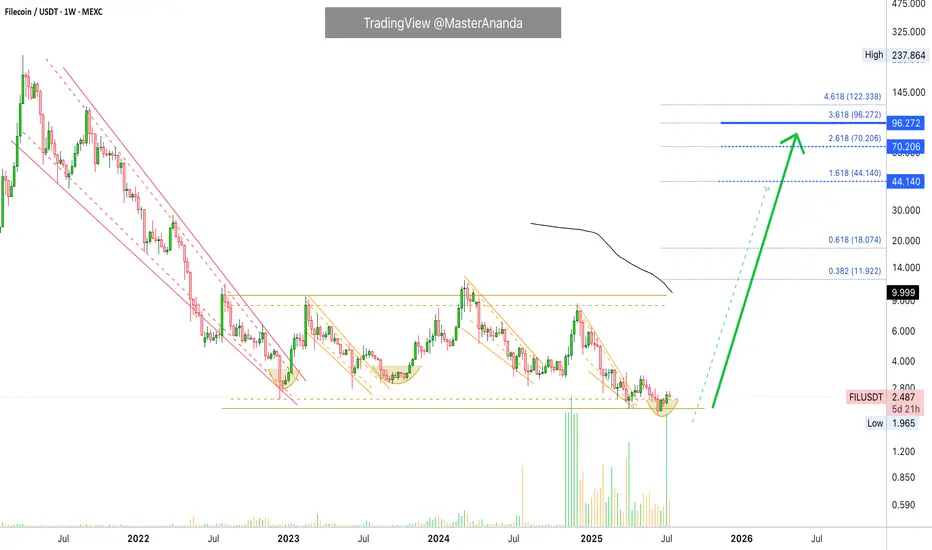
Filecoin Hits Bottom · 3 Years Long BD · Volume Signal · MACD &I think what is really nice about MEXC is that it truly reveals the bottom through volume. The changes in trading volume in this exchange are so pronounced that you can never go wrong. Look at Filecoin, extremely high volume in November 2024, right before a bullish wave. Then again, incredibly high volume last week, July 2025, right before a... Right before a major, major bullish wave, or else trading volume wouldn't be so high. It is this high because whales are buying with margin on this exchange.
Ok. A classic signal, 100% original. MA200 starts curving down strong; prices start to move up to meet this indicator, there will be a cross. So when MA200 starts diving deep down coming from a high point, the low is in, the bottom is in and the trend is about to change from bearish to bullish. Filecoin is about to start growing.
These are two signals, both very strong. Let's add another one. Bullish divergence with the MACD and RSI. Weekly, long-term. This makes these signals very, very strong.
FILUSDT weekly RSI hit bottom June 2022, in June 2025 (three years later) it produced a higher low.
FILUSDT weekly produced a major low December 2022, in June 2025 it produced a lower low. That's a strong divergence.
FILUSDT weekly MACD hit bottom February 2022. There is a extreme higher low in 2025 and also a bullish cross.
Needless to say, the bullish cross indicates the market is about to change. This matches the volume signal, the MA200 signal, marketwide action, the bullish divergence with the RSI, Ethereum and the rest.
Everything is bullish if you look deep enough. Bullish means potential for growth when prices are low. Bullish potential. That's what we are looking for. Filecoin is about to turn-up.
Namaste.
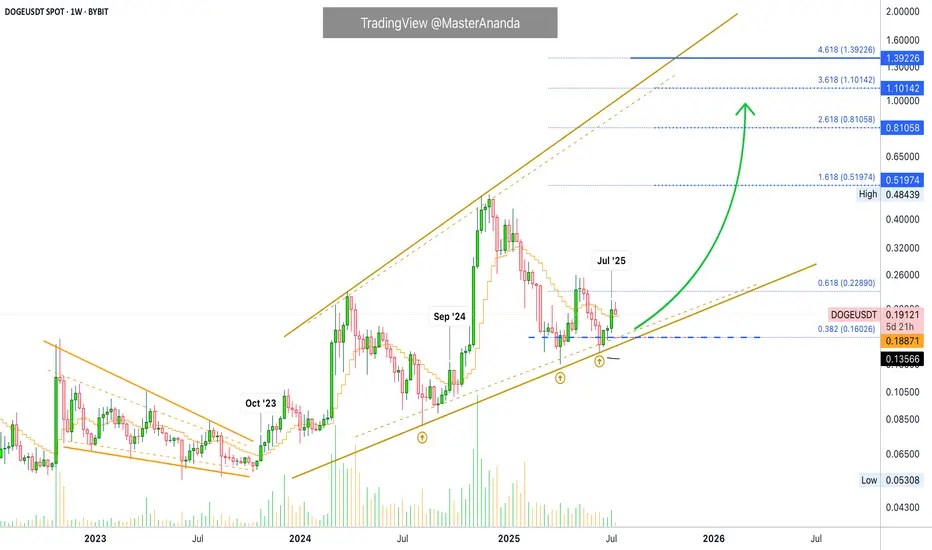
Dogecoin's Bullish Wave Over? Higher High Beyond $1.11111Nope, it is only getting started... Do you see that tiny speck of a black line on the chart? Way below the current candles around 0.135. That's MA200 weekly. Dogecoin is on the bullish zone 100% already confirmed. The bullish wave is only getting started.
DOGEUSDT is trading weekly above EMA13. Watch what happened in September 2024 when Dogecoin broke above this level. Or further back, October 2023. Both instances, there was a bullish impulse; both instances, a higher high.
Dogecoin moved and closed above EMA13 last week, July 2025. Guess what will happen next? A new bullish impulse and a strong higher high.
Patience is key, the market is set to continue growing long-term. No, the uptrend is not over, it is only getting started.
Thanks a lot for your continued support.
Namaste.
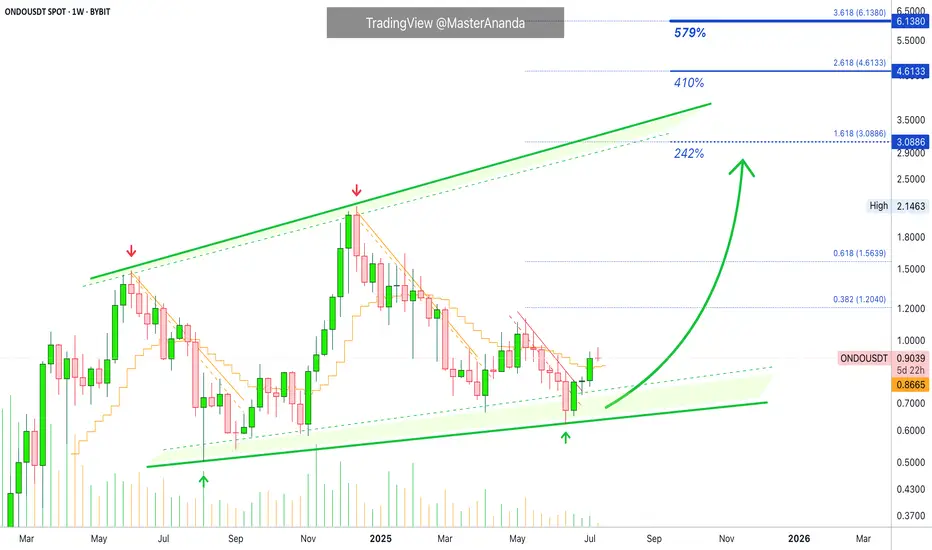
Ondo: The Bullish Wave is Over? 410% - 579% Profits PotentialONDOUSDT managed to produce three weeks closing green with the last one conquering EMA13. When this happened back in November 2024 there was a period of continued growth. Look at it in this way; the week is young and the market is taking a break, growth will resume in a matter of days. This same week more green and continued green long-term.
When ONDOUSDT broke above EMA13 last year, it produced a total of six weeks of straight up. Now, back then we were looking at a small jump, today we are looking at a very strong bullish impulse. The 2025 bull market in full force.
Three green weeks is only the start. We are about to experience 12-24 weeks of bullish action. We are looking at the bottom, bullish momentum is yet to grow. It is still early, but early won't be a reality for too long. Buy and hold.
We have two targets that are interesting: 410% and 579%. These can be hit within 3 to 6 months. Allow for retraces and swings on the way up.
Namaste.
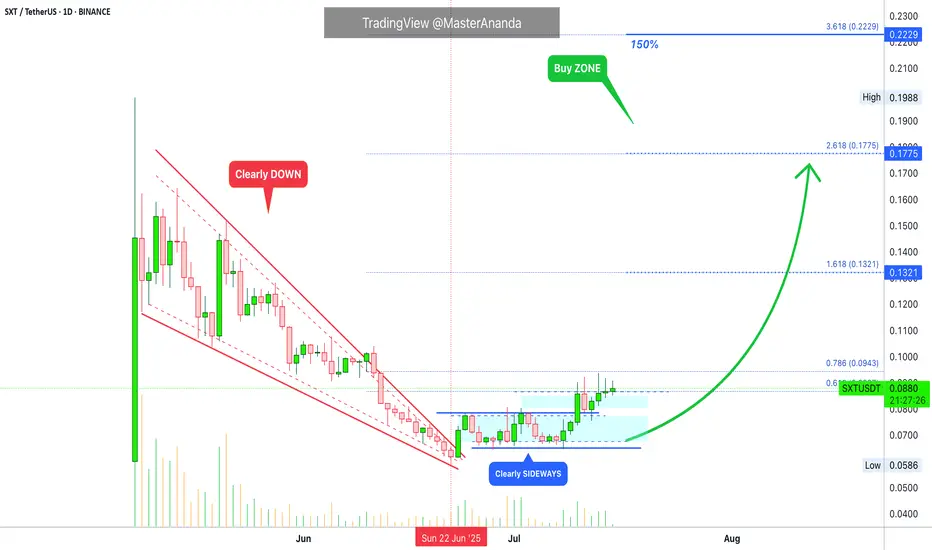
Space and Time: Trading Strategy · 1 BTC = 2.5 BTC (PP: 150%)Are you interested in a double-up?
Let's use round numbers to keep it simple.
Trade: Buy 1 BTC STXUSDT = Get 2.5 BTC (150% profits).
Time duration: 20-40 days.
Risk: Very low (time).
The risk can be calculated in time. Since this is a spot trade, you cannot get liquidated. In the worst case scenario, you wait. This is the only risk if the chart breaks down. If it works as planned, you can get 150% profits (250% earnings) by selling on target.
Time duration is "short-term." Which is within 30 days. Here I set 20-40 days to allow for any unexpected variations.
The trade is any amount you want. $1,000 USDT bought at current price, say 0.0890, would result in $2,500 USDT if selling happens at 0.2229. This is just an example of course for illustration purposes.
The trick is to be ready to wait. If waiting is hard, one can be use diversification to be entertained. Say, $250 USDT on four different pairs that have good potential for growth. Can be $2,500 USDT by 4 if the capital is $10,000. Or $10,000 USDT by 10 if the capital is $100,000. There are many different ways to approach the market.
A different approach: $10,000 in. The market (pair in question) grows 25%. Close position (sell). Result = $12,500. Find new pair and repeat.
The stop-loss can be a tight one at 5%. If prices drop 5% close position. Result = $9,500. Try again with a different pair. The stop-loss can be set at 10%, 15%, 20%, based on the chart, etc.
There is also a trailing stop. Adjust the stop below a certain level as prices rise, after you catch the rising trend. This is a bit more advanced and it is mainly used by profitable traders.
Patience is key. If you can wait, you can win.
Space and Time (SXT) is set to grow. How you approach this market is up to you. Remember to do your own research and planning. This is not financial advice. I am sharing for learning and entertainment purposes only.
Thank you for reading.
Namaste.
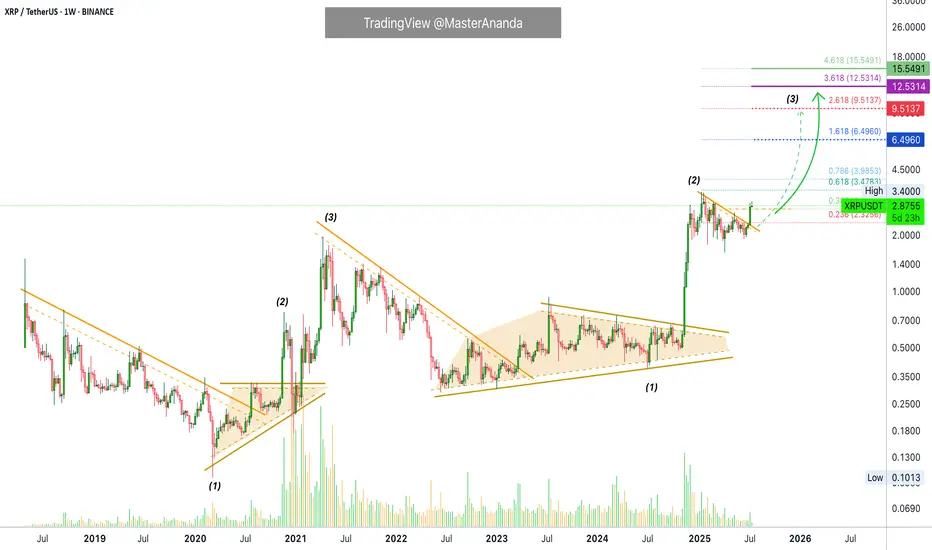
XRP $6.5, $9.5, $12.5 & $15.5 · Which One?XRP broke a small local downtrend and managed to close above a small resistance zone around $2.76. It managed to do this on a full green candle with rising volume.
XRPUSDT weekly is currently trading above all moving averages, extremely bullish: MA200, EMA377, EMA233, EMA89 and the rest.
If we look at a bull market cycle as a series of three steps, we have the first two missing the last one. Compare current action with 2021 while noticing the 1,2,3 numbers on the chart. This leaves us wondering about the next target: How high can XRP go in its next bullish move?
It seems something extraordinary is brewing behind the scenes, I can feel it. What we've been saying all along but rather than just words, a new feeling came up. "It is not the same to live through an event vs talking about it." That kind of feeling.
I can continue to say that market conditions are extremely positive now especially when we compare it to several years ago. But we have not seen the effect this positive conditions will have on the market, the price of the different projects and the charts, but we are getting close.
XRP has big plans and continue to grow, expand and evolve.
The 2021 bull market from bottom to top produced more than 1,800%. In 2025, if we start counting from the July 2024 low, a target of $6.50 would mean a total of ~1,585% growth. Market conditions are better now so we can aim higher, expect more.
A target of $9.51 sounds great, this would mean a nice ~230% from current price and from the same low as before, a total of ~2,400%. This sounds better but we can do more.
The next two targets based on an extension of the current trend would lead to $12.5 and $15.5. I'll let you calculate the potential yourself.
$6.5, $9.51, $12.5 or more; whatever the market ends up giving us, we are happy to be part of this adventure and we are always grateful for the amazing results.
Aim high. I will be here reading the charts live when we are getting close to the top. There will be time to sell, time to adapt, time to decide. There will be enough time for everything if you start now. Prepare now and success is yours.
We are early for the last phase of the XRP 2025 bull market. The first half is in, we are due the second half; it will be great.
Namaste.
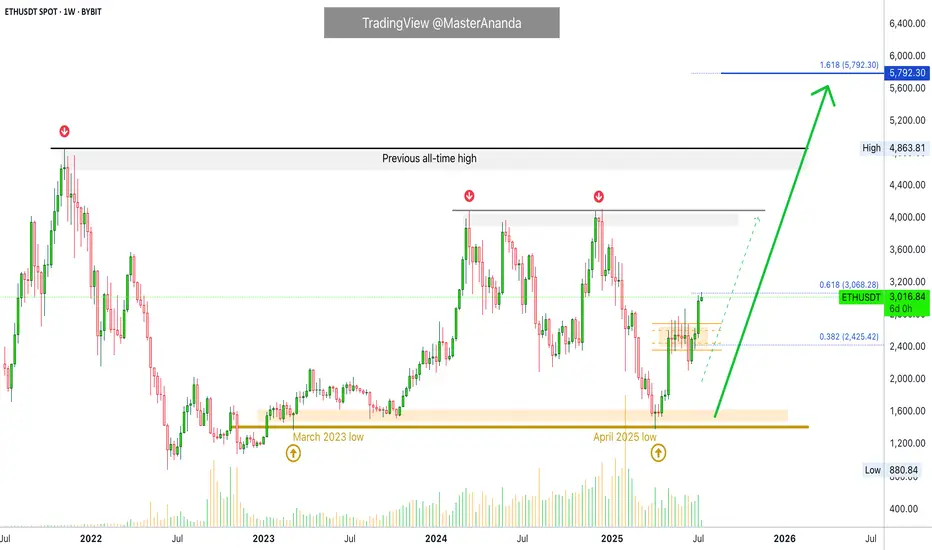
Can a Bear Market Start With Ethereum At $3,000?Ethereum produced sideways action for 49 days, 7 weeks. Immediately after seeing this I realized the next logical step was a bullish breakout, and the market moved up. But this isn't all. Ethereum is still trading at $3,000, more than $1,800 away from its all-time high.
Now, thinking about the doubt that always creeps up when the market becomes bullish confirmed, I want to clear things up if at least for you. While others can continue to doubt and will continue to do so, many others will even SHORT and lose everything, you will be happy knowing that the market will experience additional growth. You will also be making profits as the market grows. You will be happy because you know for a fact, based on data, that we are set to experience sustained long-term growth.
A bear market can only develop after a bull market. A bull market ends in a major high or new all-time high. Current conditions for ETHUSDT are far from being "peaky." There is no new all-time high. Actually, prices are still relatively low.
First Ethereum needs to challenge its previous all-time high, create a new one and then we can talk about a bear market or correction. We know for a fact that Ethereum is bullish based on recent price action and the chart. We know for a fact that Ethereum will grow because Bitcoin is already high up. Ethereum is the #2 Crypto and what Bitcoin does it tends to follow.
Bitcoin is super strong but this is not to be confused as weakness. Weakness comes when the market has been growing for too long, growth becomes heavy and a drop happens next. Strength happens when the market has been sideways for months, breaks up and produces a major advance (now). This type of pattern predicts additional growth.
Bitcoin is the king and what Bitcoin does the rest follows. You can expect additional growth.
The reason why the bullish cycle is not yet over is because prices are still too low. Many altcoins are trading near all-time lows. Think about it. A bear market develops from all-time highs and bull markets develop from all-time lows. We are only at the start of a major bullish cycle, phase and wave.
The proof is in the chart. A major low was hit 7-April 2025, the lowest since March 2023. This marks the end of the correction and the start of the 2025 bullish phase. I don't know if Ethereum will grow for years or only for a few months. I know with 100% certainty that the Cryptocurrency market will continue to grow. You can bet your house on it.
Thanks a lot for your continued support.
Namaste.
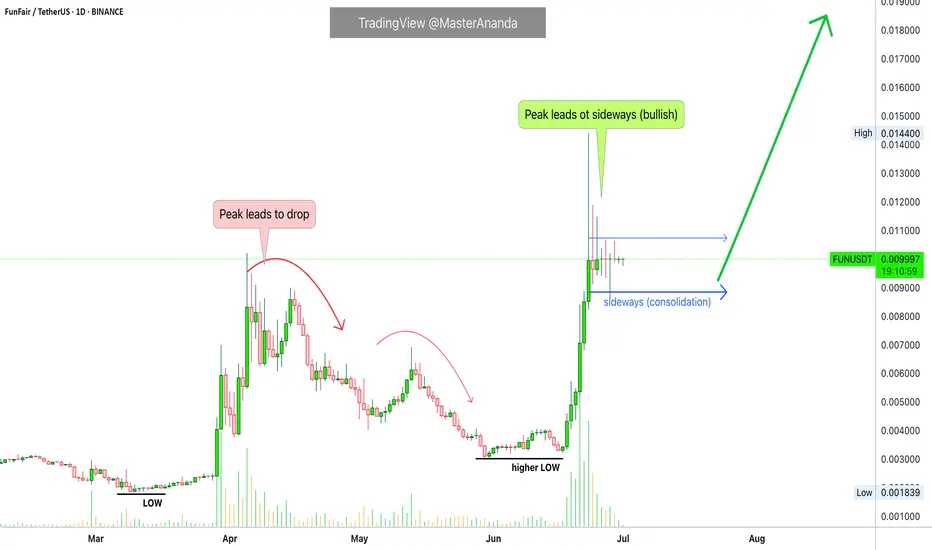
Altcoins Bull Market Confirmed —Fun TokenEvery time there is a strong rise immediately what follows is a correction, always, unless of course you are in a bull market. Here you have the most revealing signal of all: Price stability after a major rise, sideways rather than bearish.
Fun Token (FUNUSDT) produced a more than 340% bullish wave. What happens right after the peak? If you guessed a drop I don't blame you, that is what normally happens but here things are different. Since the market is growing and set to grow strong for long, after this major rise instead of a crash we have consolidation, sideways. This reveals that participants are not selling, they are not selling because they know the rise is not over, there will be additional growth.
Go back in time and look at 30-50 altcoins and see what happens after each strong bullish wave, a correction. Now, do the same but focus on a bull market; what happens after a strong bullish wave? Some consolidation followed by additional growth.
The altcoins bull market is already confirmed.
Thanks a lot for your continued support.
Namaste.
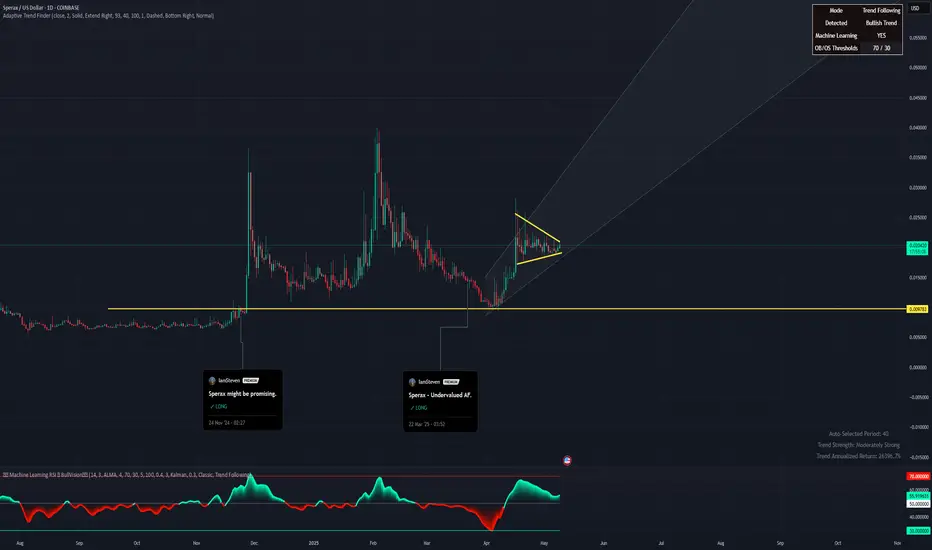
Sperax: Bullish pennant.Sperax is consolidating in a bullish pennant pattern after a strong recovery rally off the March lows. Price action has tightened between ascending support and descending resistance, forming a textbook continuation setup. Volume has decreased during this compression, which is often a precursor to explosive movement.
Fundamental Catalysts (Despite GENIUS Act Stalling):
Retail DeFi Narrative is Still Alive – While the GENIUS Act failed in the Senate, the momentum for regulatory clarity in the DeFi space continues. Future bills or executive actions could unlock capital flows to protocols like Sperax.
Deflationary Pressure —Over 13% of the total SPA supply has been burned, with more tokens locked and lost. The actual circulating supply is meaningfully lower than the total supply shown on aggregators.
SIP-70 has been passed , shifting SPA emissions from an automatic release model to a DAO-controlled emission schedule. This marks a significant milestone towards sustainable tokenomics and the preservation of long-term value.
Long-Term Accumulation – Wallet data and order books suggest that whales and long-term holders quietly accumulate during this sideways range.
Sperax remains a low-cap token with outsized potential in the next altseason if it secures even one meaningful partnership or fiat on-ramp.
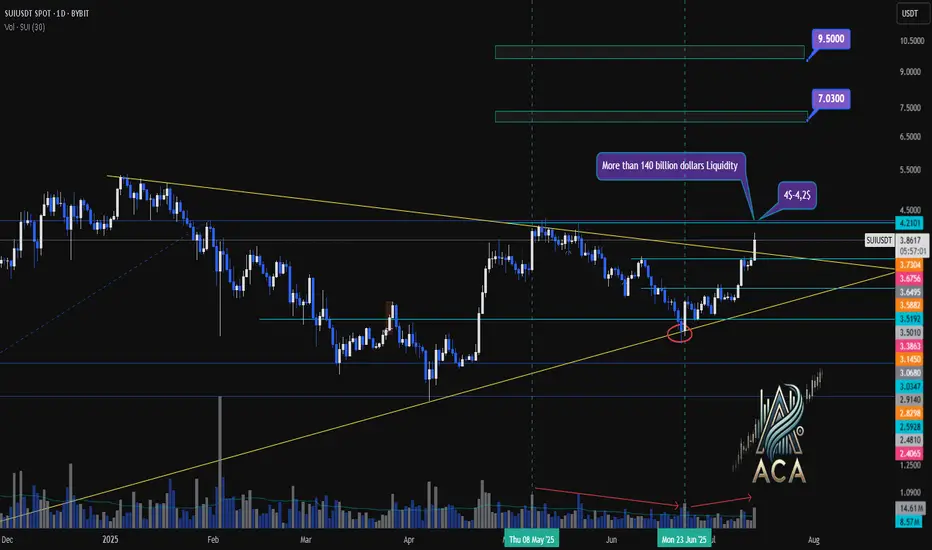
SUIUSDT Weekly Chart Analysis | Breakout Confirmed!SUIUSDT Weekly Chart Analysis | Breakout Confirmed, Massive Liquidity at $4–$4.20
🔍 Let’s dive into the SUI/USDT weekly chart after a decisive breakout from the symmetrical triangle, highlighting the critical liquidity zone and what it means for price action.
⏳ Weekly Overview
SUI has broken out of its multi-month triangle pattern following a textbook fakeout, with volume dynamics confirming renewed bullish momentum. The breakout is now awaiting daily candle confirmation for full validation.
🔺 Bullish Breakout & Key Liquidity Zone
A major liquidity cluster sits between $4.00 and $4.20, with more than $140 billion in liquidity concentrated in this range. This zone is crucial for several reasons:
- It represents a significant area where large buy and sell orders are stacked, likely leading to heightened volatility as price approaches or breaks through.
- Clearing this liquidity could unlock rapid moves toward the next upside targets at $7.03 and $9.50, as shown on the chart.
📊 Key Highlights
- Symmetrical triangle resolved with a bullish breakout, confirmed by increasing volume.
- The $4.00–$4.20 range holds over $140B in liquidity, making it a pivotal battleground for bulls and bears.
- Daily candle confirmation remains essential for trend validation.
- SUI ecosystem has reached a new all-time high in DeFi TVL, adding fundamental strength to the bullish case.
🚨 Conclusion
The breakout above the triangle, combined with surging volume and a record DeFi TVL, sets the stage for a potential rally. Watch the $4.00–$4.20 liquidity zone closely—how price interacts with this level could determine the speed and magnitude of the next move. Stay alert for daily confirmation and be prepared for volatility as SUI tests this high-stakes region.
#SUI #CryptoAnalysis #TradingView #Altcoins #ACA
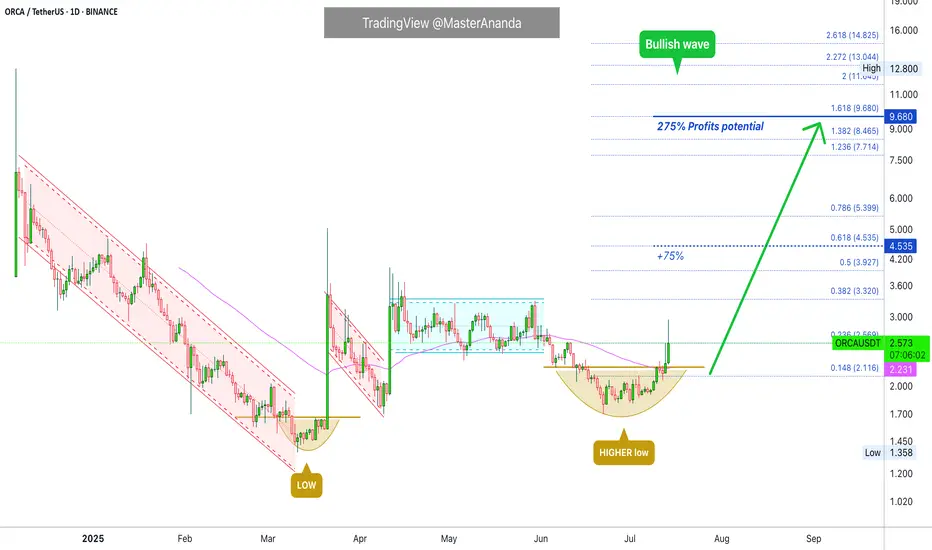
Orca Moving Fast, Altcoins Market Heats Up (Easy 275% PP)Think fast, act fast, move fast! The altcoins market is heating up and it is not for the faint hearted. Either you take action now, fast, or the market moves away. Low prices to be available never again...
Good afternoon my fellow Cryptocurrency trader, I hope you are having a wonderful day.
A bull market means up. It means growth, up, up, up, up and then higher. Yes, some pairs will retrace but that is because these pairs already moved ahead. Once the action stops on one group, another group moves forward and this pattern will continue to repeat long-term. What this means is that there will always be something going up. And this is awesome if you are a trader as more opportunities become available every single day.
Here ORCAUSDT is already bullish, we have the higher low and the full green candle above EMA55 on the daily timeframe. This is as good as it gets. An advance is confirmed so this becomes an easy hold. But, since we are looking at it short-term, after our target hits we collect profits and move on.
Not all trades are short-term not all trading works this way. We have long-term chart setups, leveraged positions, short-term spot and so on. Make sure not to confuse one with the other to avoid mistakes.
Some projects we catch the bottom and let the bull market unravel, others we enter "in-the-action" collect profits and move on.
Whichever way works for you, that's up to you. Some people like to be relaxed while trading others want to take action.
Thanks a lot for your continued support.
Namaste.
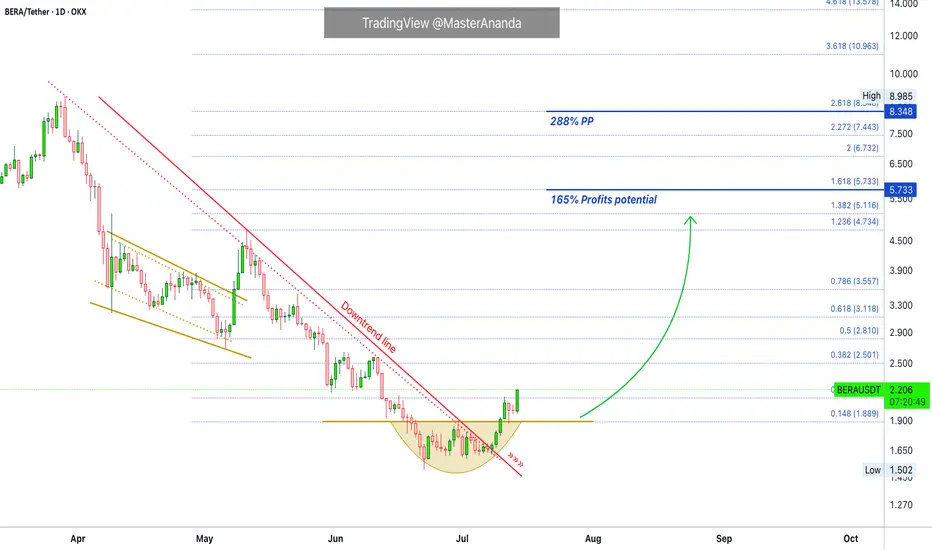
BERACHAIN Starts A Major Advance, Moving Fast (165% - 288% PP)The action never stops in a bull market. When one pair retraces a new pair starts to move forward. Choose wisely.
BERACHAIN (BERAUSDT) looks bullish to me. You can agree as I will show you the proof.
The downtrend has been broken and it is no surprise this happened after the 22-June low. We know this date to be a major turning point for many altcoins, it has been proven by the charts.
To keep it simple and short, because prices are rising fast, once the downtrend ends prices grow.
Here we have a short-term trade setup. We should see higher and higher in the coming hours and days. The bullish signals are fully confirmed; BERAUSDT is ready to move ahead. The main target can be seen on the chart. We are going for 165% but remember, it can go higher.
Thank you for reading.
Namaste.
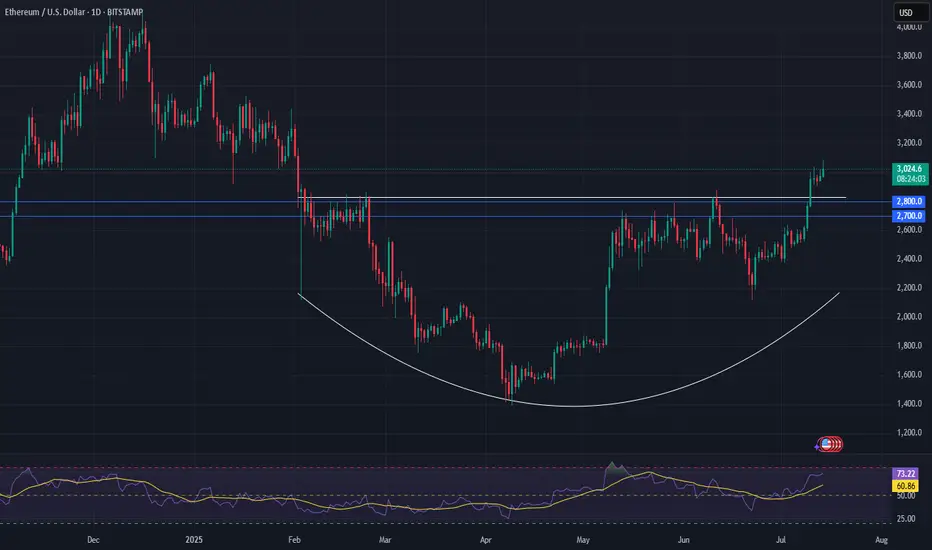
Ethereum Set for a Major Move — Watch $2,700–$2,800Epic Base Forming:
Ethereum is building a powerful base, and the fundamental dynamics have shifted significantly in recent weeks. With ETF fund flows hitting new highs, institutional interest is clearly growing.
Tight Setup for a Short Squeeze:
Meanwhile, the futures market shows a near-record short position, creating a high-potential setup for a massive short squeeze. Even without the chart, this kind of positioning mismatch is rare—and explosive.
Technical Watch Zone:
Ethereum is pressing into key resistance from a rounding bottom. The critical level to watch is $2,700–$2,800. A clean breakout here could ignite a sharp rally, with $4,000+ back on the table in short order.
This is a textbook setup—fundamentals, sentiment, and technicals are aligning.
#Ethereum #ETH #Crypto #TechnicalAnalysis #ShortSqueeze #ETFFlows #MarketSetup #Bullish #Altcoins #CryptoTrading #WatchList
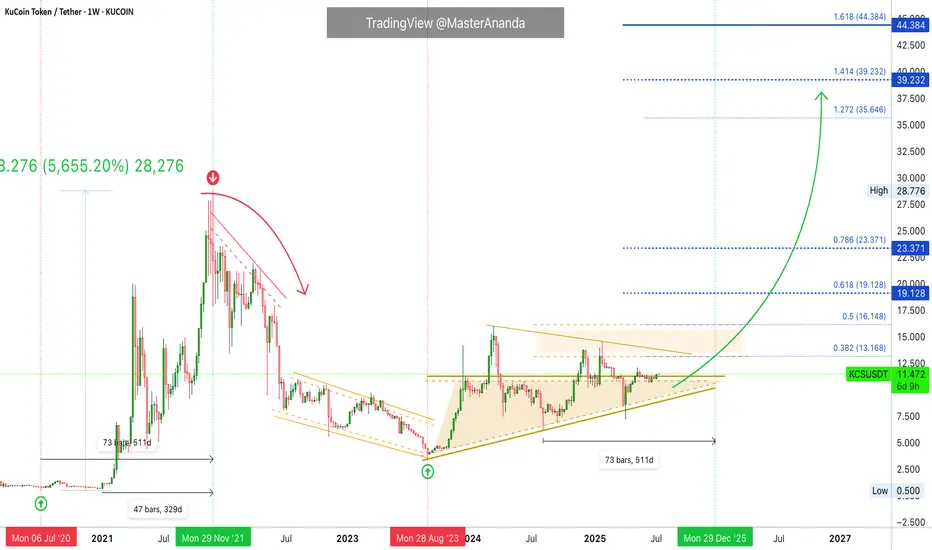
KuCoin Token (KCS) Full Analysis · Past Cycle & PresentKCS is preparing for something really nice, very similar to 2021. In 2021 KuCoin Token grew 5,655%. From 0.500 to 28.77. The entire move from bottom to top lasted 511 days, the bottom being around July 2020, then the market went sideways before the bullish phase. The meat of the move happened in a total of 329 days.
If we take the current cycle bottom to be around August 2024, 511 days gives us a date of 29-December 2025. In 2017 Bitcoin peaked around December. So this is a good date.
I cannot calculate the analog using the 329 days for the "meat of the move" because the bullish breakout is not yet in place. But, late 2025 is what we are aiming for mainly for the next all-time high across the market. We remain open to see this go beyond and reach 2026 but this is something that we will have to wait and see. For now our focus is on what the data provides.
Actually, many pairs, as we saw some weeks ago, are giving out strong signals pointing to Q1-Q2 2026 for their top. Others late 2025. So we have mixed signals and that's normal because the market is really big right now. Not everything can peak at the same time on the same date and not everything hit bottom at the same time.
KuCoin Token is a great example, here the market bottom happened August 2023 and we then see a clear change of dynamics. Ethereum bottomed June 2022 and many altcoins hit bottom just recently, on and on. I keep harping on this just so you know that we cannot generalize anymore. Each project needs to be considered individually if we want accurate results.
KuCoin Token (KCSUSDT) has been bullish growing from its base. A top happened March 2024 and a lower high late January this year, 2025. This does not invalidate the long-term bullish bias and potential.
One major resistance zone remains between $13 and $16, matching the last two peaks just mentioned. We will never wait for "confirmation" here as it would mean a lost opportunity. The market will grow and will break this resistance zone easily and continue higher likely to reach new all-time highs.
So this resistance range, rather than a level that needs to be conquered to confirm a bullish bias, can be taken as weak targets. By weak I mean that we do not sell here. We wait and sell only higher since the market is moving much higher it would be a waste to sell too early. One of the mistakes that can be made in this phase of the market cycle.
Hold strong. Everything looks good. There is huge potential for growth.
$44 is a great target but there is also $69. Which one to choose depends on how the overall market is doing and the date these targets are hit (or missed). For example, if KCS is trading near $40 in just two months, we can aim higher. On the other hand, if KCS is trading around $40 in December, then we can start to consider taking profits.
Of course, this is just a brush-off, you need to do your own research and thorough planning.
Namaste.