Top Altcoins Choice —Your Pick · Bitcoin Hits New All-Time HighBitcoin is once again trading at a new all-time high and as this happens the altcoins go boom.
The first instance circled around the fact that Bitcoin was strong and range trading between $100,000 and $110,000. When Bitcoin goes sideways within a bull market, the altcoins tend to blow up, and blow up they need. Now, when Bitcoin moves to hit a new all-time high and keeps growing; the 2025 Cryptocurrency bull market is fully confirmed.
» Which one is your favorite altcoin trading pair?
» Which project you think will grow the most in 2025 & 2026?
» What is your TOP ALTCOIN CHOICE?
Top Altcoins Choice —Your Pick
Leave a comment with some of your favorite altcoins pairs, the ones you like most and I will do a full analysis for you. I will publish in my profile and also answer directly in the comments section. I will pick and choose.
If you see other commentators that have a pair that you like, make sure to boost their comment and reply. The more boosts a comments gets, higher priority will be given to the project and trading pair.
Boost this publication and leave a comment, let's get started with your TOP ALTCOINS CHOICE!
Namaste.
Altcoins
14/07/25 Weekly OutlookLast weeks high: $119,494.32
Last weeks low: $107,467.52
Midpoint: $113,480.92
NEW BTC ATH!
This is what we've all been waiting for, BTC breaks through resistance at $110,000-112,000 to set a the highest weekly close ever ($119,086). Thanks to a further $2.27B net inflows via BTC ETFs, the passing of the "big beautiful bill" flipping from a more deficit reduction stance by the US to an environment perfectly suited to risk on assets. Things are looking good for Bitcoin.
This week already in the Asia session BTC has broken above the weekly high to hit $123,100. Despite this incredible rally BTC.D has been falling since Thursday of last week. To me this signals altcoins have started to play catch up and we've seen that with ETH breaking $3000 (+14% relative to BTC).
I would like to see BTC consolidating here above the weekly high while altcoin majors break their choppy rangebound environments and shift to a trending environment just as BTC had last week.
There are also major data releases this week:
Tuesday CPI
Wednesday PPI
Thursday Euro CPI
Thursday US Initial Jobless Claims
I do not expect these data releases to have a major effect on the markets in their current state due to the risk appetite we've seen in both crypto and equities, such shallow pullbacks prove the demand is there to absorb and sell-side pressure for now.
Now is an excellent time to back strong projects with great fundamentals that are breaking out from downtrends/ranges in both their USD & BTC pairs, as BTC.D drops alts can print some great returns. Beta plays of ETH & SOL can offer higher returns than the majors themselves in these market conditions too.
Good luck this week everybody!

FET – HTF Setup Primed for ExpansionFET is looking strong here from a high time frame perspective — currently sitting around $0.739, well into the discount zone of the macro trend channel.
We’ve got:
✅ Price holding monthly demand
✅ A clear swing higher low forming on the weekly and 3W
✅ Already seen the first expansion leg out of demand
✅ Now potentially loading the next move higher
Zooming out, price is still trading below the midline of the long-term uptrend channel — and a move back to the upper boundary puts targets in the $6 region, aligned with a new higher high.
📈 HTF Structure
Midline rejection flipped support
Demand tested and respected
HL printed after clean retest
370% upside just to retest the prior HH at $3.50
HTF trend structure still fully intact
This setup is also supported by the broader HTF bullish bias across BTC, ETH, and majors, which adds confluence to a potential larger expansion phase for alts — especially strong narratives like AI.
🎯 Targets
🎯 $3.50 = prior high
🎯 $6.00+ = upper channel target / next HTF extension zone
From current levels, risk/reward looks very clean.
1W:
3W:
3M:

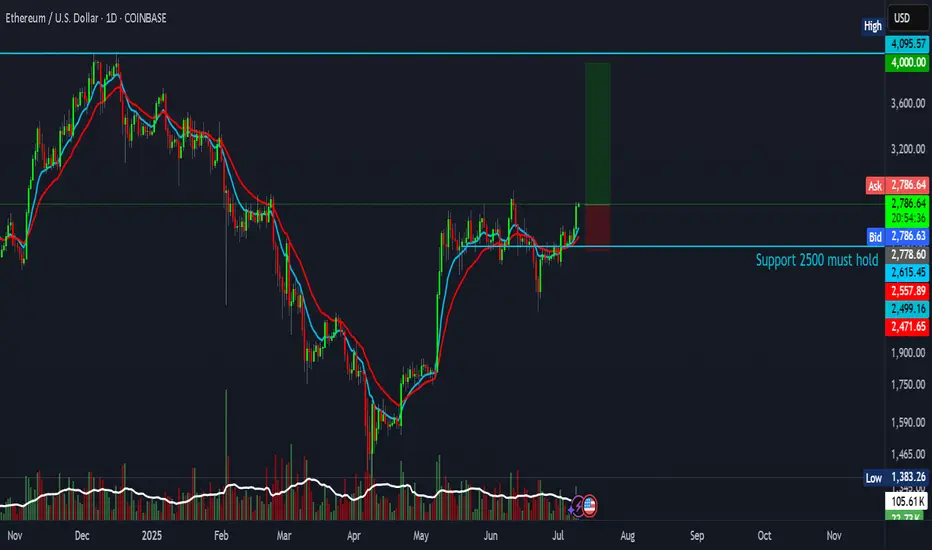
Ethereum trade setup with a 4:1 risk-reward ratioAnother attempt — and this one could be the real breakout.
This setup offers a 4:1 risk-reward ratio, targeting $4,000.
Entry: $2,780
Stop Loss: $2,471
Target: $4,000
Not financial advice.
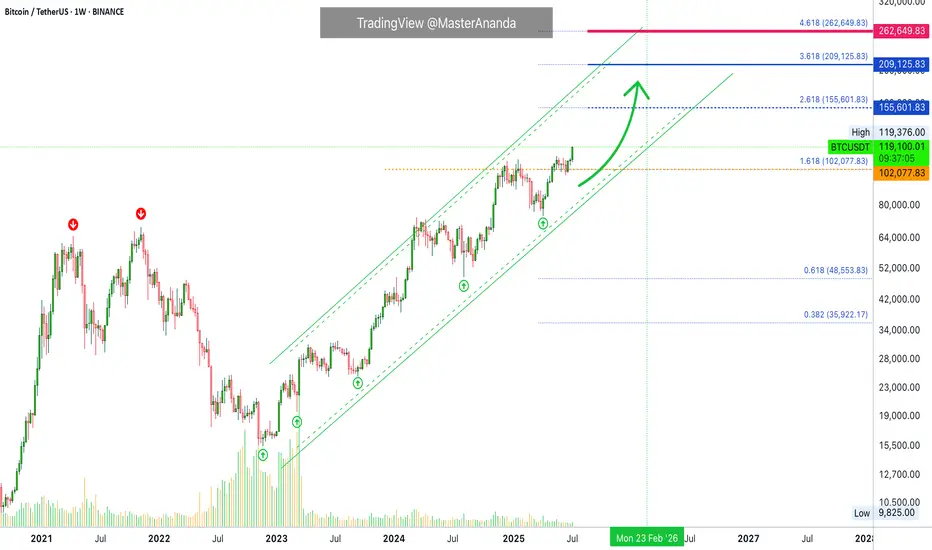
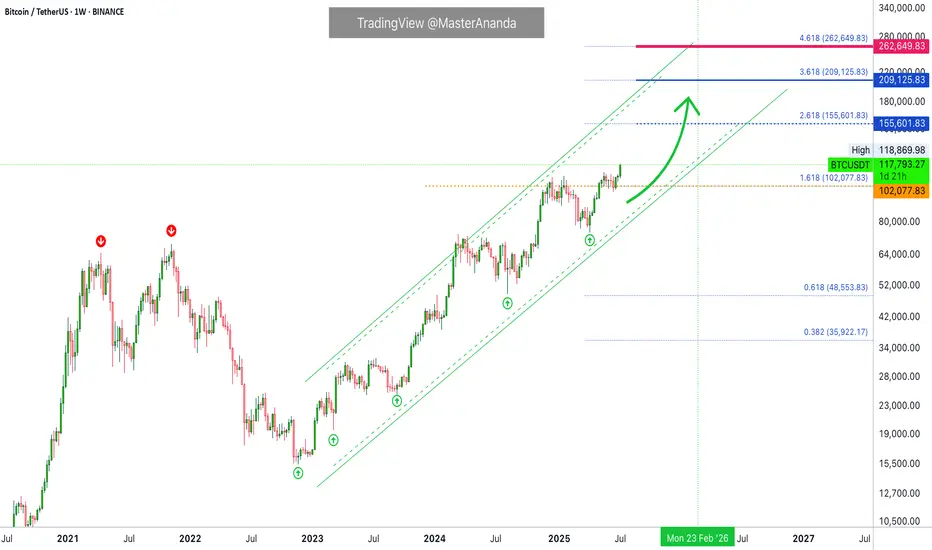
Bitcoin Crash? No! The Bullish Wave Starts Now! $155,601 Next!Some people are still expecting for "Bitcoin to go down." Poor bastards, the advance is just starting. Bitcoin just broke out of a 210 days long consolidation phase. After this huge, long-term consolidation, expect a major advance. Next target is now set at $155,601.
This week is the first week green after the consolidation finally ends. The market was sideways for seven months, with some fluctuations, and the result is a bullish breakout. Why a breakdown? Why expect a drop? If the market just broke up—think about it—why would it go down?
If resistance is confirmed; you remember the range between $100,000 and $110,000. If resistance is confirmed then Bitcoin would start crashing down from $110,000. If the break of $110,000 does happen and Bitcoin moves to $112,000 as a bull-trap, then you would expect a major crash happening from $112,000 and no more. But, reality is saying, showing, something much different. We have a major advance. Resistance has been flipped into support.
Now, the first that is needed is the weekly close. It is still very early into this move but Bitcoin is showing maximum strength. Remember the altcoins? These confirm that the advance is just new, early, because these are recovering from all-time lows or major lows. There is still plenty of room for growth.
My people, wake up! Bitcoin is going up.
The next target is $155,601 and it can go higher, this is only the mid-term target based on the long-term. When Bitcoin consolidates for 7 months, it tends to grow some 137% on average, it can be less but it can also be much more. And it tends to grow at least for 1-2 months, but this also is just the average, Bitcoin can grow straight up for 4 months.
So, are you still bearish?
Oh please no! The bulls already won.
The 2025 bull market final phase starts now, soon you will experience a marketwide bull-run. We have not seen the euphoria phase, this is only the start. Prepare for additional growth.
I am calling out all of the bears, never bet down on Bitcoin; Bitcoin is going up.
Namaste.
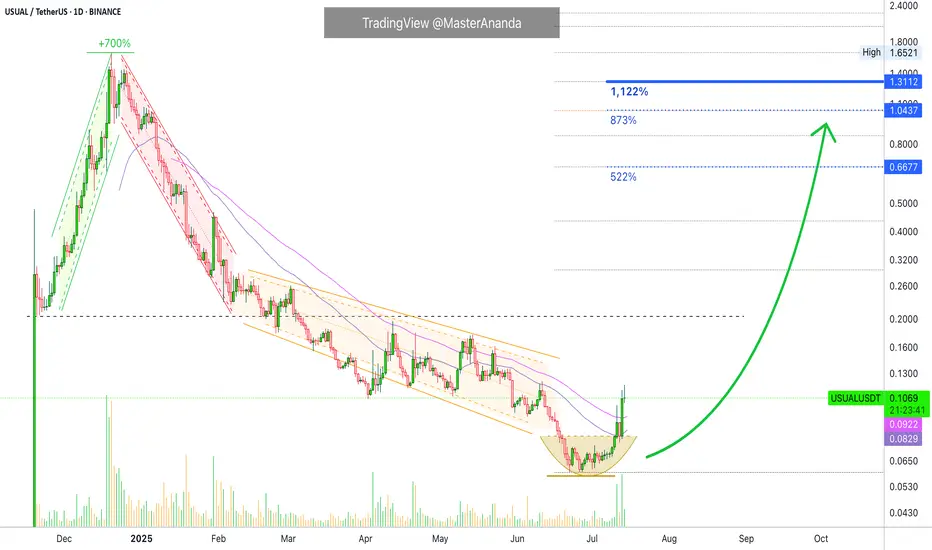
Usual 1,122% Target Mapped · Can Go Higher Late 2025Usual grew 700% in one month, between November and December 2024. Then the market went on to produce a major lower low bottom and now everything is changing. I am sharing this one again because I believe it will produce a massive bullish wave.
Good evening my fellow Cryptocurrency trader, how are you feeing in this wonderful day?
A new week starts and with the new week we will have a new set of top performers. Remember that a rising tide lifts all boats. It is not only one project but the majority of the altcoins that are set to grow. It is a long drawn out process, do not be distracted by the illusion of easy or fast gains. If you can hold and do so strong, patiently, you can end up with big gains. The big wins accumulate after months. Buy the bottom, 7-April, 22-June and hold. Comeback in 2-3 months and see how the market is doing. Sell those trading high, buy those trading low.
USUALUSDT is now trading above EMA55 and EMA34. A strong candle and high volume came up to break each of these resistance levels. The same levels that rejected growth many times in the past three months.
In April, USUALUSDT tried to turn bullish but was rejected by EMA55 and EMA34. This same dynamic repeated once more in late April and then twice in May. When the market fails to conquer a resistance zone it tens to move lower looking for strength. That did it. After a major low and rounded bottom, we are now on the bullish zone.
USUALUSDT can easily grow 500% to 800% in the coming months. Without hitting a new all-time high, we have 1,122% potential for growth. From a previous chart, the 1,122% target gives us 1,950%. This is huge growth and it is possible that a new all-time high will be hit later during the bull run phase.
This is a friendly reminder. Opportunities are endless in this market.
Thank you for reading.
Namaste.
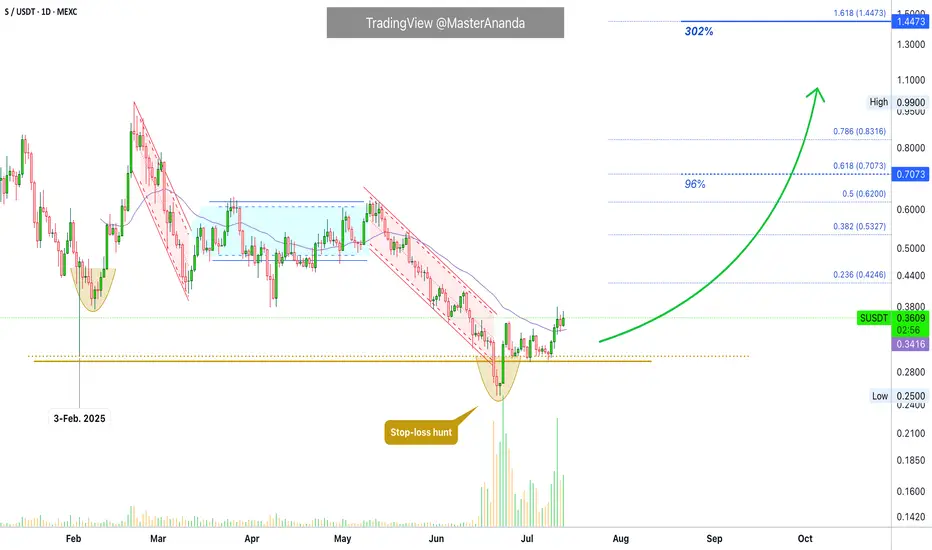
Sonic Moves Next · Expect Massive Growth Coming Weeks —300% EasyTwo pairs-projects will be moving strongly in the coming weeks, Sonic and Usual. This is the chart for SUSDT (Sonic) on the daily timeframe.
Notice how the action is moving back above the 3-February 2025 low (bullish). Notice the stop-loss hunt event recently. This events marks a bottom once it happens. After the event we see growth.
Finally, notice the very strong increase in trading volume. SUSDT is trading safely above EMA34. All these signals confirm strong growth in the coming weeks starting now basically, it is already happening as the action has been bullish since 22-June.
I am always giving you the best charts, the best timing in the Universe with the best results. I will continue to share daily but you need to follow. You can get notifications each time I publish and in this way you can be up to date with the Cryptocurrency market, the altcoins are moving ahead and this only happens once every four years. There are bullish waves in-between the bear market and transition years, but nothing like 2025.
The 300% on the chart is an easy target. This target can be achieved short-term maximum mid-term. Imagine the 100 years old index funds, it would take you 30 years to earn 300%. Oh my god! Leave that to your grandparents this is not for us.
My heart goes out to all the people still buying index funds related to the stock market. It is like using floppy disk still in the year 2025, we have USB sticks and smartphones, floppy disk were discontinued long ago. Buying SPX index funds and such stocks instead of Crypto is like buying CD-roms to store music, we streaming now not even MP3.
The future of finance is Crypto. Altcoins is the way to go. If you are already in this market you are ahead of the pack. You will look like a genius 10, 15, 20 years from now. For you and for me it is normal but actually, only the minority knows well enough the game. There is plenty of room left available for growth. Crypto is young.
Namaste.
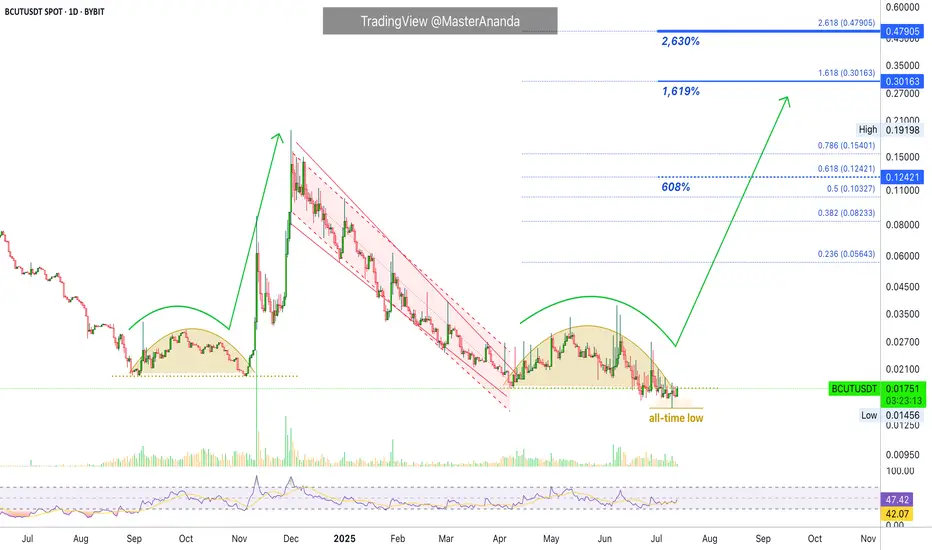
bitsCrunch 608% & 1,619% Easy Targets · 2,630% Possible Or MoreI am going with a classic on this project and Cryptocurrency trading pair, the RSI bullish divergence.
We are going to be looking at bitsCrunch (BCUTUSDT) on the request of one of our great followers. This chart is awesome. A true bottom catch—all-time low just hit—with high potential for growth and strong bullish reversal signals. Let's get started.
BCUT's daily RSI bottomed around June 2024. Oversold. Red.
BCUTUSDT continued lower and set a low around September and then again November 2024 before a nice recovery. The late 2024 bullish wave might seen small here but it almost reached 900%.
Then came the correction, a strong one. BCUTUSDT broke it's 2024 support zone and hit a lower low. At this same time, the RSI produced a higher low compared to June 2024. This gives us the bullish divergence signal and this signal tends to support a change of trend.
BCUT went on after its 7-April low and produced a lower low, an all-time low, 10-July. A true market bottom. The candle for this session ended closing green with a long lower wick, which means bullish. Three days later we have a recovery. From now on, we can expect maximum growth.
The ~900% bullish wave in late 2024 shows that this pair can do wild numbers. If it can grow this much in just 26 days, imagine how much it can grow in 180 days. Good to visualize. Huge potential. A great altcoin choice.
1,619% and 608% are easy targets. The 2,630% target is do-able with a standard bull market.
Thanks a lot for your continued support.
Namaste.
Mask Network Easy 688% Profits Potential Target ($10.88)The 2022 bear market for Mask Network ended October 2022. After a series of lower lows the project produced a bullish breakout until March 2023. It was the recovery wave with a total of 650% growth.
MASKUSDT went bearish again from March 2023 but instead of a bear market wave it produced a long drawn out distribution pattern.
The next major low happened 7-April 2025. More than two years producing lower highs and dropping, and I consider this low to be the end of the bearish period. MASKUSDT will now resume growing as part of a new bullish cycle and uptrend.
The 7-April low was followed by higher lows. Compare this to pre-October 2022 when the market was producing lower lows instead. Higher lows then a strong bullish breakout in May. Total growth for the initial recovery reached 300%. This is where the market is now. There was a retrace and now we are seeing signs of a bullish continuation after a higher low.
Mask Network is good as prices are still relatively low. Seeing the big candles in the past, another huge big-candle will show up.
Looking at the chart, I am mapping a 688% easy target within the next 3-6 months. Coming from the 7-April low, hitting this same target would produce a total of 1,070%. I believe the market is very healthy and even higher is possible in late 2025 and beyond.
This is a good chart if you are a buyer and looking for pairs that can grow strong in the near future. If you are a bull, this is an easy buy and hold.
Namaste.

PENGU still has room!?If you find this information inspiring/helpful, please consider a boost and follow! Any questions or comments, please leave a comment!
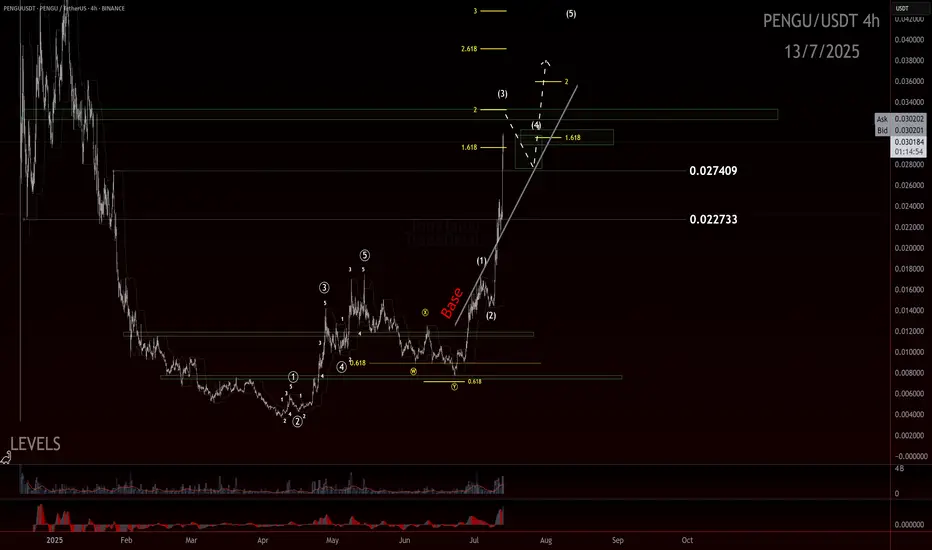
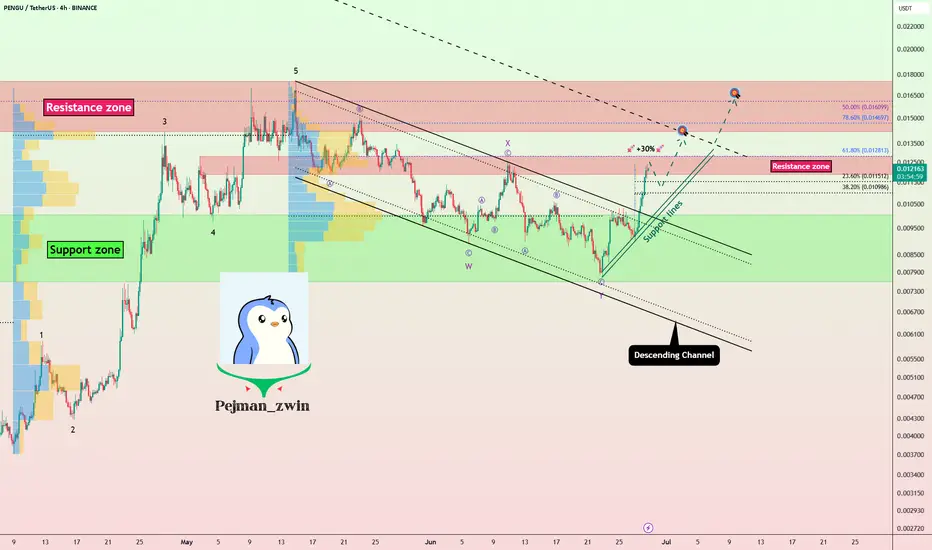
The move off the low looked like a clean, completed impulse—sharp, decisive, and well-structured. After that, we got a double zigzag retracement. It ran a bit deeper than the textbook version, but still landed right in the normal range you’d expect for a healthy correction. From there, we saw another smaller-degree impulse form off the .007 pivot, suggesting bullish momentum was building again.
Since the last update, PENGU has come a long way—more than doubling in price and now hovering around a most likely target for a wave 3. What’s notable is how it got there: not just by breaking above the 0.017 resistance, but by blowing through multiple base channels on solid momentum and healthy volume.
We didn’t get the ideal depth for a retrace for a wave 2 before that breakout, but that doesn’t disqualify the larger count. In fact, from an Elliott Wave perspective, I still believe we haven’t seen a proper wave 4 to balance out the earlier wave (2). So I’m holding off on calling a top to this wave 3 just yet.
Here’s what we’re watching closely now:
The secondary impulse off .007 continues to build structure
Ideally, the next pullback holds above the 0.027 or .022 region, signaling respect for previous support and AOIs
That pullback needs to unfold correctively, not impulsively, to confirm bullish continuation
The next trade setup I’m eyeing is that wave 4 into wave 5 move. I’ll be stalking this ticker closely as structure unfolds.
Trade safe.
Trade clarity.
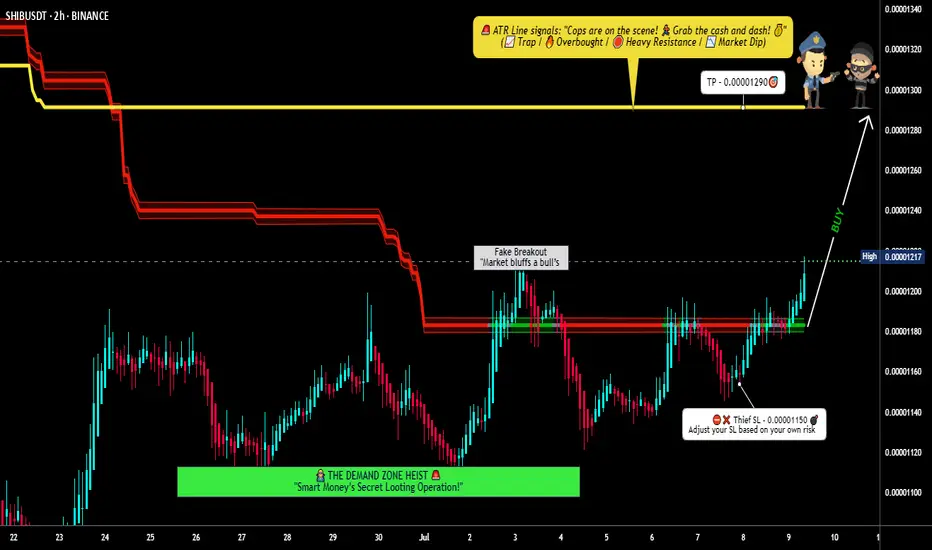
SHIBA INU Heist Plan | Layered Buy Limits + SL Strategy🏴☠️💸**SHIBA INU Heist Blueprint: Rob the Bulls, Outsmart the Bears | Thief Trading Style Strategy (Swing/Scalp)**💸🏴☠️
🌍Hola! Hello! Marhaba! Bonjour! Ola! Hallo!🌍
💰Calling All Market Pirates, Profit Seekers, and Silent Thieves... the vault is open!💰
This is a special market mission for SHIB/USD (SHIBA INU), based on the notorious "Thief Trading Style" — a method designed to sneak in, grab profits, and vanish with style. 💼✨
🧠Backed by a spicy combo of technical, fundamental, on-chain, and sentiment analysis, this strategy is crafted for both swing and day traders ready to infiltrate volatile zones and escape with gains.
🎯The Robbery Plan:
We're targeting a high-risk, high-reward breakout with our eyes on the ATR police trap zone, where market makers often lure and trap traders. Our focus? The sweet spot where consolidation ends, fakeouts begin, and true reversals take off. ⚠️🐍
📥ENTRY (The Break-in):
"The Vault is Unlocked!"
Sneak in using buy limit orders at swing lows or support zones—opt for the 15m or 30m chart to catch pullbacks.
We're stacking orders like a professional thief using DCA (Layering Method) to reduce entry risk. 📊💼
🔎 Entry Zone: Market or limit entries near structure lows—be precise, not greedy.
🛑STOP LOSS (Escape Hatch):
Use the 2H swing low around 0.00001150 as your escape signal.
Risk management is your armor: adjust SL based on your lot size, order count, and trade exposure.
🔒Thief Tip: Never trade without your getaway plan!
📈TARGET (The Safe Zone):
🎯 Primary Target: 0.00001290
Optional: Use trailing SL and scale out profits as the robbery gets hotter.
Scalpers—only join the long side of the heist! If you're packing a big bag of capital, jump in earlier; if not, ride with the swing team. 🚁💸
📊THIEF FUNDAMENTAL FUEL:
SHIB bullish momentum is rising due to macro sentiment shifts, market rotation, whale accumulation, and on-chain volume flow.
Check related macro reports, intermarket insights, and crypto futures data before loading your bags. 🧠📈🔗
🛎️HEIST WARNINGS – Stay Safe!:
🚨 During major news releases, volatility can explode. Don’t get caught!
❌ Avoid fresh entries during news
✅ Use trailing stops to lock gains on existing positions
💖LOVE THIS PLAN? SUPPORT THE CREW:
💥Smash that Boost button💥 to keep the Thief Trading Crew alive and plotting!
We drop fresh heist plans regularly—help us spread the love, grow the crew, and keep stealing profits from the noise. 🚀
📌Disclaimer: This analysis is for educational purposes only—not financial advice. Always DYOR and adjust based on your personal risk profile.
📌Stay tuned for more heist missions. Let’s outwit the markets—one trade at a time.
🤑🐱👤💎 #ThiefTradingStyle #SHIBHeist #CryptoStrategy #MarketRobbery #SmartMoneyMoves
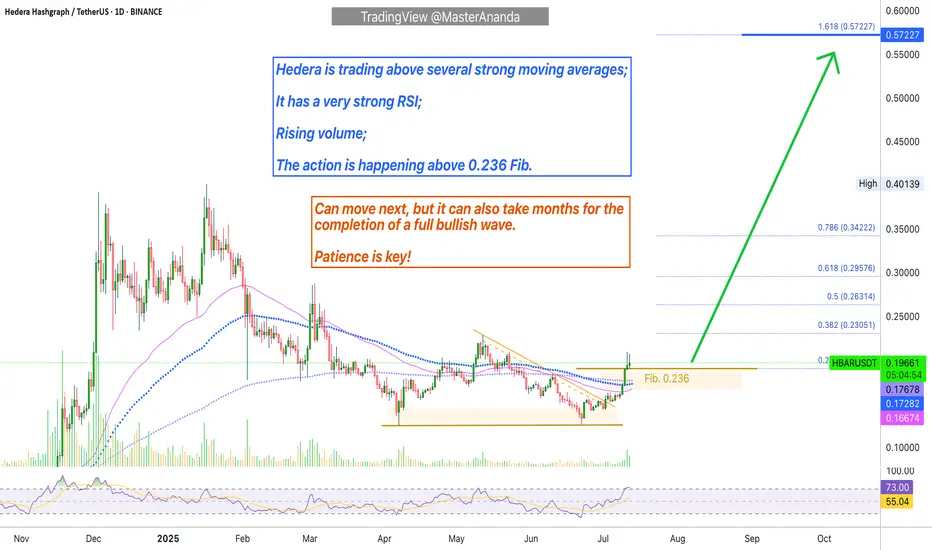
Hedera: How To Catch The Altcoin That Will Move NextWhich one is going to move next? That's the question and here is the answer: Look for those with a confirmed bullish setup.
There are hundreds and hundreds of trading pairs. We go by the saying, "everything will grow." But not everything grows the same day nor at the same time. So which ones are the ones more likely to move next?
Here is a simple example: HBARUSDT.
Hedera is trading daily above EMA55, EMA89 and EMA233. While it has already five days green, this one is more likely to move next vs others that are trading below those moving averages. That is what I mean by a confirmed bullish setup.
You can also use MA200 and other indicators such as the RSI and MACD. For example, if the action is happening above a strong Fib. level, this can also be of value. If the RSI is very strong compared to other pairs, this is also good. The more strong bullish signals combined the higher your chances of finding the right one.
My suggestion?
Do not try to catch the next big move. It is better to develop a plan, find the pairs that fit your criteria then buy and hold. Chasing pairs can turn into blind gambling game. It is better to trade on a plan focused on the long-term.
Thank you for reading.
Namaste.
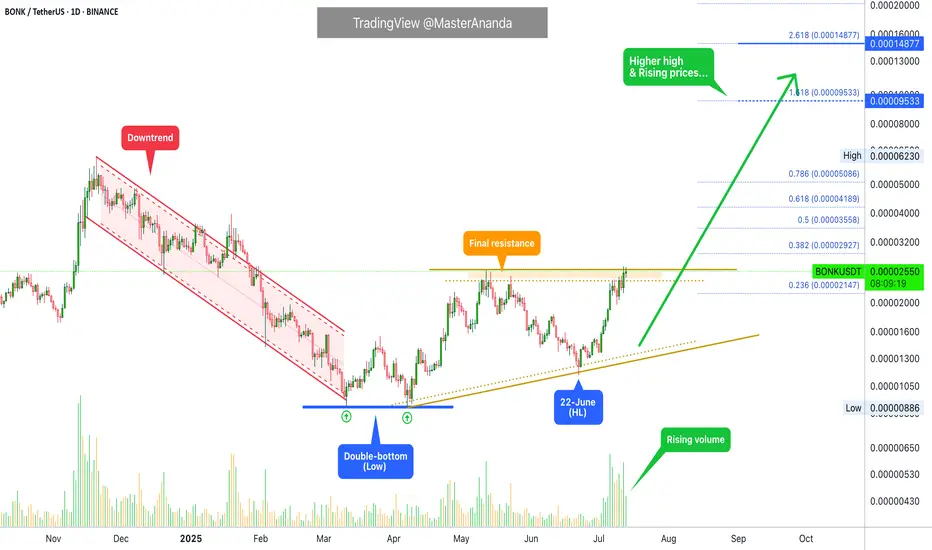
Bonk In A Good Situation, Breaking Resistance & HigherThe market bottom happened 7-April, it was a double-bottom compared to 11-March 2025. The end of a downtrend signals the start of an uptrend, and BONKUSDT started rising next. Resistance was found mid-May, on the twelve. This led to a correction and the correction ended 22-June as a higher low.
Now, between the first low in March and present day we have more than four months. The entire downtrend on the chart lasted 111 days, less than four months. This means that the bullish bias is already bigger in duration compared to the previous bearish wave, and, prices are set to continue higher because BONKUSDT just produced a higher high compared to May. Resistance has been compromised and this is good because it means we can soon experience additional growth.
The path is clear for rising prices. As resistance gets challenged in becomes weaker, as resistance weakens more buy-orders continue to pile up. The more buyers the better the market and then comes a new major high. The advance that is developing now will continue for months and months and months.
Are you ready for huge profits? I hope you are. Crypto is going up!
Namaste.
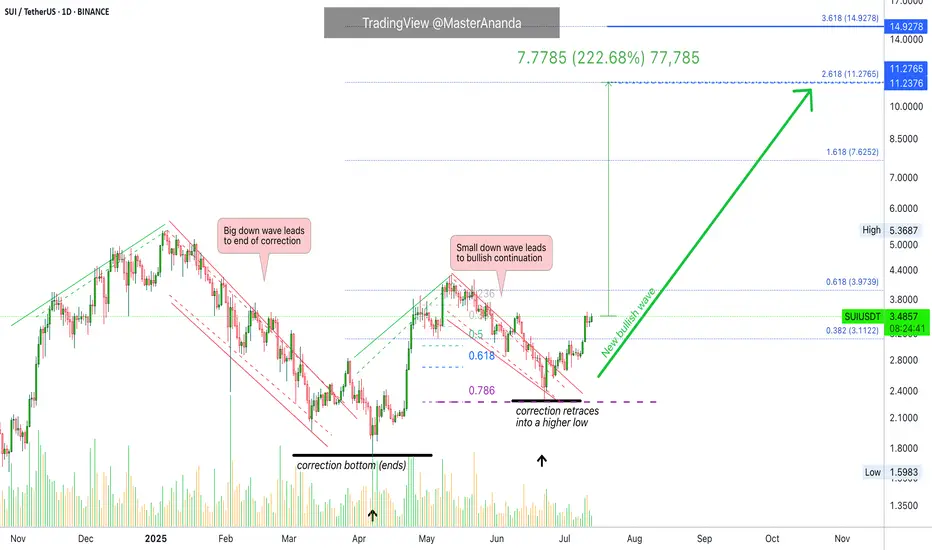
Sui Update · Clearly Moving Towards $7.62, $11.3 & $15The SUIUSDT chart looks great and just today we are witnessing a bullish continuation. Resistance was found 11-July but the market didn't produce any significant retrace. This is obviously because we are ultra-bullish and ultra-bullish can only mean sustained growth.
After the 11-July resistance, one day neutral and now resistance is being challenged again. Based on how Bitcoin is doing, a new all-time high; based on how the market is doing, great; we can expect higher prices in the coming weeks and months.
There will always be swings. Retraces and corrections but the bigger picture is a strong bullish dynamic for months. Think of 4-8 months of prices rising non-stop. That is what you are about to experience. Keeping in mind that the start date is 7-April and not today. So 6-8 months starting early April, growth long-term.
We will have a new all-time high for on this pair. There is huge potential for growth. The target on the chart is an easy one based on the short-term (within 1 month/30 days). After $7.62 we have $11.27 followed by $15. As you can see, it is still early within this bullish wave.
Thanks a lot for your altcoin choice, a great pick.
Your support is appreciated.
Namaste.
PENGU = ETF Catalyst + Whale Accumulation = +30% More Upside?Today, on the weekend, I want to analyze the Pudgy Penguins project with the PENGU ( BINANCE:PENGUUSDT ) token from a fundamental and technical perspective .
Please stay with me.
Why did PENGU surge nearly 40% in just 48 hours? Here’s what’s driving it:
------------------------------------------
Fundamental Analysis:
1. ETF Momentum via Cboe:
On June 26, Cboe officially filed a 19b-4 form for a new ETF that includes Pudgy Penguins and PENGU as major components.
Although not yet approved, this single move has fueled strong institutional anticipation, similar to what happened with Bitcoin ETFs in early 2023.
The market often prices in future narratives — and this ETF storyline has been a powerful one.
2.Whale Accumulation Signals
According to Nansen data, large holders have increased their balances by 11.37%, and notable wallets linked to public figures by 7% over the last 30 days.
Such coordinated accumulation often precedes major price moves, and that pattern seems to be repeating here.
3.NFT Ecosystem Boost
The Pudgy Penguins NFT collection saw a 400%+ surge in sales volume.
This sharp increase in NFT activity has reignited attention toward the broader Pudgy ecosystem, which naturally benefits its native token, PENGU.
Risk Note:
The ETF is not yet approved — we're still in the hype phase.
Volatility remains high, and strong pullbacks are common in low-liquidity tokens like PENGU.
If whale activity continues and institutional narratives grow, the upside potential remains — but so does the downside risk.
------------------------------------------
PENGU token started to rise from the Support zone($0.01-$0.0076) . One of the signs of a continuation of the uptrend was the break of the upper line of the descending channel .
Educational Note: One of the price targets after a channel break can be as wide as the width of the broken channel.
In terms of Elliott Wave theory , it seems that the PENGU token has completed the Double Three Correction(WXY) , and we can wait for the next impulsive waves .
I expect the PENGU token to attack the Resistance zone($0.0128-$0.0118) again, and if this zone is broken , it can increase to at least $0.0137(+30%) .
What is your idea about the Pudgy Penguins project?
Note: If the PENGU token drops below $0.01, we can expect a break of the Support zone($0.01-$0.0076).
Please respect each other's ideas and express them politely if you agree or disagree.
Pudgy Penguins Analyze (PENGUUSDT), 4-hour time frame.
Be sure to follow the updated ideas.
Do not forget to put a Stop loss for your positions (For every position you want to open).
Please follow your strategy and updates; this is just my Idea, and I will gladly see your ideas in this post.
Please do not forget the ✅' like '✅ button 🙏😊 & Share it with your friends; thanks, and Trade safe.
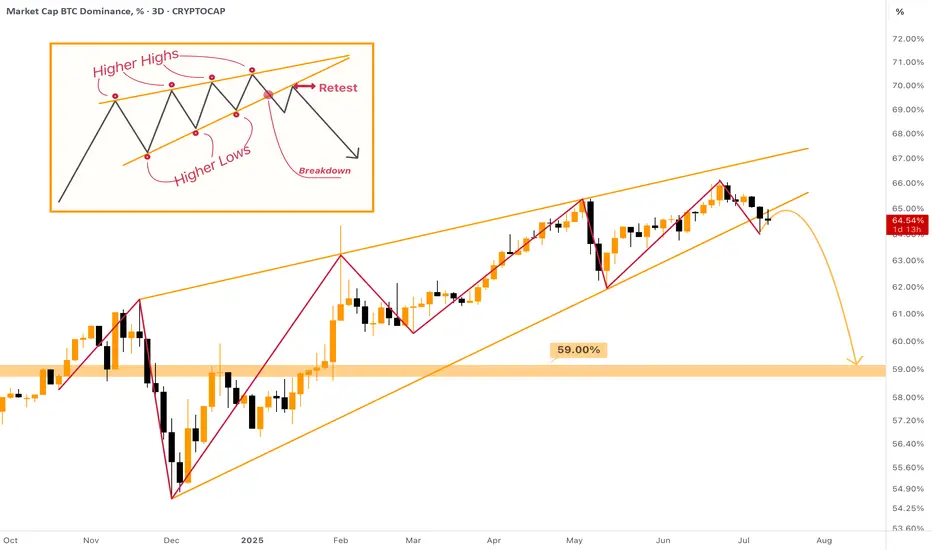
Rising Wedge on Bitcoin Dominance - [BROKEN DOWNWARDS] The MASSIVE Rising Wedge on Bitcoin Dominance was broken downwards during the past week, most likely the 1W candle will also close below the support of the wedge.
What does it mean? The dominance will dump from 64% to at least 59%. This move can already provide us with the huge Altcoin Season! After this there more likely be a small correction towards 60%, and then we can freely dump further towards 54% zone.
I expect not only small cap, but major altcoins to be sent to new highs as well. Mark my words & be prepared for the last opportunity of this bull cycle!
BTC.D Slipping ! ALTSEASON Loading ? This is BTC.D on the daily chart.
It has shown a strong relationship with the 50MA (blue/cyan line), often using it as support. While there were a couple of daily closes below it in the past, they lasted only 1 or 2 candles.
Now we’ve seen 4 consecutive daily closes below the 50MA (including today), which increases the likelihood of a deeper move to search for support.
The next key support zone (green rectangle) is defined by the 200MA (red line) and the 62.25% level (black line) — both of which acted as support before.
If BTC.D drops into that zone, ETH and altcoins could experience a strong bounce.
Always take profits and manage risk.
Interaction is welcome.

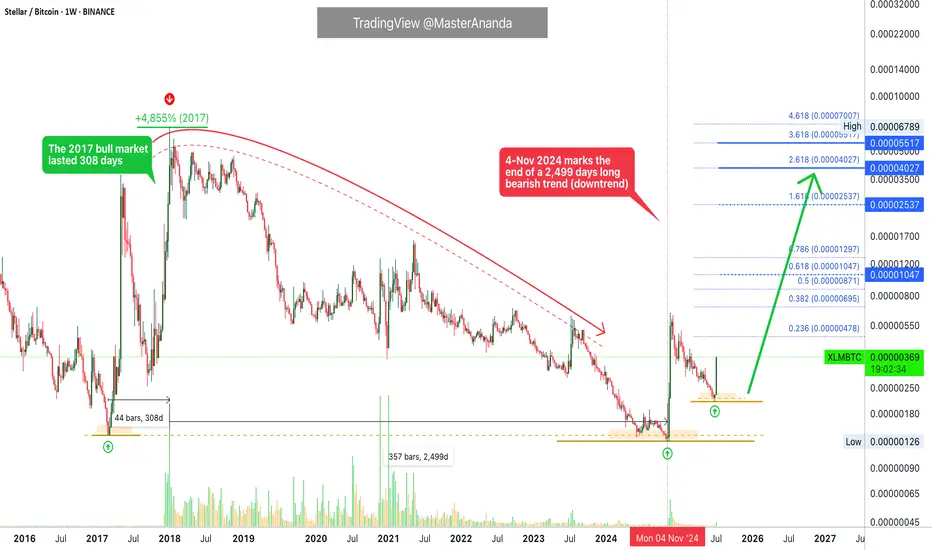
XLMBTC To Enter Its Biggest Bull Market Ever · 4,855% In 2017Stellar. No bull market vs Bitcoin in 2021. You know what this means? We are due an ultra-strong bull market for XLMBTC in 2025 (and beyond).
The 2017 bull market lasted 308 days. Total growth reached 4,855% within this period. The bear market that followed was brutal. From January 2018 until November 2024. A total of 2,499 days of bearish action.
A bottom was hit 4-November 2024 and the proceeding week we saw a major advance. This was a 400% bullish wave. Now this wave is over with a correction and the correction ended in a classic higher low. This week we have a new bullish breakout and this is the continuation of the uptrend, the first time XLMBTC goes bullish since 2017. It seems this pair will continue bullish even after Bitcoin peaks. Who knows, maybe even years going up.
The chart is solid and supports additional growth. We are due a strong rise, the biggest ever for this pair.
Thank you for reading.
Namaste.
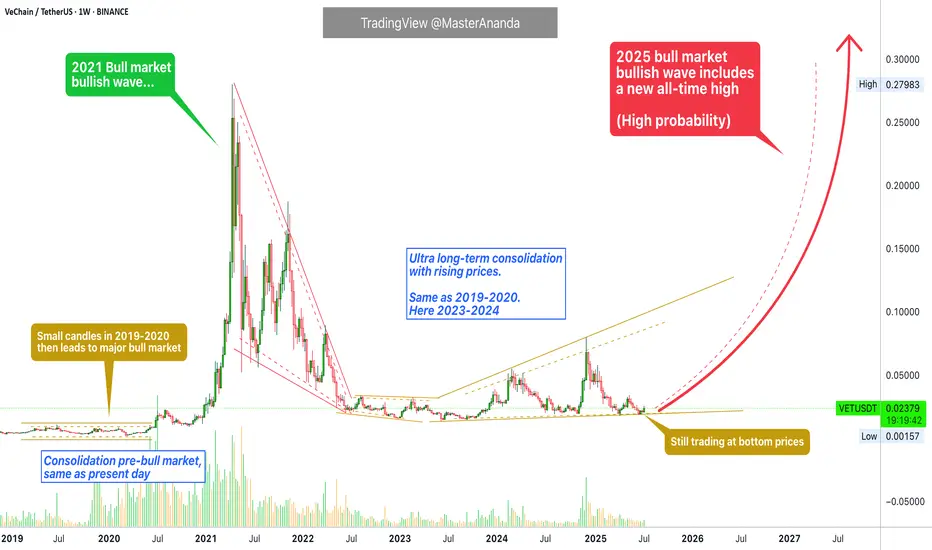
VeChain Low Prices Accumulation Opportunity Reaching Its EndVeChain. We have higher lows since June 2023 and yet, VETUSDT is still trading at bottom prices. Don't get me wrong, this is great. This only means that the pair is strong and yet there is still time to buy within a rising accumulation zone.
I am using the linear chart so we can get the full picture. After June 2022, the candles become very small. This is the consolidation period. Even when the market starts to produce higher lows and higher highs after June 2023 this is still bottom prices action. What do I mean? Just compare the size of the 2021 bull market bullish wave with the past 3 years. That is what I mean.
What will happen now is the 2025 bull market bullish wave. A wave similar in size to what we saw in 2021 but with the end result being much higher prices, very likely a new all-time high.
First the action is very slow, almost neutral as you are seeing now. The small jump from April-May, less than 80%. Then watch... Out of nowhere, Boom!, 200-300% just to start. The 200-300% bullish breakout is never the end, this would be just the start of the major 2025 bull market wave. Then it goes on and on and on... Sustained long-term growth. The end result can be 15X, 20X, 30X or more. Too early to say, but prices won't remain low for too long. This is your last chance to accumulate VeChain before a major bullish run.
Namaste.
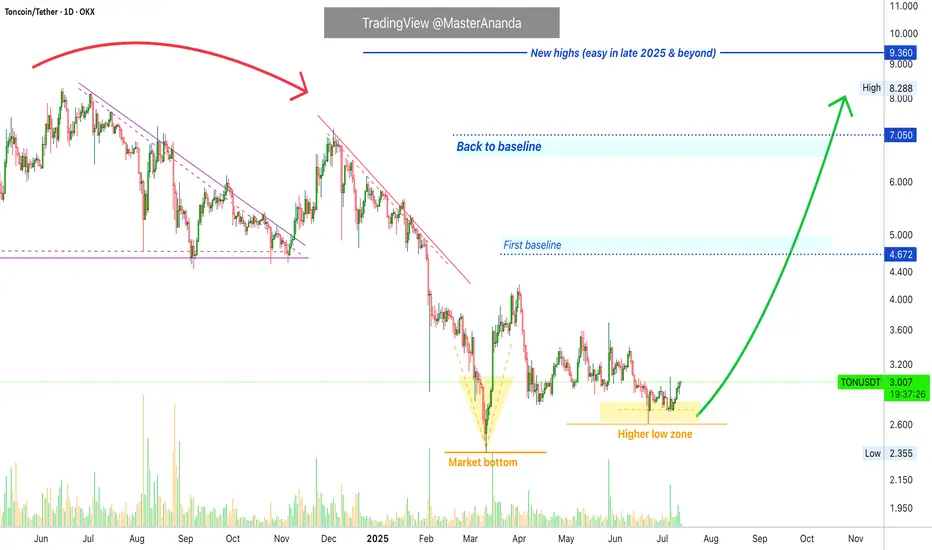
Toncion Update: Never Again Below $3.00 · New All-Time High NextToncoin already closed five consecutive days green as it prepares for a major advance. The last time this happened was in early April and this produced a nice jump. The difference now is that in April the market was coming out of a downtrend and the low was a major low. In June the market was in a retrace and the low is a higher low. Much difference. The next advance is very close, already here, and will produce the highest prices in more than a year, since June 2024 and of course, it will go beyond for sure, a new all-time high.
This is the last time you will see Toncoin trading at low prices before the major 2025 bull market cycle and wave. There is no limit to the upside, it is possible that in just a few days from now Toncoin will move away from $3 and never trade at this price again. That is, you will never be able to buy TON for $3.00, the price will be much higher. Do you remember Litecoin when it traded at 3 cents? What about Bitcoin at $3,000? What about Ethereum at $100? Well, Toncoin is no different. It will grow so much and so strong that we will be happy that we decided to be 100% Crypto. Risk vs reward. We accept the risk and for this reason we can enjoy an amazing reward.
Namaste.
Trading Altcoins for Maximum Profits · StrategyIt is a tricky market. How are you going to trade the altcoins to maximize profits? What's your plan?
Everyday there is always some odd pair that grows 100%+, and we feel attracted to this kind of action. We want to be in and we want to hold those pairs. But, there are hundreds of choices on each exchange and only 1-2 pairs breakup this strongly every few days. Quietly, behind the scenes, everything grows but slowly.
Three months down the road the entire market will be 2-3 levels up, minimum. Some pairs will be up five levels and some even more.
If we fall for the trap of trying to catch the next big move, we can miss the real bullish action that is happening every day. I mean, it is better to buy and hold 5-10 strong good pairs rather than chasing around the dream of big wins. A dream that most often than not never comes.
If you look at 22-June or 7-April, it takes months for a bullish wave to develop. All across, marketwide, it happens step by step. Every day altcoins are growing 2-3%, 5-10%, over and over, again and again.
When we jump around trying to catch the next sudden jump, we miss the safe and secure sustained daily growth. When we finally make the right move and buy the pair that is breaking up strong, there is a 50% bullish breakout but somehow this isn't enough, we want more, more, more. 50%, 70% up and yet, we do not sell, we wait for more. But the entire bullish wave, regardless of how you slice it, takes a minimum of 3 months. Then comes a retrace, fast, or a strong correction, and we sell when prices are low. A strong rise at first and we might end up with just 20-30% gains. And in this way we end up wasting months and months.
Three months later, we do have some gains; it is a bull market after all, but total growth is nothing compared to holding a strong pair long-term. The strong pairs, most of them, end up growing 700%, 800%, 1,000%. When you look at your capital and you are moving around, you see only 100 or 200% total growth. What is happening here?
If you have 2-3 years of spot trading experience, then you can definitely choose 20 good pairs and sell the few that breakup weekly, hold the rest. Each time several pairs breakup strong, collect profits and find the ones trading low. But, if you have less than 2 years experience trading spot, you are better off buying low and holding long-term. You will end up with bigger profits in the end.
There are many ways to approach the market, make no mistake, but a plan is needed to maximize profits. I will continue to share my experience so you can avoid making the same mistake I made back in the days.
I've been trading Bitcoin since 2013, altcoins starting 2015; full time Cryptocurrency since 2017 through present day.
The market is a school and will you give tons of lessons, experience is needed for success. If experience is lacking, planing ahead of time will produce the best results.
To plan, just ask yourself the following questions:
1) How long am I willing to wait after buying a pair?
2) If prices rise, will I sell? If yes, when and by how much?
3) If prices drop, will I close the position at a loss? If no, how long are you willing to wait with a losing pair? If yes, when will you close? At -10%, -20%, -50%?
Answering these questions ahead of time can help you avoid anxiety and stress. The more you prepare, the more you read; higher profits.
Namaste.
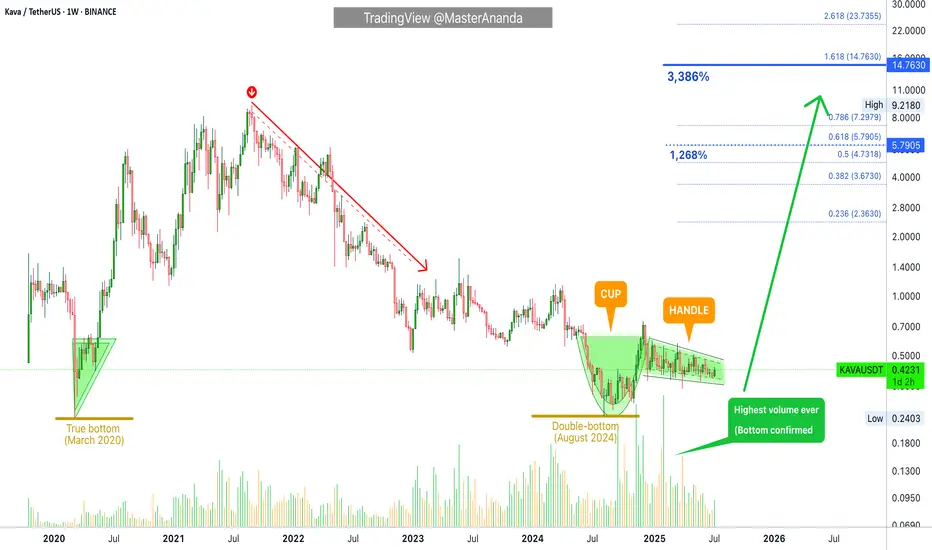
Kava: 5 Strong Bullish Signals, Cup & Handle, High Volume & MoreThe cup & handle pattern doesn't work at resistance. You cannot use this pattern in any meaningful way at the top of a rising trend. For the C&H to be valid, it needs to happen at the end of a downtrend, near the market bottom because this is a bullish reversal pattern.
Here we have KAVAUSDT weekly up-close. August 2024 marks the lowest prices since March 2020, in more than 3.5 years. Including this strong multiple years low, we have the cup pattern forming followed by the handle. See the chart:
This is the classic cup and handle (C&H) pattern and here it is valid and can work as a reversal signal.
One signal in isolation is never enough, it needs to be coupled with 3-4 additional signals to have a strong setup. The next signal comes from the trading volume. As KAVAUSDT reached the lowest in almost 4 years, trading volume goes through the roof; the highest buy-volume ever. This is another strong signal.
We have the reversal pattern, long-term double-bottom, increasing volume, local higher low (the handle low vs the cup low) and marketwide action (the rest of the altcoins market going bullish).
There you have five signals total all supporting a change of trend. This means that soon Kava will start to grow and you know this for certain because you have the supporting data coming from the chart.
Namaste.
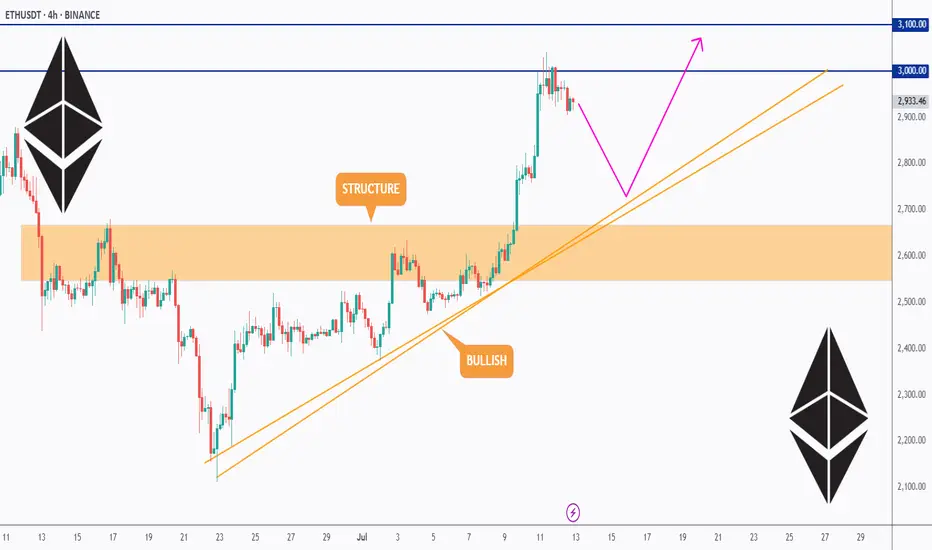
ETH Hits $3K — Next Stop: Moon or Pause?ETH just tagged the psychological $3 000 barrier after a sharp impulse, printing a fresh higher high inside its rising channel.
🧠 Game plan:
1️⃣Pullback zone: The orange structure area at $2 550 – $2 700 aligns with the channel’s lower trend-line — a prime spot for bulls to reload.
2️⃣Continuation trigger: A clean 4H close back above $3 000 turns the level into support, unlocking the path toward $3 100 (first target) and potentially higher into the summer.
3️⃣Invalidation: A decisive break below the channel would neutralise the setup and shift focus back to the macro support near $2 400.
Until then, every dip toward the orange demand is a gift in this bullish structure. Trade the plan, not the noise.
📚 Always follow your trading plan regarding entry, risk management, and trade management.
Good luck!
All Strategies Are Good; If Managed Properly!
~Richard Nasr