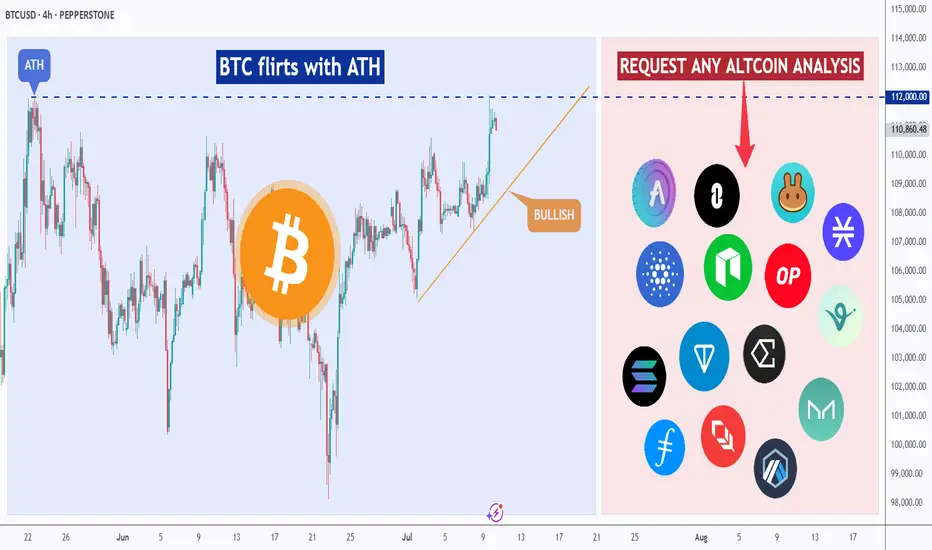
ATH Mode On => Request Your Altcoin Analysis NowThe bulls are back in action, and momentum is building fast! ⚡
To celebrate this major milestone, I’m opening the floor to YOU 👇
Request any altcoin in the comments, and I’ll personally share my technical analysis on it! 📊✅
Let’s make the most of this market together — it’s altcoin season waiting to happen! 🚀
📚 Always follow your trading plan regarding entry, risk management, and trade management.
Good luck!
All Strategies Are Good; If Managed Properly!
~Richard Nasr
Altcoins
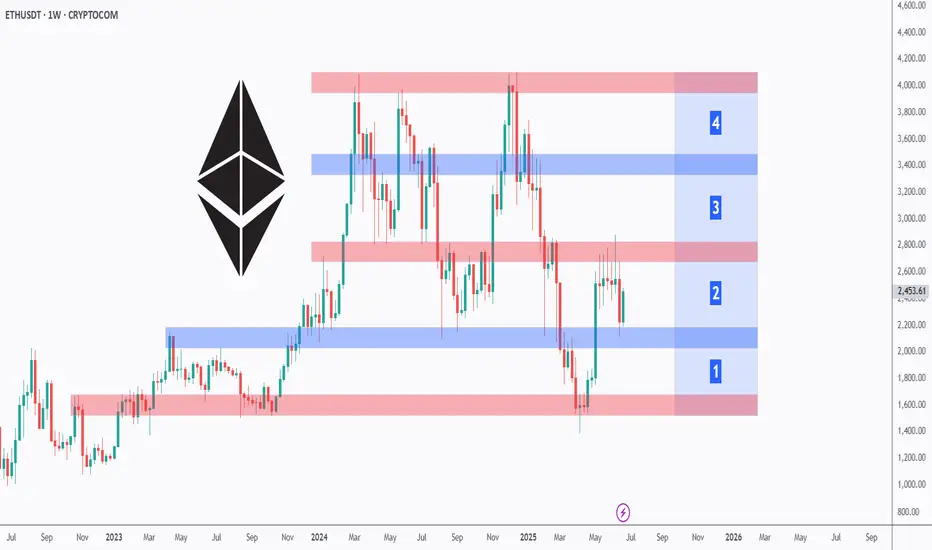
ETH Building Blocks - Keep it Simple🧱 Building Block - ETH Weekly Analysis 🧱
Ethereum has been trading within a well-defined structure, respecting key horizontal zones — each acting as a crucial building block in ETH’s macro journey.
🔹 Zone 1 ($1,700 - $2,100)
A strong demand and accumulation zone. ETH bounced from here multiple times, proving itself as the foundation of the current bullish attempt.
🔹 Zone 2 ($2,400 - $2,600)
We're currently hovering around this key mid-range resistance. A successful break above it would pave the way for the next major leg up.
🔹 Zone 3 ($2,900 - $3,400)
A major historical resistance turned supply area. ETH needs strong momentum and volume to break through this ceiling.
🔹 Zone 4 ($3,800 - $4,200)
The final building block before retesting ATH territory. A retest here could signal full bullish control in the coming months.
📍 As long as Zone 1 holds, ETH remains structurally bullish. Watch for breaks and rejections at each building block to gauge the next move.
Which block will ETH break next? 🔮
📚 Always follow your trading plan regarding entry, risk management, and trade management.
Good luck!
All Strategies Are Good; If Managed Properly!
~Rich
$BTC.D: Failed breakout above 66%. Was that it? Time and again we investigate the CRYPTOCAP:BTC dominance chart. In my opinion it is the most important chart in the Crypto markets. I have supported the idea that we will see CRYPTOCAP:BTC.D touch 66% in this market cycle. In my first blog on this topic on April 14th I published the idea here in Trading view.
CRYPTOCAP:BTC.D to 66%, CRYPTOCAP:TOTAL2 / BTC down to 0.43 for CRYPTOCAP:BTC.D by RabishankarBiswal — TradingView
Since April time and again we looked at this chart and since I first preached the idea of CRYPTOCAP:BTC.D to 66.2% from 63% in April we had some hiccups in the way where the Altcoins tried to claim leadership. On May 20th I indicated that the short-term blip is not consequential.
CRYPTOCAP:BTC.D : Have we seen the top or a local top in the CRYPTOCAP:BTC.D ? for CRYPTOCAP:BTC.D by RabishankarBiswal — TradingView
We reaffirmed our view on June 22nd, and we confirmed our commitment to CRYPTOCAP:BTC.D to 66%.
CRYPTOCAP:BTC weathering the storm: CRYPTOCAP:BTC.D close to 66%. CRYPTOCAP:BTC to 160K. for BITSTAMP:BTCUSD by RabishankarBiswal — TradingView
We briefly touched 66% and failed to breakout on June 27th. Now we have hit an air pocket. In my opinion this should also pass. Confirming my view of CRYPTOCAP:BTC.D to 66.2% and 160K $BTC.
Verdict: CRYPTOCAP:BTC.D will cross 66.2% before all set and done. Price performance of Altcoin can be good going from here.
Verdict: CRYPTOCAP:BTC.D will cross 66.2% before all set and done. Price performance of Altcoin can be good going from here.

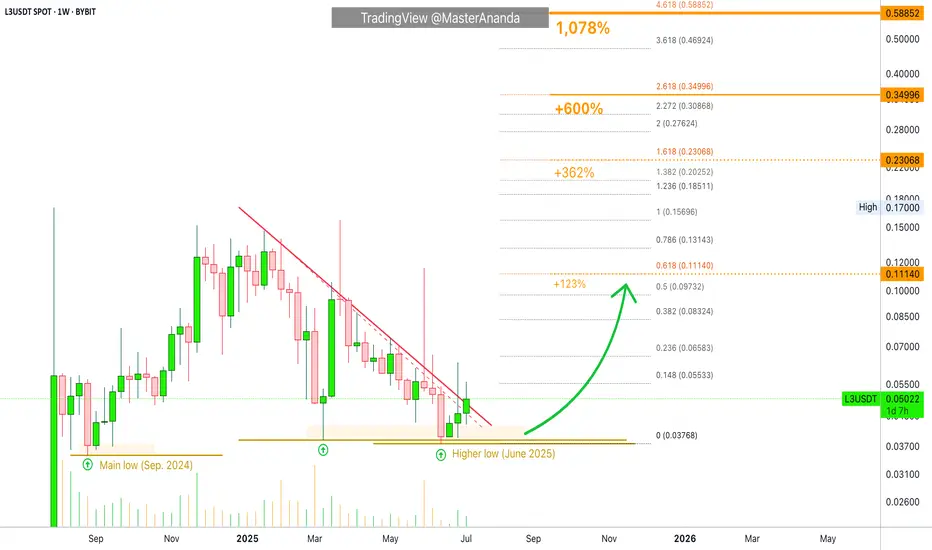
Layer3 Can Grow 600% Easily (1,000%+ Possible) · Weekly & DailyWe are going to start by looking at the weekly timeframe. After we do a deep analysis on this scale we will move to the daily.
Layer3 (L3USDT) produced its main low in September 2024 after it started trading. We can consider this the market bottom. After this low a bullish wave develops and totals +330%. The peak happened in November 2024. After a bullish wave, there is always a correction and that's exactly what happened for L3USDT.
The correction produced a low that ended 10-March 2025. This is the first low after September 2024 and ended up as a higher low, which means bullish. Buyers were present on the drop and bought before sellers were able to compromise the previous support, our market bottom.
The reaction to this support zone holding produced 300% growth within 3 weeks. Then the same dynamic plays out again. A bullish move is followed by a correction.
The new correction, starting after the late March high, ended the 16-June week. This low moves lower compared to 10-March but the candle/session ends up closing higher. Above the 10-March week wick low, a signal of strength.
When comparing June 2025 vs September 2024 we have a long-term higher low and this supports a bullish bias and a new bullish wave. Just like March but this time stronger.
Now L3USDT has been green three consecutive weeks, this is good. A local downtrend has been broken and seeing how the overall market is doing, the rest of the altcoins, we can expect strong growth. Layer3 is set to move and is already moving, bullish momentum will only build-up.
The targets on the chart are all high probability. The first two are very easy targets. So 600% can happen easily mid-term, which is within 3 months (90 days). The remaining target should be considered long-term.
Daily Timeframe:
The daily timeframe is basically the same. The bullish bias is early but very strong based on multiple reversal bottom patterns and the break of a local downtrend.
This is a good choice.
Thanks a lot for your amazing support, it is truly appreciated.
Namaste.
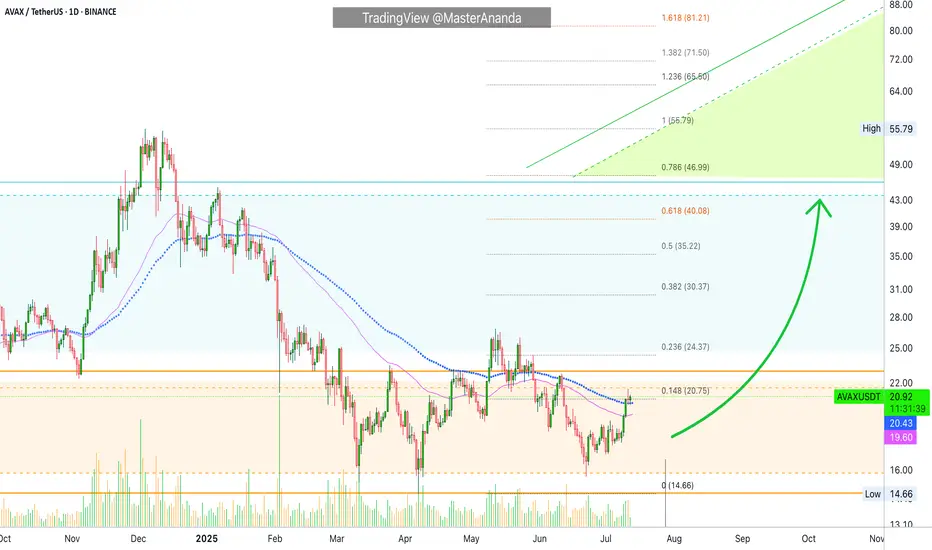
Avalanche, Why with Leverage? Exponential Moving AveragesOn the 10th of July AVAXUSDT finally managed to break above EMA55 and EMA89 on a very strong, full green candle. This is the day the market bias turns bullish and is fully confirmed. Bullish of course happens soon with the higher low, 22-June, but confirmation only comes after certain resistance levels are cleared, after the pair in question trades at a certain price.
Notice yesterday's candle, there was a rejection but prices remained above EMA89—blue dotted line on the chart. Today, we have a small candle with the same dynamics: A little lower then higher but still, above EMA89. The action is happening above 0.148 Fib.
These levels, EMA55, EMA89 and 0.148 Fib. extension all expose a strong support zone. As long as AVAXUSDT trades above them, we can expect maximum growth. That's why leverage is possible. With a well defined support range we can set the stop-loss right below and let the market take care of the rest.
Since both days failed to move prices lower, yesterday and today, and we know where the market is headed thanks to Bitcoin and the other altcoins that moved ahead, we can bet that Avalanche will grow and will do so strong. This is a safe bet.
Remember to do your own research and planning. Leveraged trading should be approached by experienced traders only. The same chart setup can be approached spot with minimum risk. Below 5X is also very low risk but higher is possible on this setup. Buy and hold, the market takes care of the rest. Great prices and entry timing.
Your support is appreciated.
Namaste.
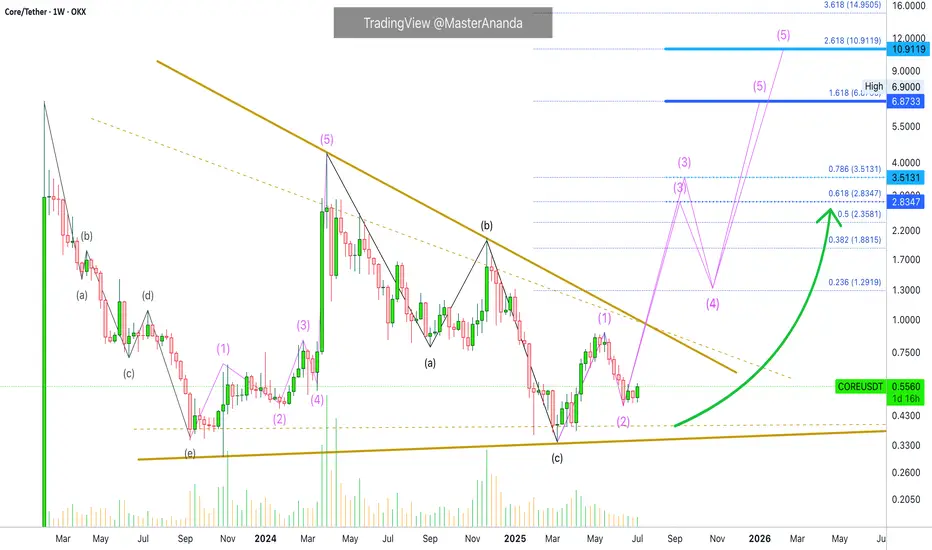
Core DAO Bullish Impulse, Elliott WaveI am giving two targets for the end of the fifth wave, the first wave is already in.
Good morning my fellow Cryptocurrency trader, I hope you are having a wonderful day.
Here we have a classic chart setup, COREUSDT bearish since April 2024. The drop from April 2024 through March 2025 can be considered a big ABC. Once the correction ends, we can look for signs of a newly developing bullish wave. The signs are in.
Between March & May 2025 we have wave 1, ending clearly in a higher low. The first wave lasted 70 days, the third wave can easily last 90 days. Can be more or less, this is only a projection but we know the market is set to move higher.
Wave 2 was really short, it only lasted 28 days. So wave 4, the second correction within a bullish impulse, can last between 40 and 60 days. After wave 4 we get the fifth and final wave and this is the speculative wave.
These are very conservative projections on the chart, the market can move much higher. For example, wave 3 can end up going as high as wave 5. Then wave 4 would correct into what is now the wave 3 high. Then the final fifth wave would go off the chart and peak at $18. This is another version and it wouldn't surprise me, Crypto tend to go beyond all expectations when the bulls are on.
Regardless of how high the market goes, right now we have great entry timing and prices while at the same time knowing Crypto is going up.
Namaste.
$OMNI/USDT – Wait Before You ChaseSEED_DONKEYDAN_MARKET_CAP:OMNI has already exploded with a parabolic breakout, rallying massively after breaking above the falling wedge resistance around $1.63.
Current Situation:
Massive impulse candle from $1.6 to over $4.5
Price retracing after the overextended move
Strong rejection near $3.35
Ideal Entry Zone (wait-for-pullback):
Between $1.47 – $1.63
Aligns with previous resistance and breakout zone
Could act as retest support
Setup After Retest:
Entry: $1.50 – $1.63 range
SL: Below $1.36
Targets: $2.37 → $3.15 → $4.50
Risk-Reward: High if patience wins over FOMO
Patience is key. Don’t chase pumps. Wait for the price to cool off.
DYOR | Not financial advice
#OMNI #Altcoins

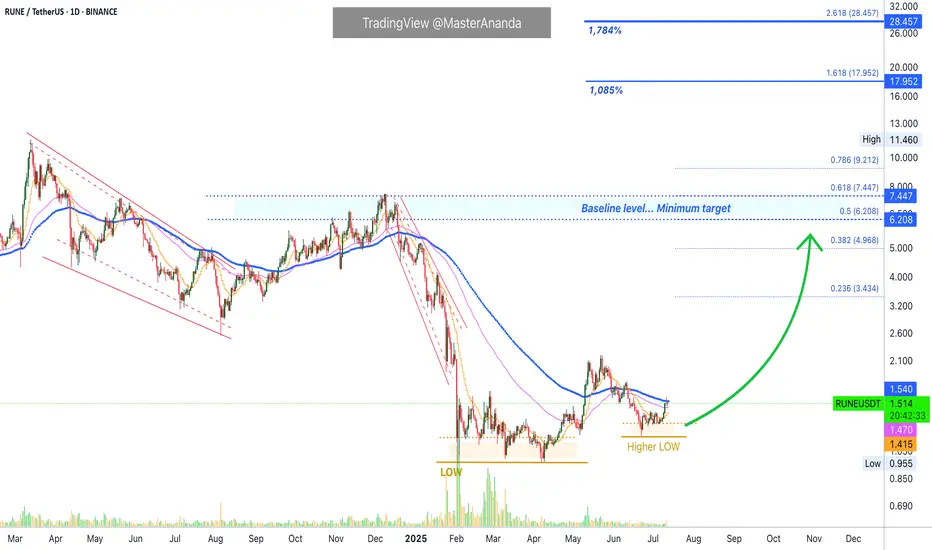
THORChain 1,784% Profits Potential & Technical AnalysisHere we can see THORChain sandwiched in-between EMA89 and EMA55. The action is not happening above EMA89 but this shouldn't be considered bearish, more like "we are not there yet." Or, "still consolidating but with a bullish bias."
The bias is bullish because the low came in early February 2025. So that is more than 5 months ago. A bearish trend or bearish continuation would require lower lows in those 5 months. The fact that after the low in February there was a small recovery and this recovery ended as a higher low on the retrace, means the downtrend reached its end. Since the downtrend is over, we are seeing consolidation, accumulation before the market turns. The turning is the bullish cycle, the uptrend. And we are in the process of seeing this change materialize into the market, price and chart.
The minimum target is the "baseline level" between $7.44 and $6.20. The target to aim for should be $18 and if you are feeling optimistic then $28. I've seen this project grow incredibly strong in the past so I wouldn't be surprised if it ends up moving even higher.
This is a simple chart. What goes down, must come back up; specially when we are talking about Crypto. The best financial market in the whole world. Young, but highly profitable. Risky? I don't know... It is risky to be young. But the potential rewards make up for any risk the market carries. We can take risk when we are young. We should. You play it safe because you are old. No risk, no fun. Plan ahead, success is yours.
Namaste.
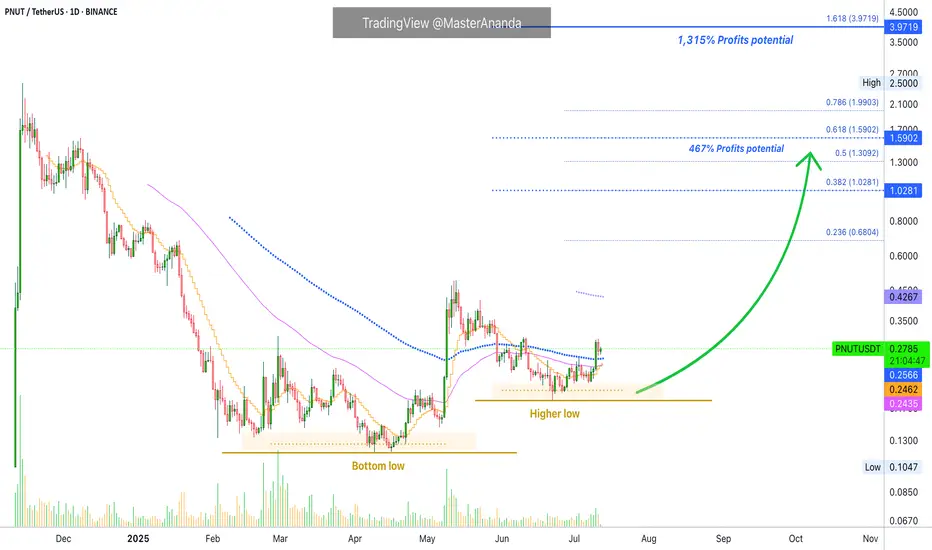
Peanut the Squirrel 1315% Profits Potential · Technical AnalysisI noticed that most of the memecoins have a strong growth potential. Here we have PNUTUSDT and the potential goes easily beyond 1,300%. An easy target is set to 467% so you can imagine. The chart looks strong and you know we focus only on TA.
Good evening my fellow Cryptocurrency trader, I hope you are having a wonderful day.
Peanut the Squirrel. Who am I to judge? RWA, Layer 1, POW, Gaming, DeFi, Infrastructure, NFT, AI... The choice is yours.
Here we have the classic and more than classic higher low. The bottom low and the bullish breakout ending its retrace higher is as easy and simple as it goes. The beauty of TA. You can know where the market is headed based on how the candles behave.
And then, we are back to the EMAs. Notice the blue one because it is the main one I'll be using on the daily timeframe. The huge big candle happens to break above this level. Once this level is conquered as resistance we know the bulls are on. Now the market can rest but it can also move ahead. We have a higher low, PNUTUSDT, and the action happening above EMA89, EMA55 and EMA13; in short, the bulls win.
The next higher high and first target is $1.03. This is followed by $1.59, 467% potential for growth and then the market can continue higher, easily, because we are entering the strongest ever Cryptocurrency bull market.
Namaste.
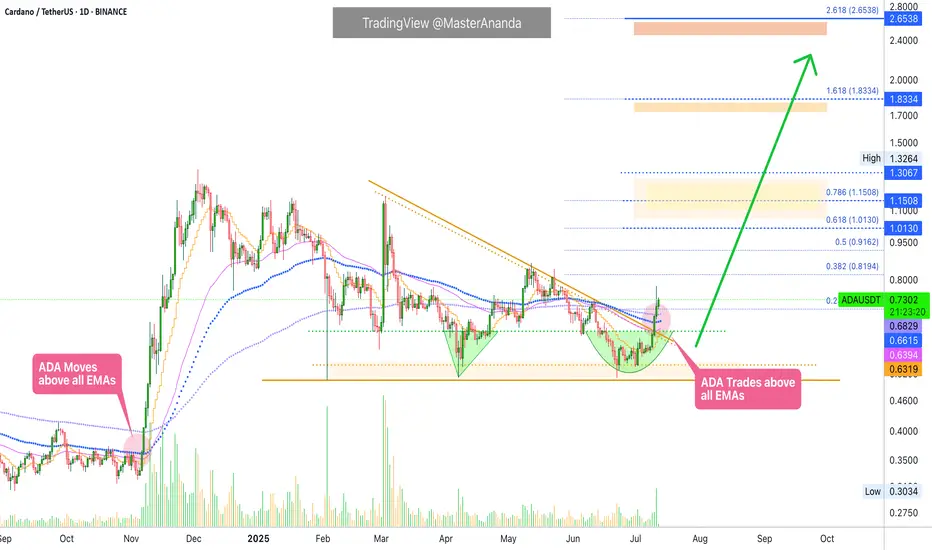
ADA Daily Update · Moving Averages · 262% Target ExposedGood morning my fellow Cryptocurrency trader, I know you are having a wonderful day because the market is doing great. We looked at Cardano together on the weekly timeframe and this is a big picture but what about short-term? Where are prices headed next? The next target, resistance/support and the moving averages of course.
I've been looking at the moving averages lately and this is a theme that I will continue for a few days, or weeks, once we exhaust it we use other indicators. You know we also like the RSI and MACD, candlestick reading, volume, chart structure, chart patterns, market cycle, etc. Marketwide action, subtle signals, market sentiment, on and on.
Cardano is already trading above many major moving averages but this is a recent event. First consider the fact that in late 2024 ADAUSDT grew 320% right after breaking above the same EMAs that I am showing you now.
ADA closed just recently above EMA89, EMA233, EMA55, etc. Only MA200 is missing and this is an important one but will soon break. I am not showing it here because the action is still happening below.
There is a rounded bottom. This alone is a reversal signal already confirmed because the action is happening above the base of the pattern. In April we had a triangular bottom and here we can see an alternation. In February it was a straight line. A straight line, a triangle and then a circle; interesting.
The bullish bias is confirmed and we are seeing straight up, the next target is 0.8194. Cardano has been green four days straight. Go back to November 2024... The possibility exist for continued growth. Day after day after day. At some point there will be a stop, can be a retrace or correction. Know that when this stop happens it is not the end. There will be several stops along the way but we are set for a strong new all-time high. You will need to be patient while holding but just make sure to aim high. Don't get greedy of course. If at some point you start to feel anxious, read on the topic, go out into nature or simple sell a small portion until you feel better. The best choice is to be prepared and this can be done by studying the charts and the market. If you have a good plan and a nice map you will do fine. If you are an advanced trader, I am sorry, let's get back to the chart.
$1.01, $1.30, $1.15. These are all resistance. So there will be some challenge around this price zone. Once it is conquered though the advance should be swift until 1.83. Another stop and then 2.65 which is the main target for 262%. Depending on how this level is handled we will update the chart and the targets. For higher targets look at earlier analyses or those on the weekly timeframe.
Thank you for reading.
Namaste.
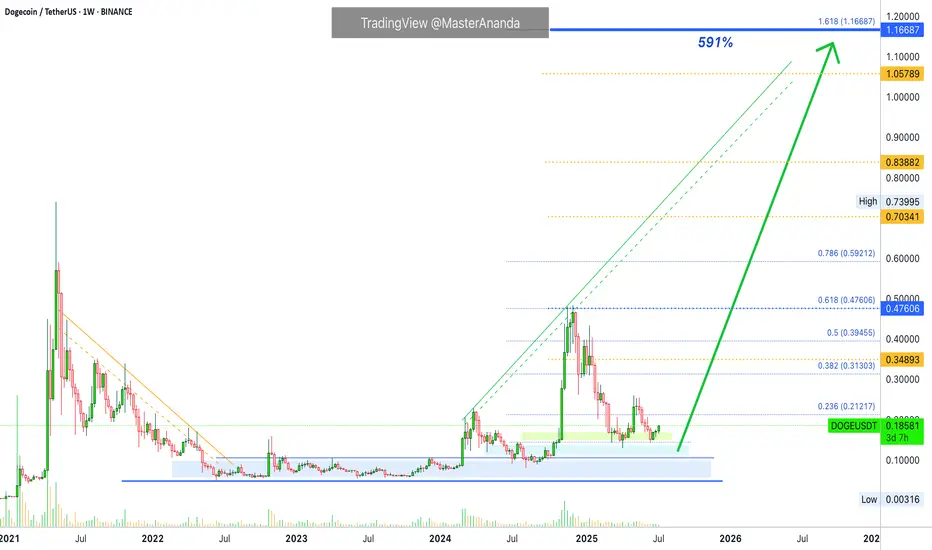
Dogecoin Prepares 2025 Bullish Wave · New All-Time HighThe last time that Dogecoin produced strong bullish action was November 2024, more than 217 days ago. Before this wave, there was a small period of growth in early 2024 and that's about it, the market was bearish for a long-time after the 2021 all-time high. There is good news though. Dogecoin is preparing for a new major bullish cycle and this cycle is already in place.
Since mid-March 2025 the action has been weak. No growth but no decline either. Between May and June, there were more than 8 weeks of bearish action but Dogecoin's price remains strong within a mid-term higher low. The last three weeks have been green with this week being full green trading at the top of the candle, the market is about to produce a major advance.
If you look back to October 2024, late, you will see small candles then several huge big candles, maximum growth. That's how Crypto tends to operate. One day the market is silent, the next day we are witnessing the strongest ever bullish wave. This is what Dogecoin is getting into right now.
If you look back to early 2021 it is the same. Late March and early April 2021 we have very small candles and then everything changes suddenly and the market produced astonishing growth. We are on the verge of such an event, the 2025 bull market phase and bull run. Get ready and prepare for a new all-time high.
Namaste.
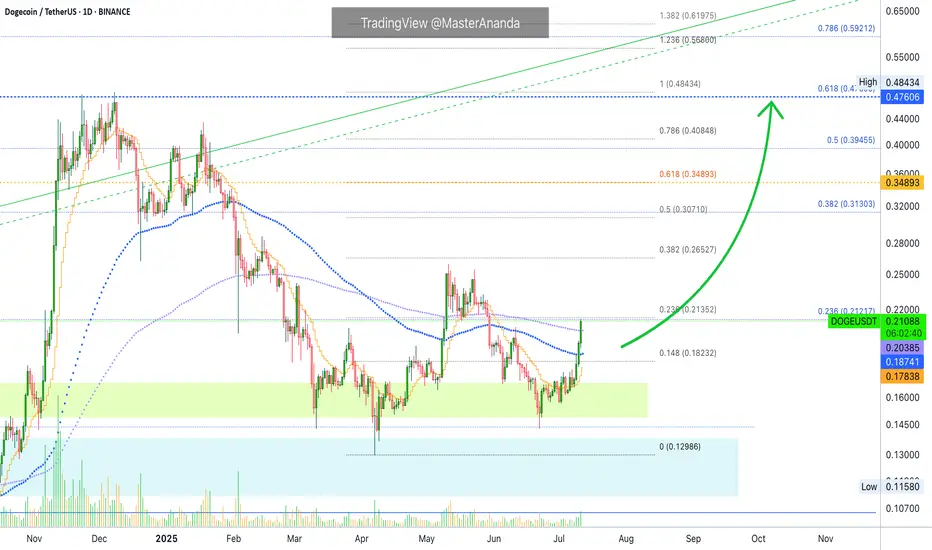
Dogecoin Daily, A Closer View · Next Target, How To Trade & MoreYesterday Dogecoin moved above EMA89, a major long-term moving average. Definitely bullish confirmed. We are giving Dogecoin a closer look because the other chart was based on the long long-term, the weekly timeframe. With this one, we will know exactly what happens next.
Today, DOGEUSDT is moving above EMA233 and this one is super long-term. Immediate resistance is found at 0.21300 but this is likely to break right away, always allowing for a few days of fluctuation because the market never moves straight down nor straight up. It fluctuates creating waves.
The next target after this one is 0.26500 followed by 0.34900. These can be hit short-term. In the coming weeks and days. After this one, we will aim at the last high which happened December 2024, now already a long-time ago.
The altcoins market is bullish but this bullishness is very early, it is only getting started. The market will be bullish for such a prolonged period of time that you will get used to seeing bullish action and at one point will become comfortable seeing your profits grow. When this happens, stay alert and make sure to secure some wins on the way up.
Do not chase rising pairs, buy those trading near support. Buy and hold.
This is the best strategy for maximum profits. Also, if you catch a winner, let it ride long-term. This also produces bigger profits in the end vs selling and trying to catch the retrace to buy again. It is better to buy big when prices are low and hold long-term. Only secure some profits when you are really high up, after 2-3 months. And of course, when the time for the new all-time highs is close, that's the time to close all positions.
Thanks a lot for your continued support.
Namaste.
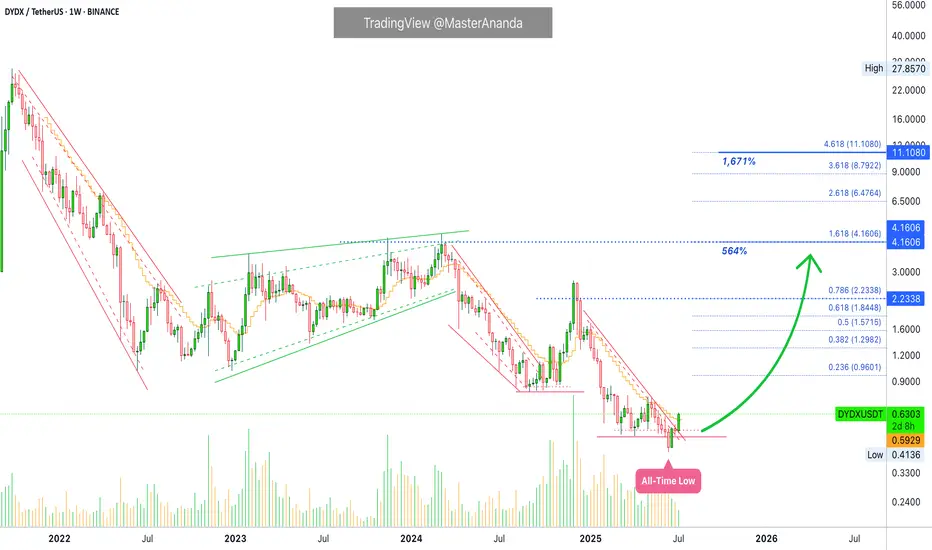
dYdX Hyper Bullish Market Conditions, $11.1 Next Target (1,671%)"Once we hit bottom, there is no other place left to go but up." dYdX hit bottom, a new all-time low last month and is turning ultra-hyper bullish this week. The action is already moving above EMA8 and EMA13 while breaking a local downtrend coming off the December 2024 peak price.
We have a full green candle and this candle signals a recovery and the start of the 2025 bull market cycle. This cycle can last 6-12 months for this specific pair or longer. Remember that each project, each trading pair, each altcoin can produce different price patterns and dynamics. This is easy to see because here we have a new all-time low, other pairs hit their all-time low in April this same year while others did so in August 2024, others in 2023, some others in 2022, etc. Each pair/project should be considered individually.
Good strong projects trading at bottom prices have higher potential for growth. For example, you can certainly make more money buying and holding dYdX tokens vs Solana or Ethereum. Because the latter two are trading much higher compared to their all-time high and because these projects are much bigger. Smaller projects have higher potential for growth.
So all is good in Crypto-world the market is going up. dYdX is turning bullish just now but the bias is confirmed based on marketwide action. Seeing how the other projects are performing predicts what comes next. When the week closes above EMA8 and EMA13, you have a full blown bullish confirmation. The action already recovered from the ATL range and is happening above the 10-March and 7-April lows. This is enough to secure/confirm growth.
We buy low to sell high. We buy when the market is red and hold.
We sell when prices are high. We sell when the market is green and there is lots of hype all around. Lots of profits to be made. At this point in time, all that is needed is to choose wisely and practice patience, patience will be the biggest earner; patience pays.
Thank you for reading.
Namaste.
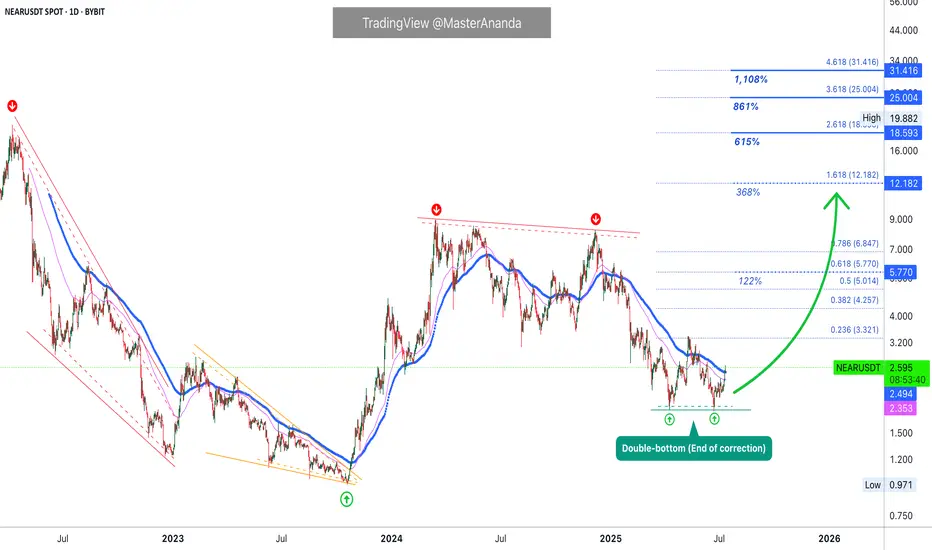
NEAR Protocol New All-Time High & Targets (PP: 1,108% Minimum)Here we have the same signal we just looked at in another publication, a break and close daily above EMA55 & EMA89. The bullish bias is confirmed.
The blue dotted line stands for EMA89 while the magenta one is EMA55. Once the action moves above daily, mid- to long-term growth is confirmed. Mid-term bullish above EMA55 and long-term bullish above EMA89. Near Protocol is bullish now.
NEARUSDT Technical analysis
On the main chart above we can see a peak March 2024 and a lower high in December of the same year. This means very strong, prolonged bearish action. After a strong bearish cycle comes a strong bullish cycle, the market tends to fluctuate, always fluctuating between bear and bull.
When the market is down, no need to worry because it will eventually grow.
When the market is up for a long while, watch out because a correction can develop anytime out of nowhere.
The cycles repeat over and over, again and again; forever, just like night and day. Winter, summer, spring and fall, the seasons. Everything in nature is cyclical, the market is no exception. We can use this information to our advantage, we know for certain that we are now entering a major growth phase because of the cyclical nature of the market.
The next high will be a major high compared to March 2024, and possibly a new all-time high compared to April 2022 which is the highest level on this chart. If you want to see bigger projections, go to my profile and search for NEARUSDT. You will find there everything you need.
NEAR Protocol new all-time high & targets
The first target is $12 for 368% profits potential. I don't count $5.77 because that is one of the easy targets. It is a shame to sell too early when prices are going really high-up. The $12 target would be the highest price in more than 3 years, since May 2022. This is the first higher high but not the end, the market is very likely to move higher, much higher.
The next target $18.6 for 615% profits potential. This is a good target to start. We then have $25 and $31 for a maximum of 1,108%. We should hit all of these targets within the next 6 months (6-8 months to be safe).
Patience is key. Buy and hold.
Thanks a lot for your continued support.
Namaste.
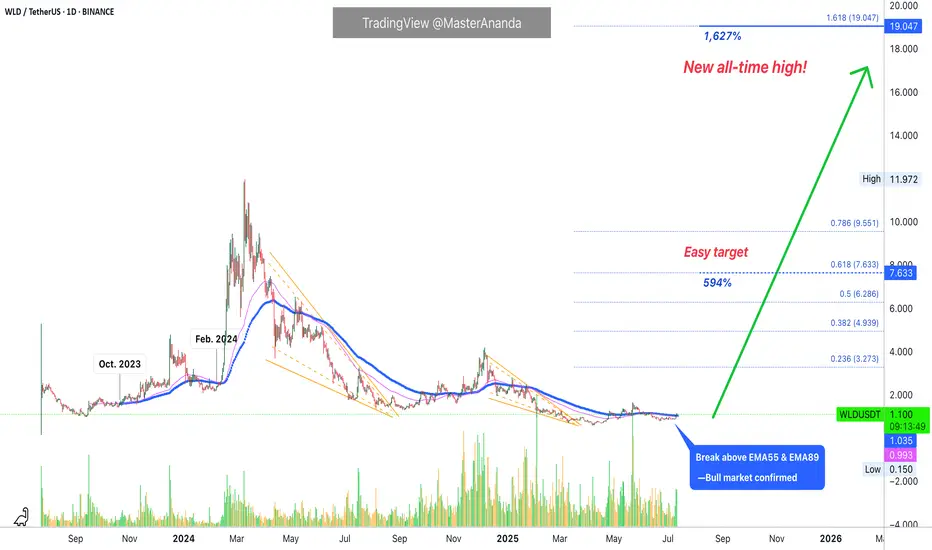
Worldcoin: The 2025 Cryptocurrency Bull Market (PP: 1,627%)Worldcoin's bullish bias is now confirmed. Back in October 2023 WLDUSDT broke above EMA55/89 daily and this signaled the start of a major bullish cycle. After moving below briefly in January 2024, the recovery above these levels in February marked the start of a major bull-run.
More than a year later, after hitting a major all-time low in April 2025, Worldcoin is once more trading above EMA55 & EMA89 on the daily timeframe. This guarantees and fully confirms the start of a major bullish cycle and wave leading to a bull run and new all-time high. The all-time high can happen late 2025 just as it can happen in early 2026. The path is green.
The future is bright for the altcoins market, for Bitcoin and this project. Many altcoins are looking great right now and producing the strongest growth we've seen in years. The best news? This is only the start, truly. We are set to experience much more of what is happening now.
The last bullish wave, late 2024, was short-lived, it only lasted one month. The small bullish reaction in early April was also short-lived lasting a little over than a month. This time it is so much different, we are set to enjoy continued growth for 3-6 months straight. This is the first time since late 2023 that the market will grow this long. Before late 2023/early 2024, the last period of sustained growth happened within the 2021 bull market.
We are about to experience the strongest cycle since the last bull market... Get ready.
Be prepared by planning ahead. The market will give you as much as you can take.
Thank you for reading.
Namaste.
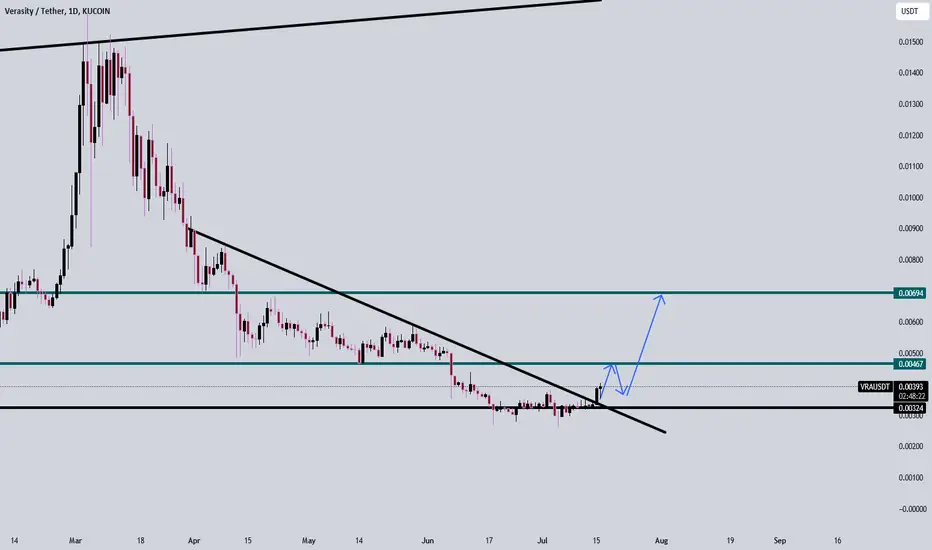
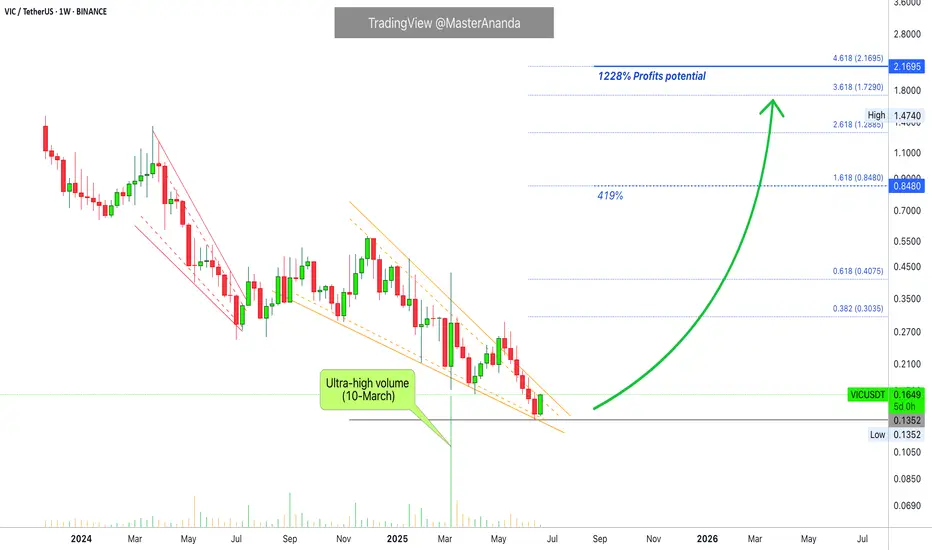
Viction Hits Bottom, 1,228% Growth Potential or HigherViction produced the highest volume ever on the 10-March week. All the other weeks have insignificant volume compared to this one and this session ended closing green. This is a strong signal.
A large part of the altcoins market produced a bottom 10-March.
Another signal that favors the bulls and the development of a bullish wave is the fact that bearish volume is very low as the market moves to produce lower lows. The final bottom happened last week and this week VICUSDT is full green.
There is a falling wedge pattern.
Seeing marketwide action and knowing the year is 2025 and we are already late for the bull market phase, we can be ready and should be prepared for maximum growth.
Thank you for reading.
Namaste.
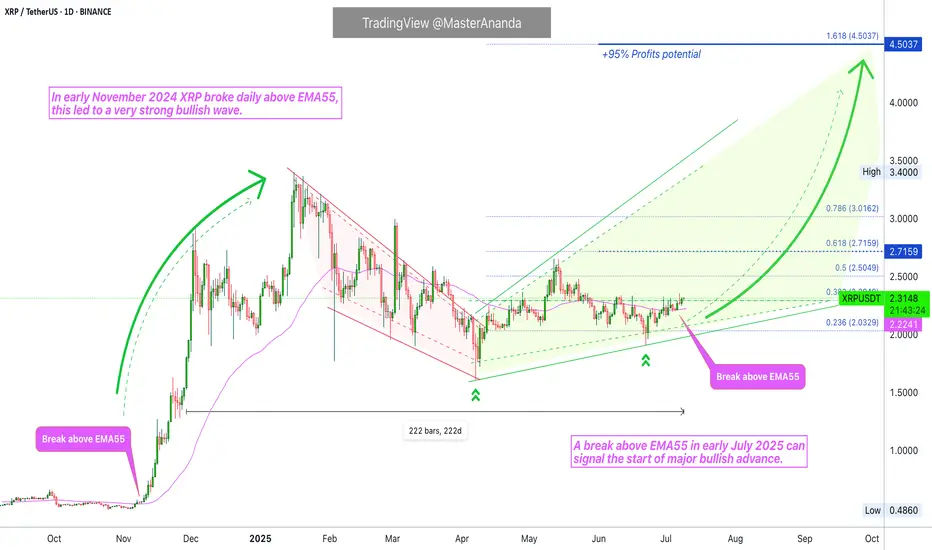
XRP Ready To Grow: $4.5 w/ 5X Lev = 475% Profits PotentialThe last time XRP moved above EMA55 daily was in early November 2024, you know pretty well what happened right after. Just a few days after EMA55 was conquered as resistance XRP grew from a price of $0.54 to a peak of $2.90 in less than one month. It continued to rise and peaked again but this time at $3.40. The market turns bullish above EMA55 and this same signal is active, valid, live today.
XRPUSDT has been fighting with EMA55, fluctuating around this level, since late April. Now, this resistance is no more. The bullish bias is fully confirmed after a decisive higher low. This is it... This is all we need, the next target is up.
» 95% is the easy target at $4.50. With 5X lev. we get 475%.
We've done this together many times before... This is not the last target but since this is a strong resistance we can wait for the retrace and enter again once support is found. That is, there will be a stop at this level.
This is a strong chart setup. The price is not the best ever, it would be better to enter lower and that is why we have only 5X. With a lower price we can do 7X, 8X and even up to 10X. Hardly ever I recommend more than 10X, it just isn't necessary and the risk is too high.
I am wishing you great profits and continued success.
This is a friendly reminder to let you know that XRP is ready to grow.
Thank you for reading.
Namaste.
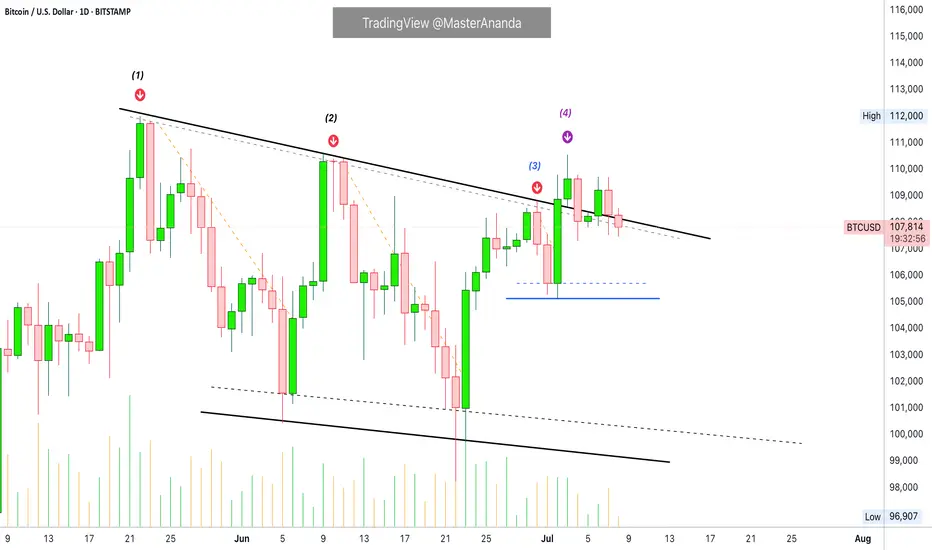
Evolving Price & Candle Patterns: BitcoinLook what is happening here with the candle patterns and price action. In the most recent challenge of resistance something changed. Change is good. It can mean the end of this sideways period.
At (1) Bitcoin finds resistance and immediately starts a decent. The same happens at (2). When we reach (3) everything changes. (1) & (2) produced a low and lower low. The down-move was extended. (3) produced only two red candles, a strong higher low and the third day was a full green candle moving above the descending trendline resistance. The price pattern is now erratic, completely different to previous moves.
Now, consider (4). If the strong green candle was intended as a bull-trap, then we would expect a down-move to follow right after the peak, just as it happened with (1) and (2). But nothing, after (4), Bitcoin has been sideways within the bullish zone.
This change is good, bullish.
A drop can develop anytime but the market already had two changes to produce a down-wave, (3) and (4). The fact that a down-move didn't materialize means that the market has something different in store for us, change. This change is good because when resistance is challenged, prices tend to drop when the market is moving within a range. No drop can signal the end of the range trading which in turn can translate into the start of the next bullish wave.
If this idea turns out to be true, Bitcoin will start growing within days. Growth should be strong because consolidation has been happening for months.
Namaste.
#AltSeason #Coming #Crypto #Pump #Soon#AltSeason #Coming #Crypto #Pump #Soon
According to the Bitcoin chart and Bitcoin dominance, as well as the Tether index and the position of altcoins, a new altcoin season is expected to begin.
Depending on your style and strategy, you can purchase altcoins in steps for your spot basket. The best time to buy a new step is now.
We will soon see 100% growth in altcoins ranked 1 to 10 in coin market cap, and altcoins in the following ranks can also pump 300%, 500%, and 800% and experience attractive growth.
Based on your strategy and style, get the necessary confirmations for this analysis to enter the trade.
Don't forget about risk and capital management.
The responsibility for the transaction is yours and I have no responsibility for your failure to comply with your risk and capital management.
💬 Note: Note that this analysis will only be fully confirmed if Bitcoin continues to grow and Bitcoin dominance continues to decline, in which case altcoins will start their main growth and get pumped. Otherwise, the previous scenario could repeat itself, with a correction to remove liquidity, liquidate long positions, and throw out traders, and the main rise will begin. Anyway, the new altcoin season is coming and will begin soon. Hunt down the crypto market pump by obtaining the necessary approvals.
If you are not an analyst and are not familiar with step buying, ignore this analysis.
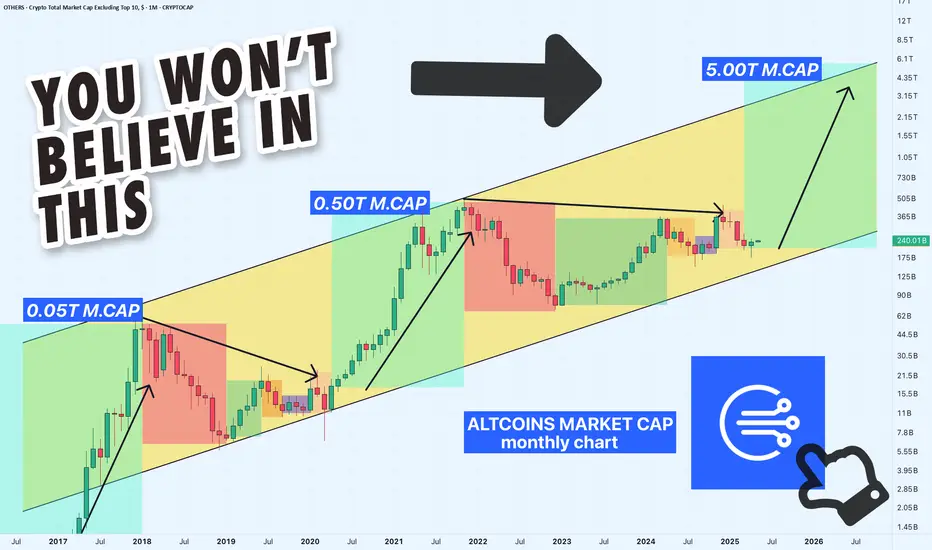
Altcoins Market Cap: We on the Verge of a 5T Exposion!Hey crypto traders! Let’s dive into this monthly chart of the Altcoins Market Cap. You won’t believe what’s brewing!
We’re currently approaching a critical channel support at 200B, a level that might act as a springboard for massive rally — check out the jumps from channel support in 2019 and 2023! Each time the market cap hit this support, it skyrocketed, and now we’re at that pivotal moment again.
The chart projects a jaw-dropping target of $5T within the next 24 months if history repeats itself!
The price action shows we’re testing the lower boundary of this ascending channel, with the market cap sitting around 239.65B. A bounce here could send altcoins on a parabolic run, potentially hitting 5T by mid-2026. But if support fails, we might see a dip toward 100B — let’s keep an eye out!
Key Levels to Watch:
Support: 175B (channel support)
Resistance: 1.55T, 5T (projected target)
Breakdown Risk: 100B
Are altcoins about to explode to 5T, or will we see a deeper correction? Drop your thoughts below!
PS take a look at others vs. btc price action here:
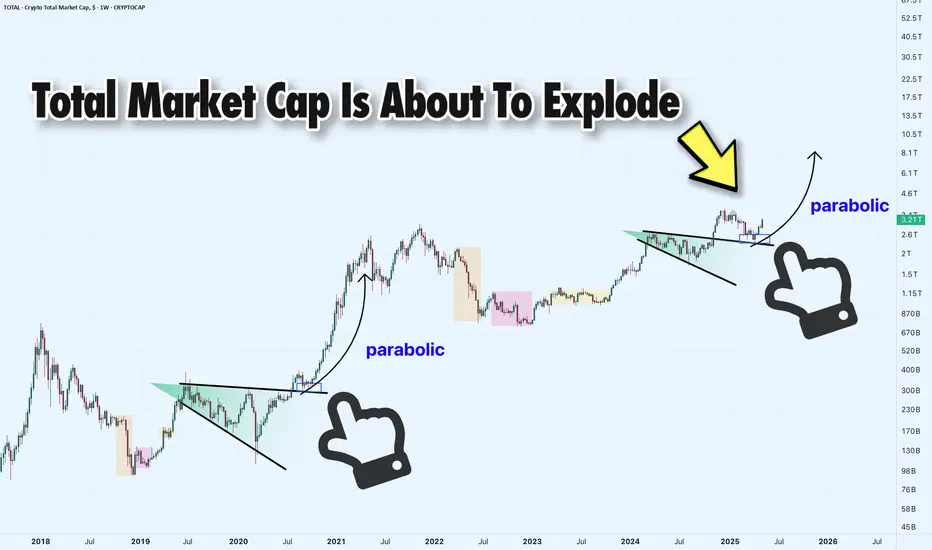
Total Market Cap Weekly Chart: Ready to Explode?Hey traders! Let’s dive into this weekly TOTAL Crypto Market Cap chart. The headline says it all— Total Market Cap Is About to Explode , and we’re here to break it down!
We’re seeing a massive expanding triangle formation, with the market cap currently at 3.21T , right at retest of triangle resistance. Historically, these patterns have led to parabolic moves — check out the 2019 - 2020 breakout! If history repeats, a breakout could send the market cap soaring toward 8.0T or even higher!
However, if the breakout fails, we might see a pullback to the previous level of support around 2T .
Key Levels to Watch:
Resistance: 3.66T (ATH)
Support: 2T
Breakout Target: 8.1T+
Breakdown Risk: 1.20T (latest strong resistance below 2.6T)
Is the market cap about to go parabolic, or are we in for a fakeout? Let’s hear your thoughts below!
Shiba Inu Still Early Massive Wave yet Bullish —1,558% PPThe blue pattern on the chart is an analog of the purple pattern but bigger.
It is still early for Shiba Inu (SHIBUSDT) because the action is happening below MA200. The long-term bullish bias is only confirmed once the action moves and closes above this level.
This shouldn't be considered bearish because we have a clear higher low based on the two different consolidation patterns. The purple one produced the main low and the blue one the higher low. Multiple higher lows.
Lows—support confirmed—in August 2024, April & June this year. And that's it. This weekly candle is now full green and everything is about to turn positive crazy. Shiba Inu has been bearish since March 2024.
There was some bullish action in November 2024 but it ended as a lower high, what a bummer. All this time with no new highs, no major growth. This cycle is coming to an end. The null cycle, the boring cycle, the little-to-no-profits cycle is over... That's awesome. What does Shiba Inu has in store for us?
A new all-time high to start. Maximum growth. Euphoria, higher prices; growth. It will be awesome.
I am giving you all of the targets for Shiba Inu (SHIBUSDT). The highest one is 0.000220491. Total profits potential reach 1,558% from current price.
There are two resistance levels of interest below the previous ATH: 0.000067612 & 0.000057511.
Minimum new 2025 all-time high we will go for 0.000103188 for 676%.
You can find more numbers and targets by doing a close-up on the chart.
I hope you find this information useful.
Your support is appreciated.
Namaste.
