Bitcoin Dominance, RSI Bearish Divergence & Decreasing VolumeThis is a classic signal and we are going to be looking at it on two different timeframes, daily and weekly.
Bitcoin Dominance (BTC.D) is producing a strong bearish divergence with the RSI. The weekly timeframe is very pronounced and I will show you the details below. This type of signal tends to support a change of trend. It appears before the reversal happens but sometimes it can take years before it goes into effect.
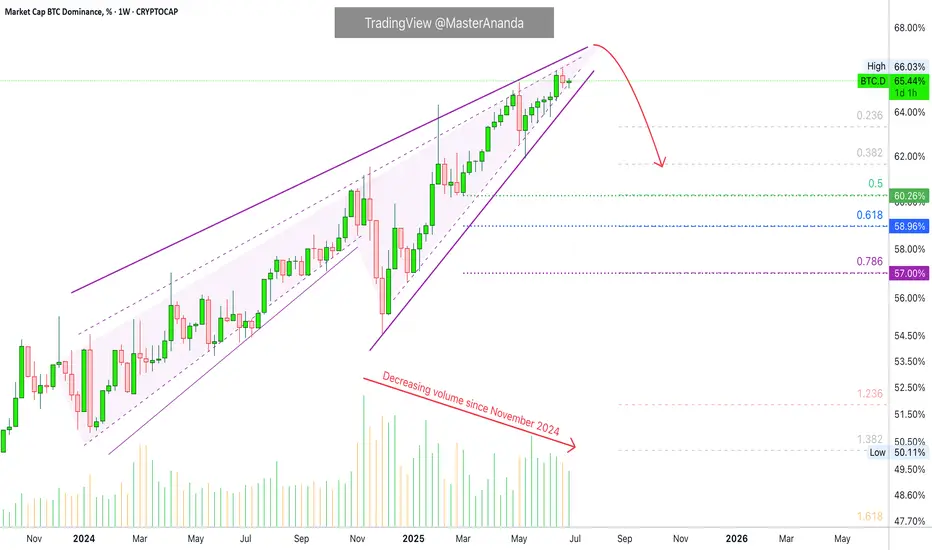
» BTC.D Weekly RSI
Here you can see the RSI peaked October 2023. Then a lower high October 2024, then again in April 2025 and finally last month.
As the RSI produces lower highs BTC.D is producing higher highs.
This signal is supported by decreasing volume. Bitcoin Dominance continues to climb higher while trading volume continues to drop. Both signal support a change of trend soon and together they become stronger.
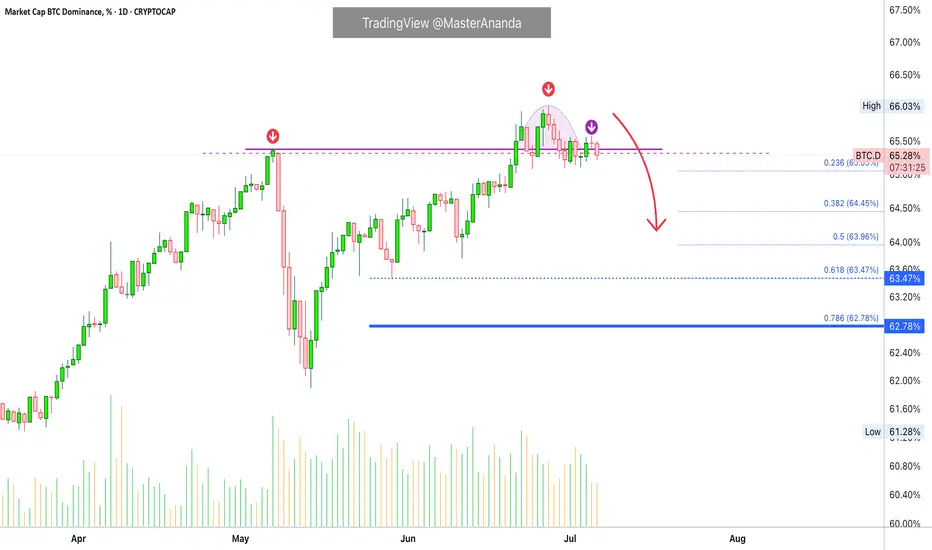
» BTC.D Daily RSI
The daily RSI peaked June 2023 but we will focus on the short-term as we already have a strong signal coming from the weekly.
Here we have a peak in May 2025 and a strong lower high in June. Needless to say, BTC.D peaked 27-June thus the divergence but the action is clearly weak.
» Bitcoin daily
There is a long-term rising wedge on the weekly timeframe and this pattern can also support a reversal.
All these signals are bearish but not very strong, still, there is some weakness on the bearish side for this index. This means that the action can turn bearish tomorrow or it can continue rising for weeks or months before turning red.
These signals are pointing to a reversal but they do not give us a specific date. Can happen next week, next month or in seven months. If we focus on the altcoins, the way they are looking and how long will it take for them to grow, then this index can turn bearish within 2-4 weeks. Bitcoin will also grow as the altcoins market grow. Everything Crypto will grow in late 2025.
Thanks a lot for your continued support.
Namaste.
Altcoins
Bitcoin Dominance Daily Bullish Altcoins ConfirmedThere is an interesting signal here on the daily Bitcoin Dominance index chart. Four days red. This signal has not happen since February and it is most certainly bearish.
After 26-June the index went red four days after hitting the highest reading since January 2021. This highest reading ended up producing a rounded top and the action moved back below the 7-May top which was the previous highest reading since 2021.
Now notice the purple line on the chart. This is the 7-May peak price. Yesterday, BTC.D was trading above this level but moved below today. The candle ended as a Doji, lower high and today turning bearish signals growing bearish momentum.
You can check the weekly timeframe for additional signals including the MACD and RSI. You can find it by visiting my profile @MasterAnanda (Make sure to follow.)
In November 2024 BTC.D went extremely bearish and the entire altcoins market produced a major advance; Bitcoin also moved forward, the same can happen today. It is not certain the specific date, can be tomorrow, in a weeks time or within months... What is certain is that the bullish wave won't last as little as in April-May 2025 nor November-December 2024, both instances lasted only one month, this time around the bullish wave can last between 3-6 months.
Some pairs will grow straight up for months. Others will experience strong volatility but with a bullish bias. Marketwide bullish action. Bitcoin and the altcoins.
Thank you for reading.
Namaste.
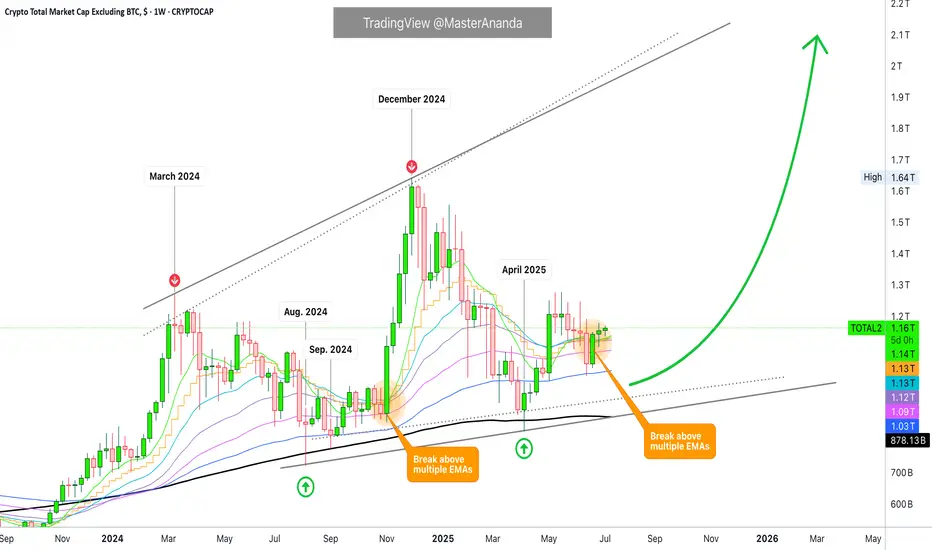
TOTAL2 Moving Averages · This Bull Market Will Change Your LifeMarch 2024 signaled the end of a bullish cycle. After this month, the Cryptocurrency market went bearish. TOTAL2 index went bearish. As it was bullish, it traded above all the moving averages plotted on this chart. As it went bearish, all the moving averages broke as support but one, MA200. The back line on the chart.
MA200 works as support and denotes the broader and bigger cycle. As long as the action happens above this indicator, the market is growing thus bullish long-term. If the action moves below, the bears are in and winning.
Another strong moving average is EMA89, blue on this chart.
When TOTAL2 was bearish it managed to close only briefly below this level. One week and the next week back green. August 2024 and September 2024 TOTAL2 found support at MA200 and EMA89. As soon as these indicators were confirmed as support, we saw the development of a new bullish wave.
The altcoins market grew in November leading to a peak in December 2024. Here the same pattern repeats. TOTAL2 went from bullish to bearish. While it was bullish, it traded above all of the moving averages: EMA8, EMA13, EMA21, EMA55, EMA89 & MA200. As it turned bearish, all these moving averages were tested as support, all of them broke but one, MA200.
In April 2025 MA200 was tested as support and holds. As long as TOTAL2 trades above this level, we know the bigger broader market bias remains bullish. Bullish confirmed. As soon as this level was tested we had a small recovery above all moving averages, until May. Then a retrace led to a test of EMA89 as support and this level holds.
When TOTAL2 trades above all the moving averages, bullish confirmed.
TOTAL2 is now trading above EMA8, EMA13, EMA21, EMA55, EMA89 and MA200 on the weekly timeframe. Ultra-bullish and ready to grow.
Just as the December 2024 high was a higher high compared to March 2024, the late 2025 high will be a higher high vs December 2024. We are in a rising trend and this is confirmed because MA200 always holds as support.
Now that this level has been confirmed, we can expect additional growth. Instead of a single month of bullish action as it happened in late 2024, we can expect a minimum of 3 months of continued growth. In total, we will have at least 6 months, and then some more.
Because it is unexpected, this bull market will change your life, forever. You will receive more benefits and more blessings than anything you can ever imagine. All your hard work will pay-off. You will be rewarded for your patience, persistence and continued support.
Namaste.
Syscoin: From Bearish to Bullish, The Market Wants ChangeChange is good, but it is not always mandatory. Change is good and recommended only when we are stuck in a certain pattern, in a certain routine or lifestyle, in a certain way of being and we want to experience growth. Exponential growth. When it comes to growth, change is awesome.
Market conditions are changing. Very slowly but still, change is change and change leads to growth. If the market has been stuck too long in the same pattern, the same condition, stagnation is the result.
The market is alive. The market has goals and its goal is to reach you; in order to reach as far as you, the market must grow.
The market understands this dynamic and it will do whatever it takes. The market will not die, it cannot die, so it will do what is necessary in order to promote its own growth. If what the people want is a bullish wave, higher prices, high profits; get ready because the market will give you exactly what you want.
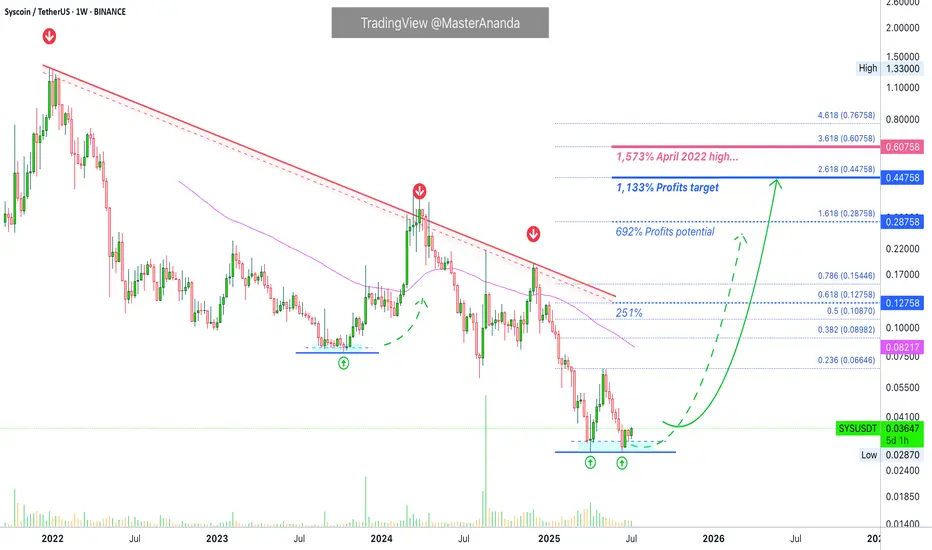
Syscoin has been bearish since December 2021. Apart from a few small bounces, 140% and 400%, it has been going down and really strong, just recently, we witnessed a new all-time low.
Syscoin will not continue in the same pattern for long. In fact, the all-time low happened 7-April, in June, last month, we had a double-bottom (higher low). So the downtrend is over, we are approaching a wave of growth.
The market is changing. The market will change. The change of course will be a major bull run. Instead of lower prices, we will have a multiple-years high, maybe even a new all-time high in the coming months.
In late 2025, everything Crypto will be up. We even have the potential of a multiple years long bull market. Do you agree?
Thanks a lot for your continued support.
Namaste.
Space and Time Buy Zone: 1,000% or More Profits PotentialWhen the market is no longer bearish we know that something changed. We are going to be looking at the same price pattern we've been looking at on multiple charts.
Space and Time (SXT) was bearish, strongly bearish within a falling wedge pattern. On June 22 the bearish action ceased completely and the pattern broke. SXTUSDT went from clearly DOWN to clearly SIDEWAYS action. This is a huge change in price and candles pattern.
The highest bearish volume came in early May and later late May. As prices move lower, trading volume continued to decrease. As the ATL was hit, bear volume was really low. Lower lows with decreasing volume indicates the bearish move is losing force. Sure enough, the next day we get some green candles and volume starts to go up.
The market is changing, we are going from bearish to bullish and we are now in the transition period, prices moving within the buy zone.
This is the opportunity to buy within the accumulation range. The prices now are the best before a bullish breakout and major bullish run.
This looks like a good pair, the chart shows very low risk vs a high potential for reward. We are approaching the pair short-term because of the young chart, but you can buy and wait until prices grow. This pair can easily give 1,000% or more.
Namaste.

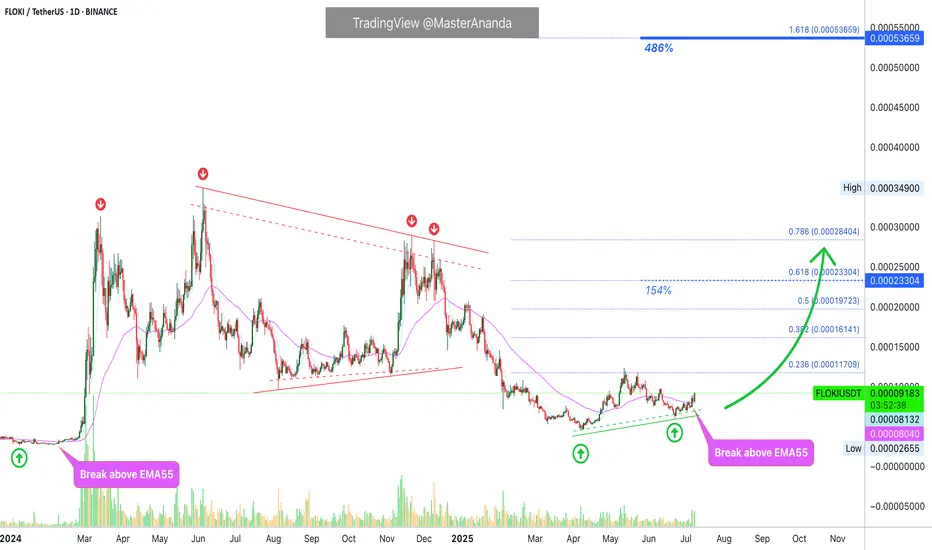
Floki Inu Bullish Signal Fully Confirmed (486% Easy Potential)The last time FLOKIUSDT moved above EMA55 daily, it produced a bullish wave exceeding 1,250% profits, within months. This same signal, the same development is happening now after years of bearish action and months of consolidation. In short, a very strong bullish reversal signal is now present on the chart.
To be honest, that's all there is. More information can just get things confused but, let's proceed.
The downtrend ends and we enter a transition period.
The transition is over and we enter an uptrend. That's all there is. Floki Inu is set to grow.
The bullish bias is already confirmed. As FLOKI now trades above EMA55, trading volume continues to increase. The chart structure is also perfect for a bullish wave. The last major low is still a long-term higher low compared to the bottom prices before the 2024 bullish wave.
Unlike in the past, there is no need to wait for months for this jump to come to be. Floki will start moving within weeks, maximum. It is possible that the next bullish wave goes into full force within days. The entire altcoins market has been consolidating long enough. The time is now.
Thanks a lot for your continued support.
Namaste.
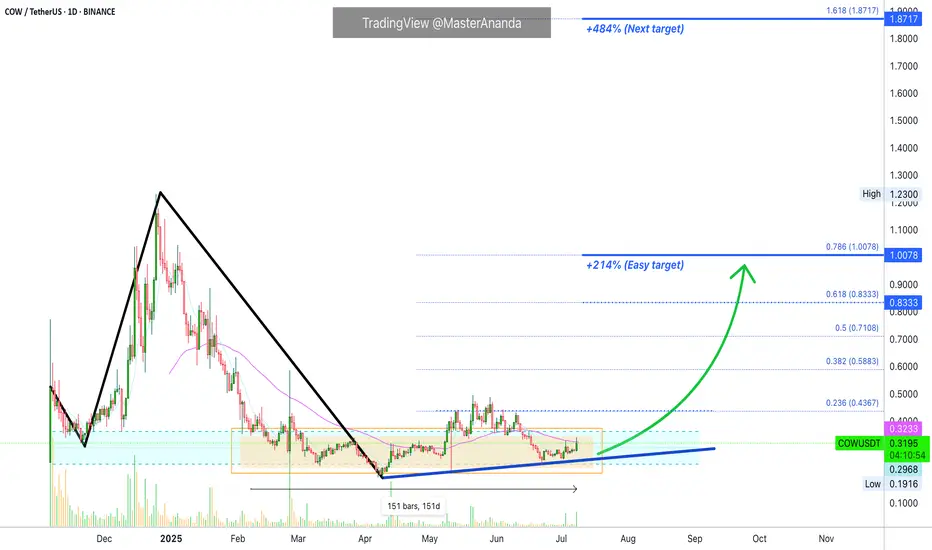
CoW Protocol About to Enter Bullish Zone (214% Easy Target)'Next target' has 484% profits potential. This target is projected to hit mid-term, that is, within 3 months (90 days)... Boost & keep reading below!
Good afternoon my fellow Cryptocurrency trader, I hope you are having a wonderful week and day.
COWUSDT is about to enter the bullish zone, when the action moves above EMA55. The magenta line on the chart.
This altcoin is already bullish because it is no longer bearish. The low happened 7-April and as you can see, the market has been sideways since early February. 150 days. More than 5 months.
Notice how daily trading volume is almost flat but some days stand out with increased buying. You see green bars shooting up but never red bars. This reveals a bullish bias. We are witnessing the early days before a major bullish breakout. One that will lead to 200% and up to 500% profits mid-term. Long-term, there can be more.
Thank you for reading.
Another easy trade, huge profits, easy chart. Buy and hold.
Namaste.
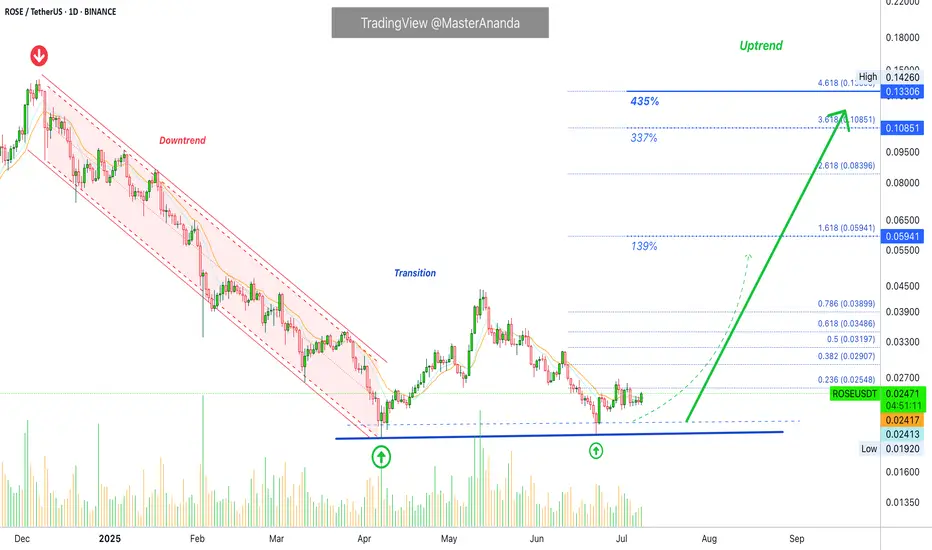
Rose Network: Double-Up Within Weeks (PP: 435%)ROSE grew 130% between April and May, a relatively small wave. The peak happened at 0.04424. The low in April happened at 0.01920. The previous wave high in early December 2024 happened at 0.14260. As you can see, a relatively small wave. But this is good news.
In June we get a higher low compared to 7-April. A technical double-bottom. This double-bottom/higher low reveals a higher high next. This is why this is a good an easy setup. The next target is already confirmed. We can buy easily; no stress, fully relaxed, because we know prices will grow.
We know prices will grow because they grew in April and now we have the same low. The downtrend is no more and thus a new uptrend starts. 139% is the very easy target based on the short-term. Mid-term and long-term there will be so much more growth. 337% & 435%.
Thank you for reading.
I like this one. It is an easy win. Easy pair to double-up.
Namaste.
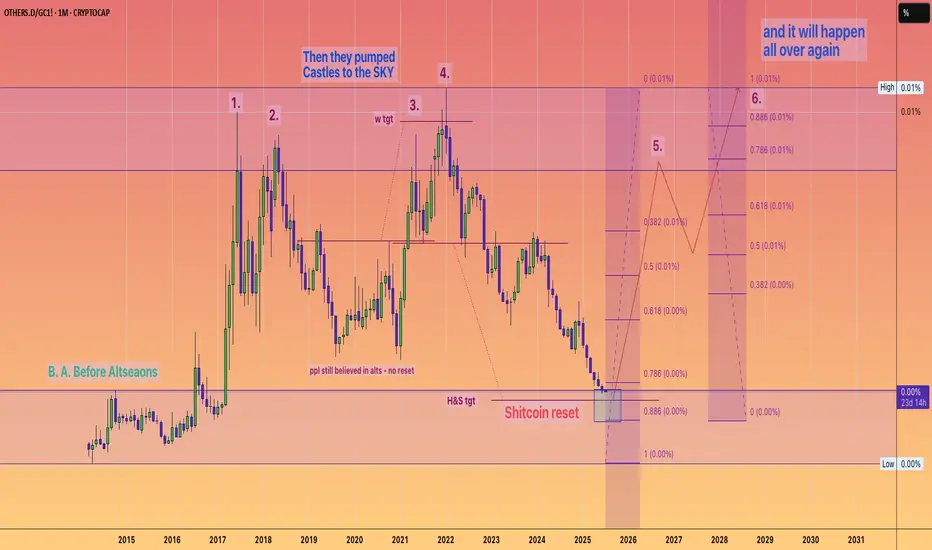
#OTHERS.D ~ Do you believe in Castles in the SKY?I believe that the Others dominance metric divided by an ounce of real money #Gold gives us a valuable insight into the fabled altseasons.
Because as this chart shows theres only been 4 in actuality
and you normal get a double bubble in a cycle.
So I believe we are at the cusp of turning things around as most people have given up on the concept of altcoins ever pumping again.
But it was just the business cycle #PMI that has depressed prices for the past few years.
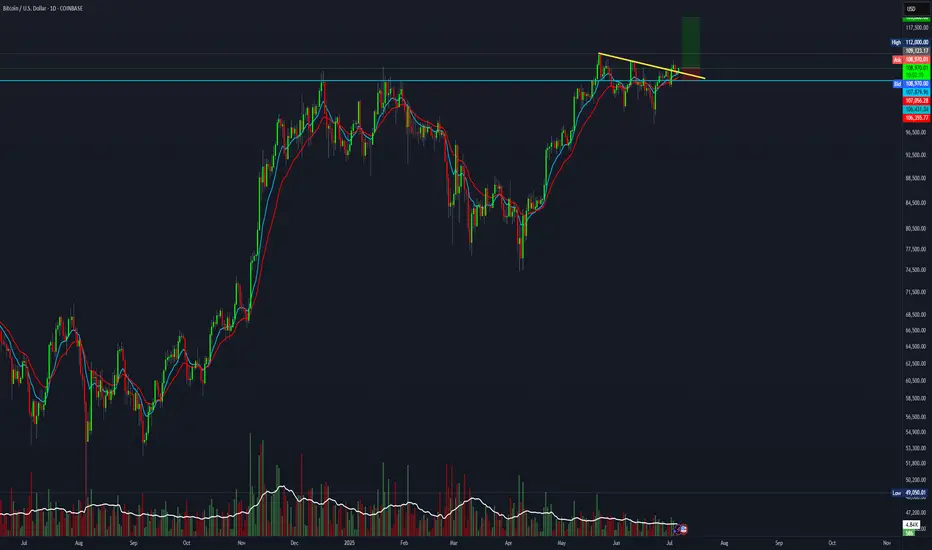
BTC setup with a 3.9 risk-to-reward ratio.Is BTC beginning a bullish move toward 120K?
This setup offers a 3.9 R:R with an
Entry at 109,000
Stop loss at 106,355
Target 120,000
Not financial advice.
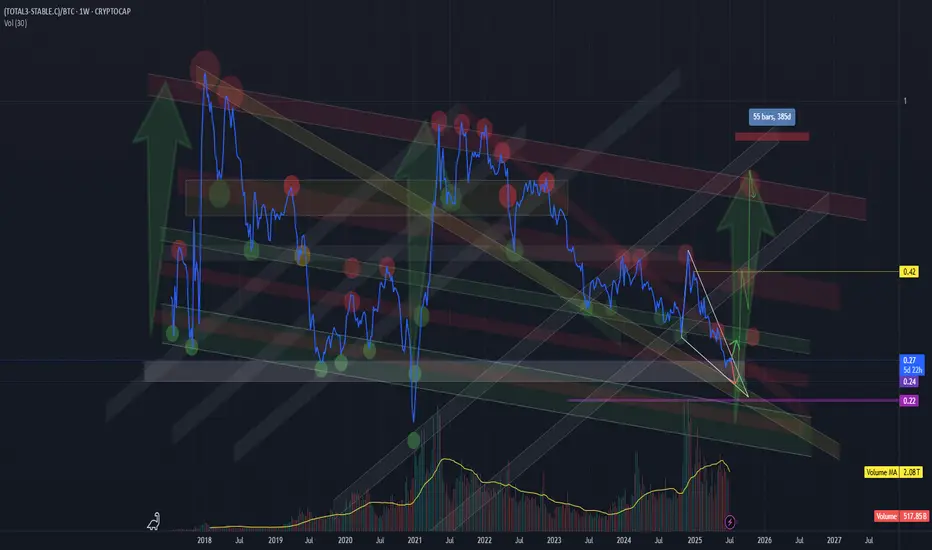
True altcoin-to-BTC strength indicator(CRYPTOCAP:TOTAL3-CRYPTOCAP:STABLE.C)/CRYPTOCAP:BTC
This formula strips out the noise and gives a true altcoin-to-BTC strength indicator.
STABLE.C removes all major stable coins (USDT, USDC, DAI, etc.).
The chart clearly shows previous capitulation zones and launch points for altseasons since 2017
Current formation – potential triangle:
Market makers appear to be coiling price action, forming a triangle-like structure.
This often precedes a volatile breakout — likely to the upside if history repeats.
Market psychology:
Many traders are already heavily positioned in altcoins, which suggests we could be nearing final capitulation.
Historically, altseasons never began with euphoria — but rather fear, exhaustion, and apathy.
BTC halving occurred in April 2024, and typically, the peak of the altseason follows 12 to 16 months later.
The seasonal strength of Q4, often fuels altcoin rallies.
!!! A final washout into a key support zone (on this ratio) could mark the trigger for the next major altseason — possibly starting around August 2025 !!!!!!!!
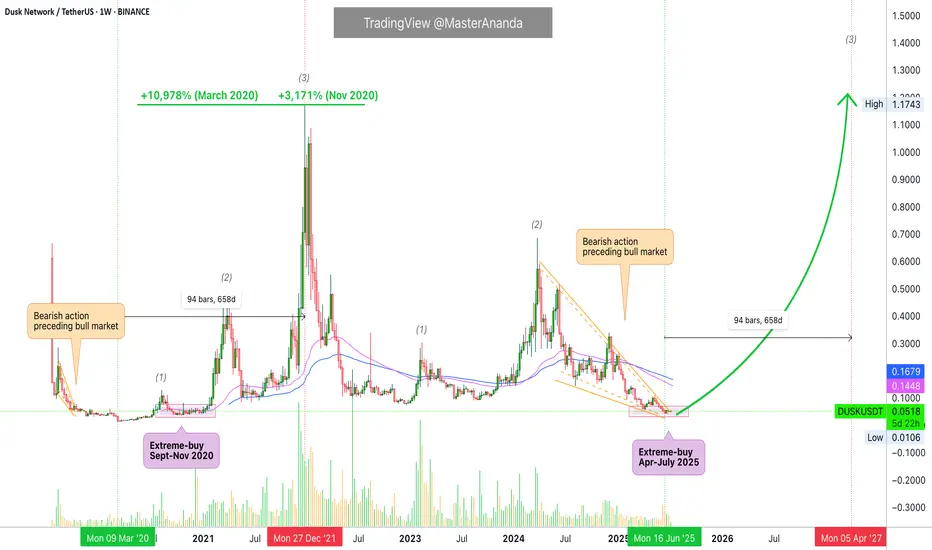
Dusk Network Major Buy Opportunity, 2020 Bull Market Revisited Today Dusk Network produced the highest buy volume since early February, a pretty good signal. On the weekly timeframe, the action is happening at extreme prices, the "opportunity buy-zone."
DUSKUSDT moved below all support from 2022, 2023 and 2024. The action is happening now at the exact same baseline levels from November 2020, before the last bull market.
» From its Oct. 2020 low (0.0359) DUSK grew 3,171%.
» From its Mar. 2020 low (0.0106) DUSK grew 10,978%.
The current low happened June 2025 at 0.0427. The bearish action preceding this date can be equated to what happened before March 2020. There is always strong bearish action preceding a major bull market.
The last bull market lasted 658 days, from bottom to top. From March 2020 until late December 2021. It is hard how to say how long the next bull market will last but a similar duration would lead to April 2027 being a major date.
A bull market can happen within 6 months, just as it can take years for the entire process to unravel. Since market conditions are so different now with all the innovation, adoption and expansion, we will have to wait and see.
The fact that we have the lowest prices in almost 5 years is also an interesting fact. All weak hands have been removed and this opens up maximum growth potential in the coming years.
I think we will have an extended bull market because it is already July 2025 and we have only very early signals, which means that it will take at least 4-8 weeks before full marketwide bullish action becomes the norm, August-September 2025. Activating 2026 minimum for new cycle tops.
Conclusion
Dusk Network is trading at bottom prices, a great opportunity to accumulate; buy and hold. The future is bright for this coin.
Namaste.
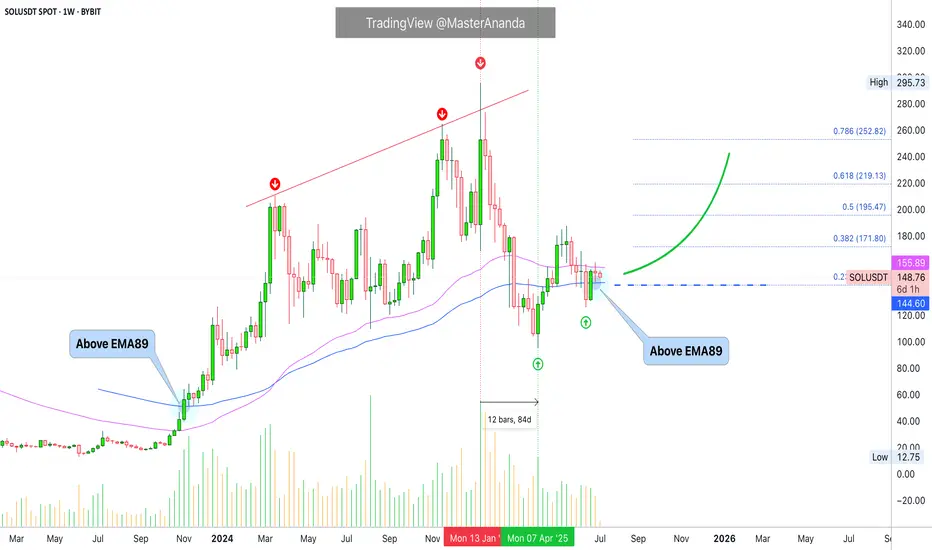
Solana Moving Averages: Patience is KeySolana is trading above EMA89 while at the same time trading below EMA55, we have a mixed situation. When in doubt, stay out. Anything is possible on this chart.
There was a major correction already that lasted 84 days. Solana lost more than 65% in this correction. A -67% drop. This correction removed all gains from 2024 sending prices back below $100. This is to say that Solana already went through a full and major flush.
The market could very easily continue lower and produce a lower low compared to 7-April, a major crash leading to August and I can easily see this scenario developing. Will it develop? Is it really necessary?
I can also see a slow but sure change of course. A few days red at the start of the week, as it is usual and then Boom!, the market turns green. And it grows day after day after day. It is already happening, patience is key. Better focus on the numbers.
» If Solana trades weekly above $142, we are bullish, strongly bullish and can expect additional growth.
» If Solana moves and closes weekly below $142, market conditions still remain bullish but we can approach this pair with caution.
» On a broader perspective, any trading above $95, the 7-April low, is bullish long-term. As long as this level holds, we can expect higher prices. The last low sits at $126...
It doesn't matter how you slice it, the price is good and is more likely than not to continue to increase. Patience is key.
Namaste.
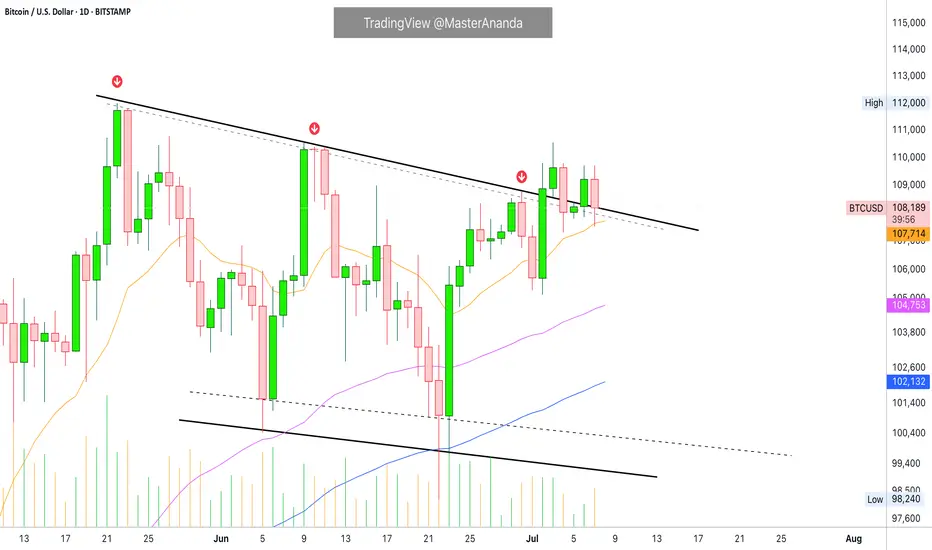
Bitcoin Daily, Mixed Situation · Bitcoin vs Altcoins · Not MixedI came with the intention of doing an update on the weekly timeframe, the chart doesn't look great.
Here we are looking at Bitcoin daily and once more the situation is mixed to say the least. It is hard to predict with exactitude with such a chart. In this case, we have to look for clues in other places. The altcoins.
But before we go there let's consider a few of the actualities that are present on the Bitcoin chart.
Bitcoin price action
Mixed or not mixed, the action continues to happen at resistance against all odds; this is bullish.
Bitcoin is trading safely above $106-$107,000 daily, and this is also bullish.
Bitcoin is trading above all moving averages we track and nothing is more bullish than that. MA200 sits around $96,000. EMA55 at $104,700 and EMA13 at $107,700.
Bitcoin will be bullish regardless as long as it trades above these levels and at a such strong price. So the mixed part is only psychological. It is mixed because people are afraid of a drop or want to see it drop. It is bullish based on the actual numbers and the chart.
The altcoins market vs Bitcoin
Some altcoins are breaking up today two to three digits green. Those good old reputable projects. This wouldn't be happening preceding a major bearish wave. Such strong action on the altcoins tends to precede a major bull market. Last week there were other pairs breaking really strong, the previous week another group, this week a new group and so on. Slowly but surely the low prices are disappearing but this isn't still a marketwide occurrence, we can see/say that the market is in no hurry.
Another relationship between Bitcoin and the altcoins relates to how many are behaving; when Bitcoin is about to crash, the altcoins tend to crash really strong and fast. The altcoins don't wait and just go down and continue diving deep if Bitcoin is about to produce a major crash. But this isn't the case, many altcoins are already at bottom prices but not based on a crash but a very slow and drawn out retrace. From these lows they are recovering strong.
When Bitcoin is bullish, sideways with a strong price within a bull market, the altcoins tend to grow. It is the same signal looked at from a different perspective. These altcoins are telling us that behind the scenes Bitcoin is bullish and we know Bitcoin is bullish because it is trading above $107,000. A bullish continuation is the next logical step.
Thank you for reading.
Boost if you agree.
Namaste.
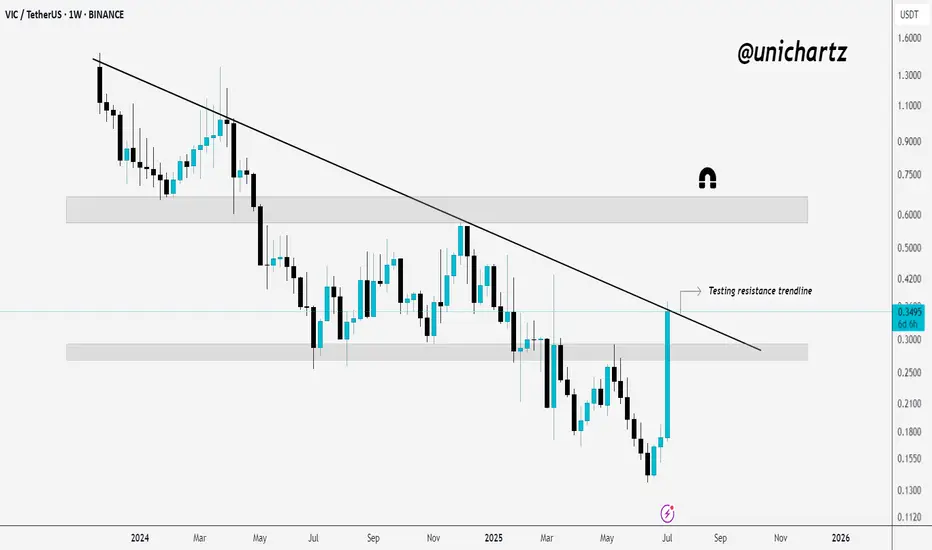
VIC Faces Crucial Resistance Test After Explosive RallyVIC just popped over 100% and is now testing a key resistance trendline.
After weeks of sideways chop and downside pressure, VIC has made a strong bounce off the demand zone and is now pushing right into the falling resistance trendline.
This is a crucial level, if it breaks and holds above this trendline, we could see a shift in structure and more upside toward the next supply zone.
But if it gets rejected again, price might cool off and retest lower supports.
DYOR, NFA
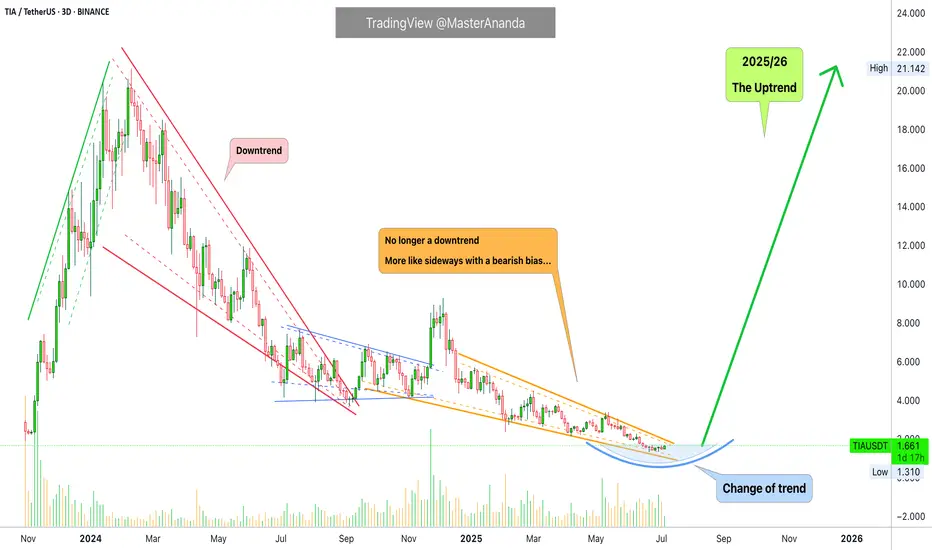
CelesTIA, All-Time Low Last Month, Trend Change—2025 Bull MarketI am showing multiple charts but my prediction is that the market will turn—the entire Cryptocurrency market—the altcoins market will turn bullish.
CelesTIA
There is an uptrend between late 2023 and early 2024, the same with the rest of the market. There was also a bullish wave late 2024. Huhhh, there will be an uptrend in late 2025 and early 2026.
Ok. Celestia. TIAUSDT.
It is easy to distinguish the downtrend vs no more downtrend.
The period drawn orange did produce lower lows but it is very different compared to the "downtrend," red on the chart.
So this is the transition. Strong down, then sideways, then up.
This pair is producing lower lows in its consolidation period but I also showed you many pairs that are producing higher lows, it makes no difference. Lower lows or higher lows, the action is very different compared to the "downtrend." The downtrend is no more.
My thesis concludes with a change of trend. This is where everything is leading, hundreds and hundreds of charts, more than 500 since 7-April. They all say the same.
In short, these hundreds of charts are saying that the market is about to become extremely bullish and that is something that we welcome with open arms. Actually, we have been waiting patiently, and some not so patiently, for this change to occur.
Many trust me; trusted me;
Many doubted me and that is also ok.
I love the truster and the doubter...
I love the reader and the follower...
I love TradingView and the Cryptocurrency market; but I will be proven right in the end.
I accept the fact that it is impossible to get it always right. I accept the fact that many times I am so, so very wrong.
You have to accept the fact that time is running out, Crypto is going up.
Celestia just hit a new all-time low and this is awesome news for me and for you, because, from this bottom low we will grow. You can mark these words... Just watch!
I would like to take just a few seconds of your time to say, thank you. Time is precious, and you took the time to read this long. If you enjoy the content, make sure to follow.
Thanks a lot for your continued support.
There is only one Cryptocurrency market, this is us.
It is you and me, it is all of us. It is not the whales or the exchanges. We are the whales and the exchanges. We are the government, the institutions, the programmers, the designers; the owners, the planners, the coders, the security expert, the writer, the reporter, the auditor; the professor, the mom, the father and the son. You are the market. You are it. You are the whole thing, the whole world.
You might think yourself unimportant as just a tiny ray of light, but there is no life without the sun. You being light, you permeate everything that exist around us. So you are the Cryptocurrency market. You are Bitcoin and you are the altcoins.
Namaste.
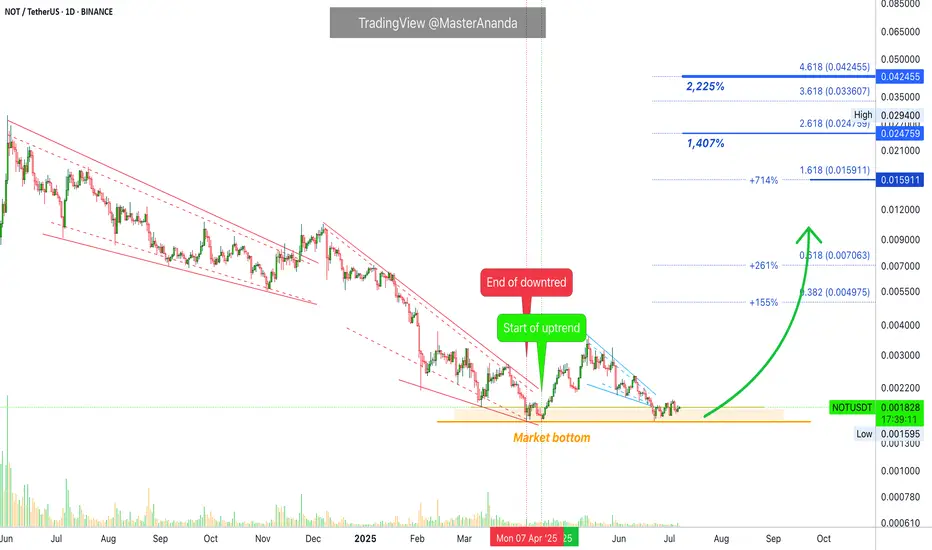
Notcoin: The Market Always Changes Direction, Change of TrendIt is amazing, people tend to give up right before the market is about to change. I am not blaming anybody because I can fully understand. I sold everything November 2022, truly at the market bottom, but life conditions didn't allow for anything else, so I can understand those that are in a similar situation. I can see many people giving up, folding everything, selling, closing, leaving, right at the market bottom; right before the market is about to turn.
It does happen and nothing can be done about it but normally we go through this experience just one, or twice, or thrice but not forever more. Yes, we can give up because things just seen hard or even impossible but everything changes for the better when you least expect it.
When the worst is reaching its end, it gets really bad, pretty bad... In this market, a major crash, a flush and when you think you can't take it anymore it happens that you are witnessing the bottom.
Please, do not give up. If you must, go ahead... Take a break, recharge and come back. if you have the chance to stay around and stick around for a few more months, the market will reward you for your patience and persistence... Nobody said it was going to be easy, but once the positive side materializes it will be worth the hard work.
Anyway... Here we are looking at Notcoin once more. A new all-time high for sure.
I never take into consideration the first candle, the launch date because this date can be incredibly wild. I just don't trust the high and the low. But there is a high 2-June and based on this high I am certain we will get a new all-time high. This is my guess only of course, my opinion but it is based on years of experience.
Without a new all-time high we have 1,400% profits potential from current price. With 5X, you get 7000%. With 8X...
I mean, high risk vs a high potential for reward, that's leveraged trading, but you can always approach this pair spot with minimum risk and still, an amazing potential for huge rewards.
Never give up. Don't give. I don't give up, I can't understand what the word means anyway.
Yes, when it gets really hard... Just right around the corner, the next step, that's when you are closer to success. If you give up today, it means the goal could have been reached the next day. So never give up, you never know when everything will change right when the sun comes up.
We are already here... It is already happening....
You can count with my continued support. Forever and then some more.
Thank you for reading.
Your comment is appreciated.
Let me know what you think.
Namaste.
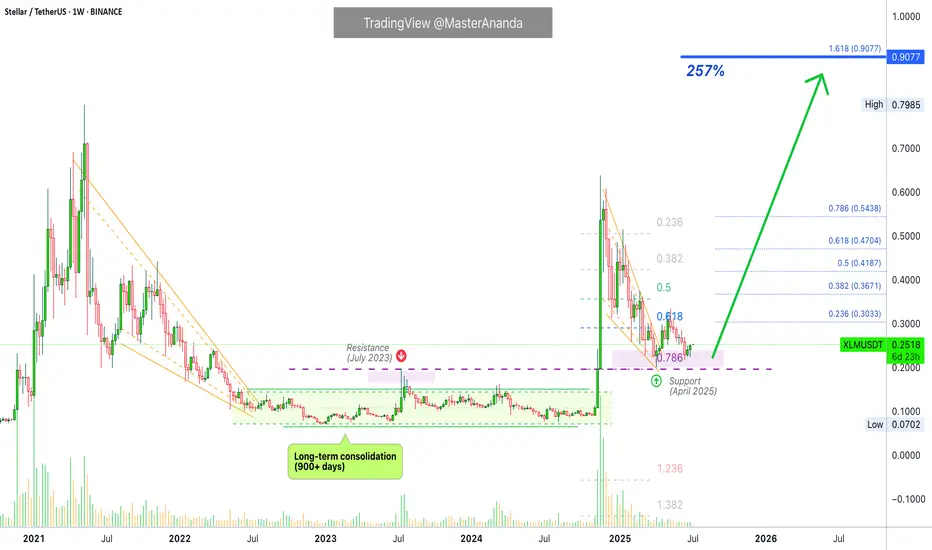
Stellar 2025 Bull Market, ATH Targets, Price Action & MoreA very interesting chart. What is interesting here is how obvious it is that the correction is over. Stellar produced a massive bullish breakout in November 2024, more than 700% growth. After a strong move, there is always a correction. After the correction ends, we get the resumption of the initial move, in this case a bullish wave.
The 0.786 Fib. retracement level worked as support. 7-April. There is an interesting dynamic around this level. Back in July 2023 as XLMUSDT was rising resistance was found around 0.2000. Very close to this level. We then had the late 2024 bullish wave and the correction that ended in early April this year. Support was found exactly at the 0.786 Fib retracement level and this level matches 0.2000. This is the purple line on the chart. Resistance turned support.
After this support zone was hit and confirmed Stellar moved to produce an initial breakout and on the 16-June week, 22-June, we get a higher low. This higher low signals the start of the next bullish wave with a target around 0.9100. This is the next target for the current move but not necessarily where the bull market cycle will end. Can be but not necessarily, the action can move higher.
Growth potential from current price to our target goes to 257%. Coming from the August 2024 low, this same target would give a total of 1,099%. Seeing how strong the first jump was, it is likely that Stellar will go higher in this 2025 bull market.
We have another target between $1.25 and $1.35.
Let's focus on the market and the bigger picture.
Stellar has already proven that it will be a top performer in this cycle. Back in late 2024 XLM outperformed many projects, we can expect the same pattern to repeat in this bullish continuation.
The fact that there are no new lows also signals strength. We saw many pairs hitting new all-time lows in April and June, this is not the case here. And this is also good.
This is a proven project so it is easy to go in big.
Last time the meat of the move unraveled in just two weeks. Something also to keep in mind. Something similar would allow us to profit from the entire XLM wave and then browse the market for new opportunities.
Remember, the market is set to grow for 6 months in the least or it can extend and grow for years. While some pairs go down, others will be going up. When some pairs stop going up, others being down will recover and grow. The market will cycle between this and that, here and there; in the end, everything grows; that's the definition of a bull market. A rising wave lifts all boats.
Notice the long-term consolidation phase, it lasted more than 900 days and then we had a very strong bullish breakout. The longer the consolidation phase, the stronger the move that follows. This is only the beginning, there will be more.
Thank you for reading and for your continued support.
Namaste.
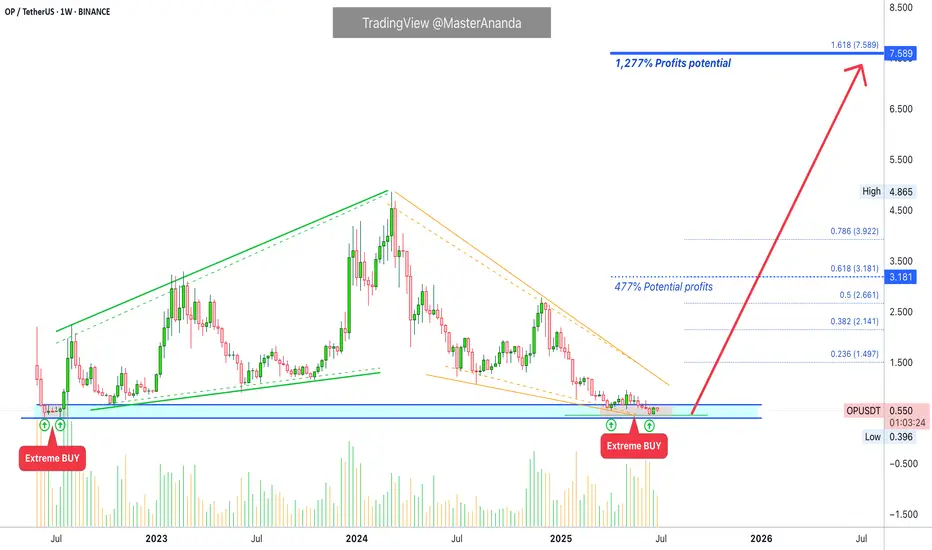
Optimism Extreme BUY: Easy 1277% Profits Potential—Can Go HigherOptimism is now moving within a "extreme BUY" zone. This is a price zone that was active only once between June and July 2022, one month only and then OPUSDT went on a massive rally. Total growth amounting to more than 1,111% from bottom to top.
This zone has been activated again for a little over one month and I believe it won't remain valid much longer. There is room for a new wave of growth but this time much more than 1,111%.
The target shown on the chart is a good one but I believe this trading pair/Cryptocurrency project can go higher when all is said and done.
Technical analysis —Bullish based on price action
On the 16-June week, 22-June specifically, Optimism (OPUSDT) hit its lowest price yet. 0.457. This is just a bit higher compared to the all-time low June 2022 at 0.396. We can easily say the bottom is in as this week the action is back above its 7-April 2025 low.
Higher targets
The next high target sits at $12, giving us a 2,078% potential for profits from current price. 0.551 at the time of writing.
Previous cycle vs current cycle
Optimism's first bullish cycle lasted 630 days. The next cycle, the one that is about to start now, can last an entire year, eight months... We are entering uncharted territory so it is hard to say.
One thing I can say based on TA is that this new wave will be much more steep compared to the last one. The climb will be really fast, it will be hard to adapt.
How to trade to maximize profits
The best way to approach this pair for sure success is by buying when prices are low, now. This would secure a smooth ride and happy profits on the way up.
If you are reading this now, your timing is awesome because we are looking at a bottom catch, this type of opportunity is only seen once every several years. For example, the last time OPUSDT traded this low was in mid-2022, three years ago. Once the bullish wave takes off, there is no going back. Once the bulls are in, low prices will be forever gone.
Thanks a lot for your continued support.
Namaste.
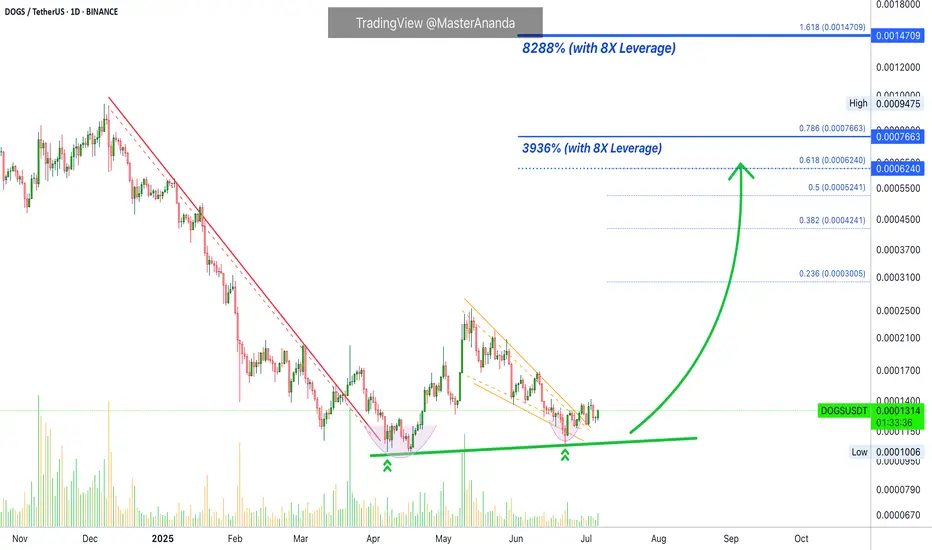
Dogs: Friendly Reminder, Bullish Wave in the Making (5-8X Lev.)We looked at Dogs rencelty, DOGSUSDT, and market conditions continue to improve. The higher low is confirmed and the action is turning bullish now with Bitcoin trading near a new all-time high. This is a friendly reminder.
This is the last chance to join the wave before a major advance. We are about to witness long-term growth and this chart setup can be approached with 5X, relatively low risk and up to 8X which is higher risk but also a higher potential for reward.
Make sure to do your planning as leveraged trading should be approached by experts only, not recommended for beginners.
How to trade
Very easy, buy and hold. Set up your position and then wait patiently. As soon as the trade reaches 200-300% profits, secure it. Once the profits reach 500-800%, you can close your position and go find a new chart setup, or you can continue to hold long-term as your trade is already secured from the first advance.
There are many more ways to approach this and other pairs, this is just one example.
Plan ahead of time. Aim high. Hold strong.
Wishing you great success and huge profits.
Thanks a lot for your continued support.
Namaste.
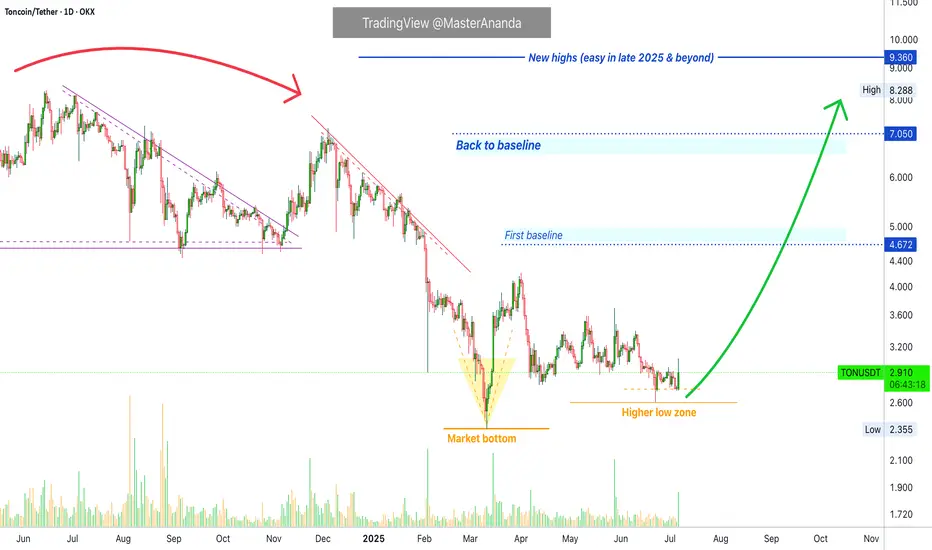
Toncoin Bullish Breakout Confirmed —8X Lev. PossibleLook at the volume today, it is the highest since late May. This high volume coupled with a big bullish candle confirms two things: 1) The higher low is in and 2) the next bullish wave starts now.
There is no other way things can develop. The chart is the market. The chart reveals everything you need to know. Toncoin's chart is revealing buying pressure right now, after a higher low. Now that the higher low is confirmed this means the bullish wave we have been expecting is underway.
This is the last chance. A great opportunity. This chart setup can be approached with leverage, easily with 5X. Can be more just as it can be less. Make sure to plan ahead.
Aim high —A new all-time high
Do not sell after 100% growth, the market will grow much more. Here there is an easy target open with 222%, this level should be achieved mid-term. Long-term, expect maximum growth.
The altcoins market will be growing straight up, month after month after month.
This is just a friendly reminder. Get back in the market.
Buy and hold.
Thanks a lot for your continued support.
Namaste.
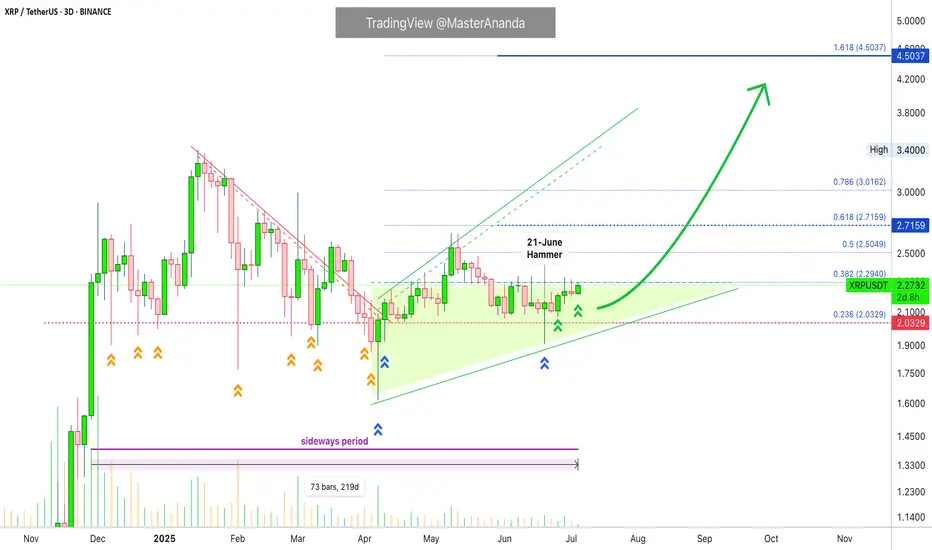
XRP $2 Support Updated, Tested 12 Times & When BullishThere is one number, a price level, that defines XRP's current situation. Either bearish or bullish depends on this number: $2.
As long as XRPUSDT trades above $2, we know the bulls have the upper hand and the bullish bias is confirmed.
If XRPUSDT moves and closes below $2, we know the bulls are losing momentum, the bears are gaining the upper hand and lower prices are possible.
What is the current situation?
XRP continues to trade above $2 and this price continues to be left behind, meaning, the bulls are winning.
Before 7-April, this level was tested over and over, again and again. After 7-April, only two challenges and the last one, 21-June, ended as a perfect bullish hammer. Now the action is moving higher toward resistance, growing not lower. $2 has been confirmed as support.
Now that support has been confirmed, we can expect additional growth. It can take some time, maybe a few days but the bulls are in control.
It can take some time, not that long, the market has been sideways for more than 7 months. This is a long-time and no more is needed. The consolidation period just reached its end.
The final low happened late last month, Crypto is set to grow; XRP will be doing great in a matter of days. Closer than anything you can think or expect, next week can be boom, sellers are exhausted. People are back to work.
Thank you for reading.
We are about to experience a growth explosion.
Namaste.
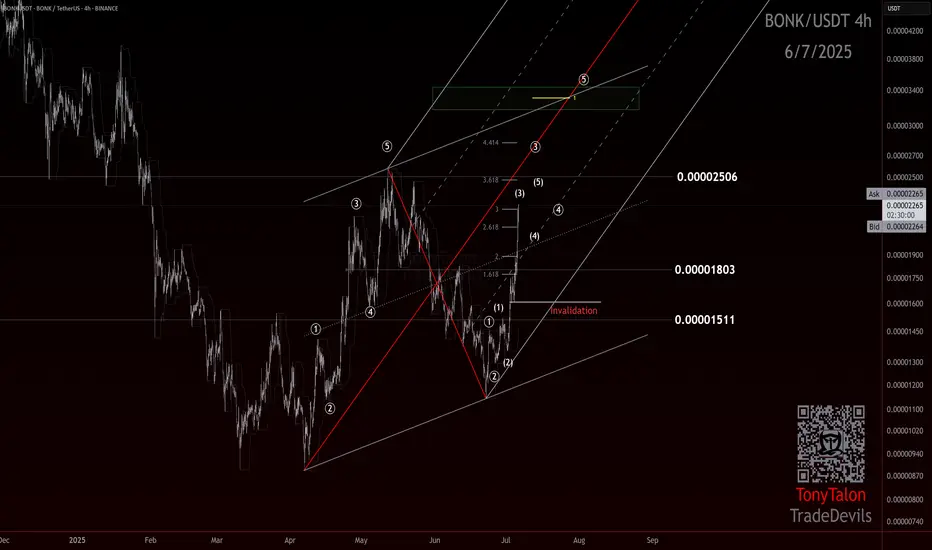
From BONK to Boom: Is This a Full Impulse?If you find this information inspiring/helpful, please consider a boost and follow! Any questions or comments, please leave a comment!
BONK: Watching the Impulse Unfold
Looks like BONK may have bottomed at 887, where it kicked off what appears to be an impulsive move up.
The retrace that followed was suspicious—plenty of ways to count it depending on your lens—but price action eventually started hinting at a 12-12 or zigzag-style crossroad. That indecision resolved quickly once BONK cleared 1511, shifting the structure firmly back into bullish territory.
Now trading around 2242, the behavior is aligning with what you'd expect from a wave 3: strong momentum, vertical lift, and minimal resistance. It’s moving like a third wave should.
That said, there’s some heavy resistance sitting overhead at 2506, and it could stall or even reject price short-term. If it does, the next thing I’ll be watching is how price reacts—specifically looking for a clean wave 4 pullback and a final push into wave 5.
If we see that 4–5 structure play out at multiple degrees, it would go a long way toward confirming this whole move as a completed impulse off the low.
For now, this one stays on watch for the next setup.
Trade Safe!
Trade Clarity!