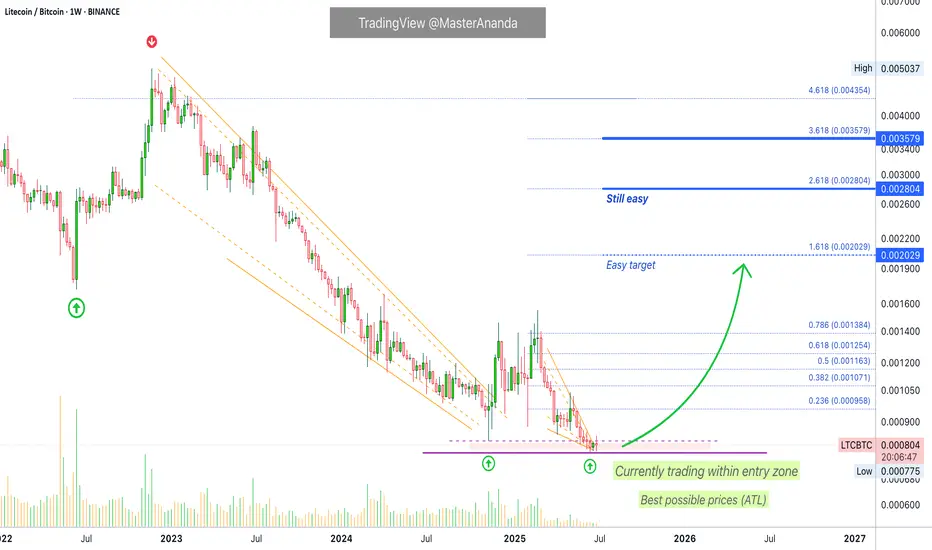
Litecoin vs Bitcoin —The Institutional Wave? Consider the ETFsStarting November 2022 LTCBTC (Litecoin vs Bitcoin) went on a major downtrend, until November 2024. After November 2024 this downtrend is no more.
There was a bounce late last year and this event changed the chart. The latest low last month, June 2025, ended up as a technical double-bottom. Less than 5% below the November 2024 low and this low happened after 217 days. This means that in seven months sellers became exhausted and they couldn't produce a new major low. This reveals that the bearish trend is over. Once the downtrend ends, we get a change of trend, a change of trend implies an uptrend, an uptrend implies long-term growth. We are looking at a long-term bottom and... From the bottom we grow.
This is not an opportunity that presents itself often. The BTC trading pairs are hard to trade. These are for experts only. A new opportunity is developing that can lead to exponential growth. It is amazing how this section of the market works. LTCBTC will grow as Bitcoin and the rest of the market grows. This tends to produce a multiplier effect that is hard to explain. You will understand when you see it in action.
LTCBTC is hitting bottom. The bottom is already established, several weeks old. The candles low is flat, we can expect massive growth; excitement and institutional adoption on Litecoin thanks to the ETFs, it will be the first time this pair grows in years and the type of chart it will produce it is hard to tell.
We are entering uncharted territory. The bullish phase can be mild just as it can be ultra-strong. There is no limit to the upside. It can grow for years or for 4 to 8 months. Both scenarios look good.
The best part is to catch the bottom; an early wave. Prices are low now, easy to buy and hold. Focus on the long-term.
Litecoin has good potential for this incoming 2025 bull market.
Thank you for reading.
Namaste.
Altcoins
Cosmos (ATOM) $70 New All-Time High, Market Dynamics & MoreCurrent price for ATOMUSDT matches the low from September 2020. The same range was also active in July of the same year and between December 2019 and February 2020.
From a low point in March 2020 Cosmos (ATOMUSDT) grew 4,122% to peak in September 2021. Giving us a 560 days long bull market.
The double-top in January 2022 extended the bull market to a total of 679 days. Those that didn't sell in September 2021, after a correction, had an additional month to sell at the highest possible.
Back in those days we had a rising bottom after the all-time low. This time around we have a stable (flat) bottom.
The lowest price for Cosmos happened March 2025. A one year long bull market would give us a top around March 2026. If we get 560 days like last time this would give us a top around September 2026. Compare this to September 2021, same month. Things will be pretty interesting that's for sure.
We cannot generalize anymore and each pair/project needs to be considered individually.
For example, Ethereum hit bottom June 2022, here Cosmos hit bottom March 2025, huge difference. Many projects bottomed also mid-2022 but others bottomed around August 2023, others August 2024 and many others just recently, 7-April 2025 and some even last month.
We are entering uncharted territory.
The big projects and the ones with ETFs will have their own charts. Corrections will be minimal and we cannot expect the same highly volatile and crazy dynamics as when Crypto was underground, it is public now and it has all the attention in the world. The altcoins can't crash down too strong when everybody is waiting to buy when prices go low.
The flat bottom in 2024-2025 for Cosmos can tell of two things: 1) There is the possibility of one final flush, lasting only a few hours or days and this would mark the start of the next bullish phase. Or, 2) the next cycle can start uneventfully. Normally there is always a strong shakeout before the change in trend.
A pair can grow for years, as some projects are already doing based on higher lows while others can be doing things differently.
I am just trying to get the point across that each project needs to be considered individually, this is very important for the future because everything is changing now but the effect will be felt only after many months. Even the bear market will spread out; not like before. The bull market is very likely to be extended because the projects move in groups and since the market is so big now it will take time for each group to jump.
Start late, ends late.
This chart allows for a new all-time high. $70 is the standard projection and I should say also the minimum. But this one is tricky because of the chart structure. It can also end with no new all-time high so all will depend on the demand. How strong is the project, the team behind it, how active are the participants, etc.
There will be enough capital for everything to shine but only those with a plan and the right tools will attract our attention. It is a huge game, competition is very strong. Those that neglect their projects are likely to stay behind. Those that are active with a positive mindset and plan, should come to the front.
You know how it is... Regardless of any individual project, Crypto is going up.
Namaste.

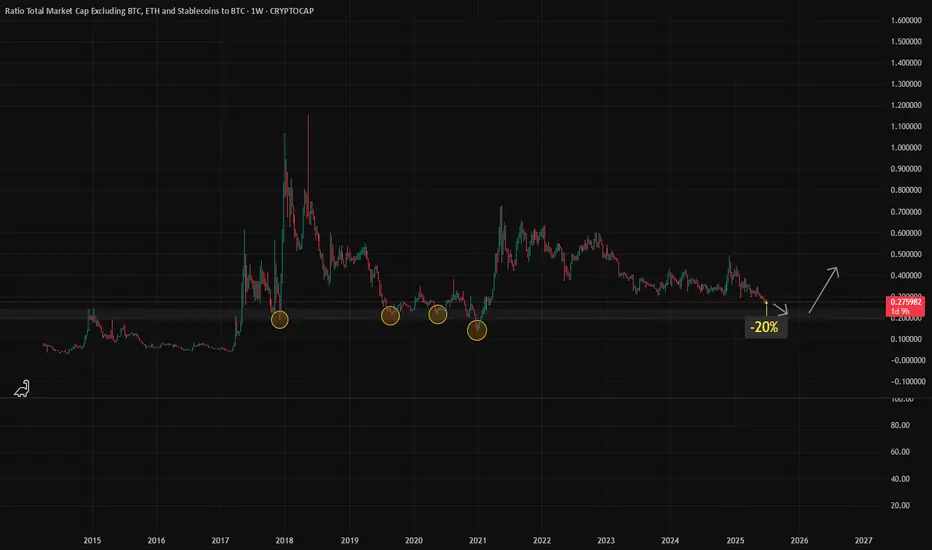
Altcoins Near Key Support, Possible -20% Drop before reversal ?Sharing my analysis on the altcoin market cap (excluding BTC, ETH, and stablecoins) compared to BTC over the past 10 years
I have marked important zones (yellow circles) where altcoins have historically bounced after strong corrections.
Current Outlook:
- I expect a possible -20% more downside, bringing it near 0.22, which aligns with a key historical support zone.
- This level has acted as a strong base multiple times, in 2018, 2020 and 2021
What I’m Watching:
- If price reaches that zone and holds, it could signal the start of the next altseason.
- Past patterns show similar moves before big reversals.
- However confirmation through volume and market sentiment is important before making any move
Final Note:
Not financial advice, just sharing what I see on the chart. If the ratio hits 0.22 and shows strength, it could be a key level to watch. Thanks
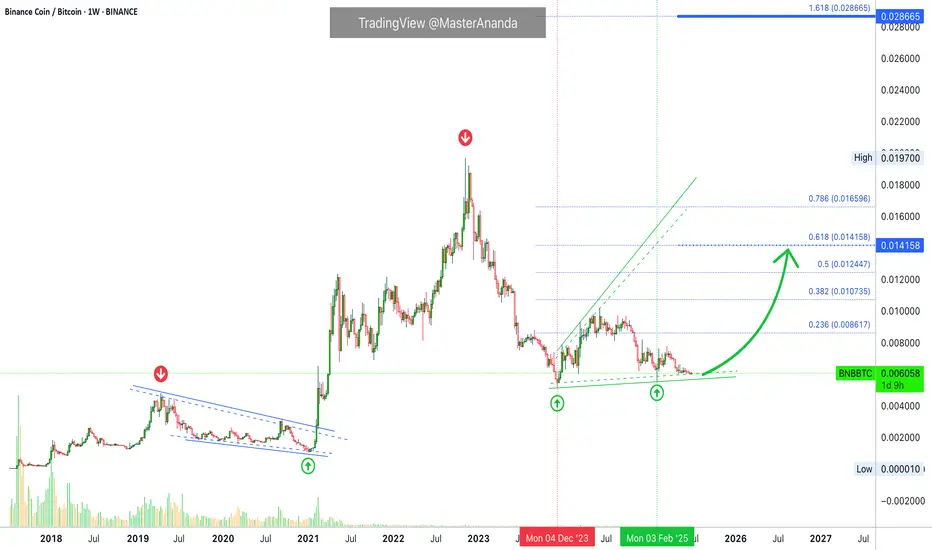
BNBBTC (Binance Coin vs Bitcoin) New All-Time High & 2026 BullI've been looking at Binance Coin vs Bitcoin and this chart has some pretty interesting dynamics, quite unique I should say. This can be a great opportunity for what is about to happen.
In the last bull market BNBBTC produced massive growth, the most interesting part is the fact that it continued to grow even during the bear market. Not that it lacked during the bull market and then grew during the bear market, but it grew strongly in early 2021 and continued to grow through 2022 while everything was going down. BNBBTC peaked only in November 2022 when Bitcoin hit bottom.
If we get some similar dynamics in this cycle, we can imagine BNBBTC starting to grow now, together with the rest of the market. When the bull market ends, all-time high, Bitcoin is going to 1M+ etc., then BNBBTC continues growing as the bear market unravels. This is because people tend to use BNB to store value and also because trading, market activity and engagement shoots up after the bullish cycle is over. Everybody, their mothers and cousins become professional traders and gamble everything away. This process can take an entire year... When all the money that was earned through the bull market is lost, then we get the bear market bottom and the cycle repeats.
At this point many people will be selling and giving up, but that would only be the start. November 2022 vs November 2026. Ok... That is too far away, let's focus on this present day.
Binance Coin vs Bitcoin, BNBBTC, produced a major low December 2023 and a higher low February 2025. December 2023 marked the end of the bear market for this pair. February 2025 confirms the bearish wave is over; the downtrend is no more.
We have a transition period, consolidation for more than a year. From the bottom we grow.
I am expecting a new all-time high on this pair and this is an easy guess. The only danger Binance was facing came from the previous administration, before Trump. Now that the Cryptocurrency hating crowd is gone, we can aim to the top and beyond. There is no limit to how far up anything Crypto can go. Truly... This is only the start...
It is still early
Notice how some pairs are really high and very advanced on their bullish cycle. Notice how other pairs are still trading at bottom prices. Pairs like this one can be approached easily, with low risk with 5X focused on the long-term. Very low risk with a high potential for reward... Never chase a rising wave. It is better to look for one that is yet to start.
Imagine if you were surfing. Would you be able to join a wave that is already pretty advanced? It can end your life. But if you glide patiently on your board looking around to catch a newly developing wave... It would be an awesome ride and your enjoyment is secure, guaranteed and safe. Catch the early wave.
There are endless opportunities in this market.
Your continued support is appreciated.
Crypto is the future of finance.
Crypto is the evolution of the Internet.
.....
Oh and by the way, the same dynamic I mentioned here between 2021 and 2022, also happened in 2018-2019. This means that there is high probability that BNBBTC will continue growing beyond the 2025 bull market. It is likely to grow during the bear market as well.
There are always several pairs that are used as a hedge. Finding those ahead of time can make a huge difference on how strong your portfolio remains during the bear market. I will be recommending selling though but not 100%. We will be selling around 60-70% and the rest we keep invested regardless of what happens. We are Crypto, we love Crypto and we support he market.
Namaste.
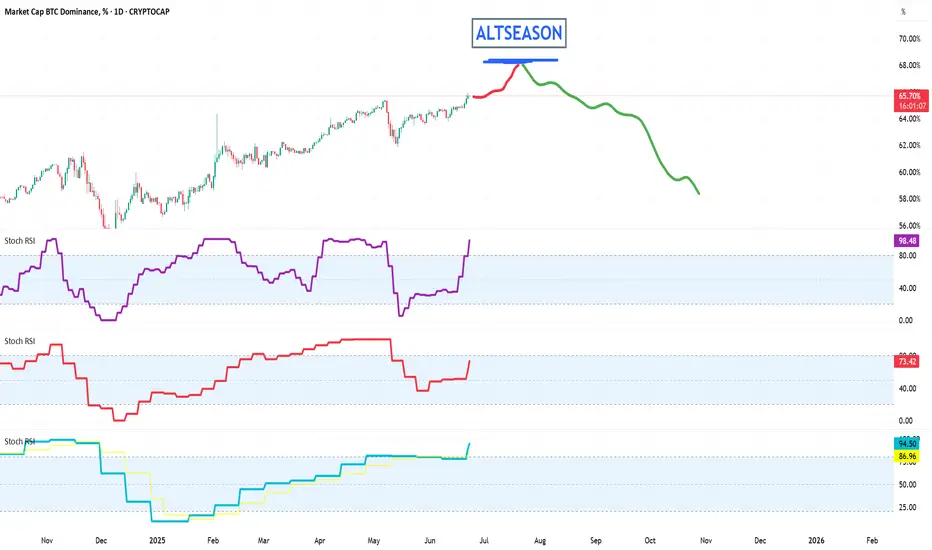
Bitcoin Dominance Nearing a Top — Altseason Incoming in JULYBitcoin Dominance (BTC.D) is approaching overbought levels on several key oscillators across multiple timeframes. While the 1-Week chart still shows momentum that could push BTC.D slightly higher over the next few weeks, the indicators are signaling an upcoming shift.
📅 Timing the Rotation:
We're eyeing mid to late July as the likely window for a rotation into altcoins. This would mark the beginning of a potential mini altseason, where top-performing altcoins could outpace Bitcoin for a limited but lucrative period.
💼 Strategy Insight:
This could present a strong opportunity to trim or exit older alt positions from earlier in 2024—especially if they rally hard during this period of temporary dominance weakness.
🔍 Watch the oscillators and volume trends closely. The BTC.D reversal could be subtle at first but may lead to outsized moves in select alts.
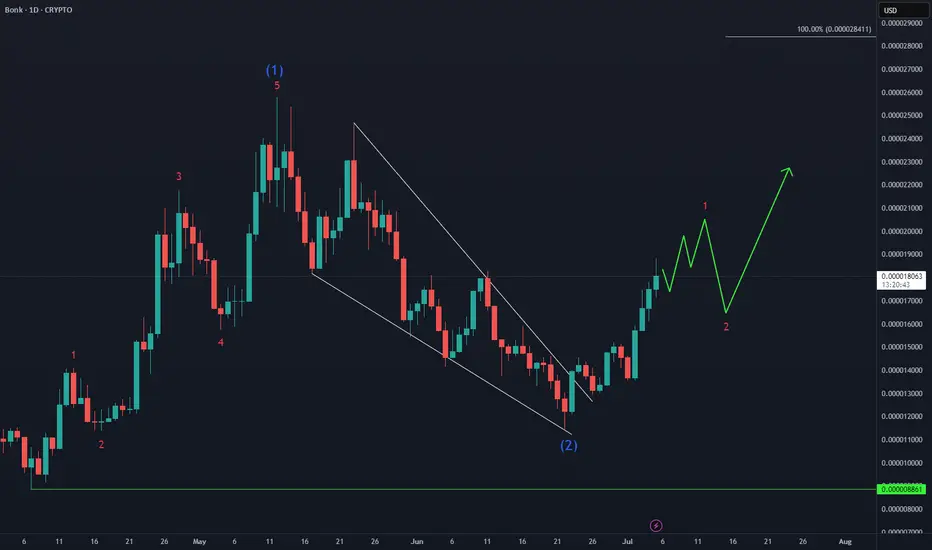
BONK Bullish Reversal in PlayAfter a clean 5-wave advance from the April low, CRYPTO:BONKUSD corrected 55%, then carved out a higher low last month. Now it’s eyeing a breakout above the May peak as the next leg higher begins.
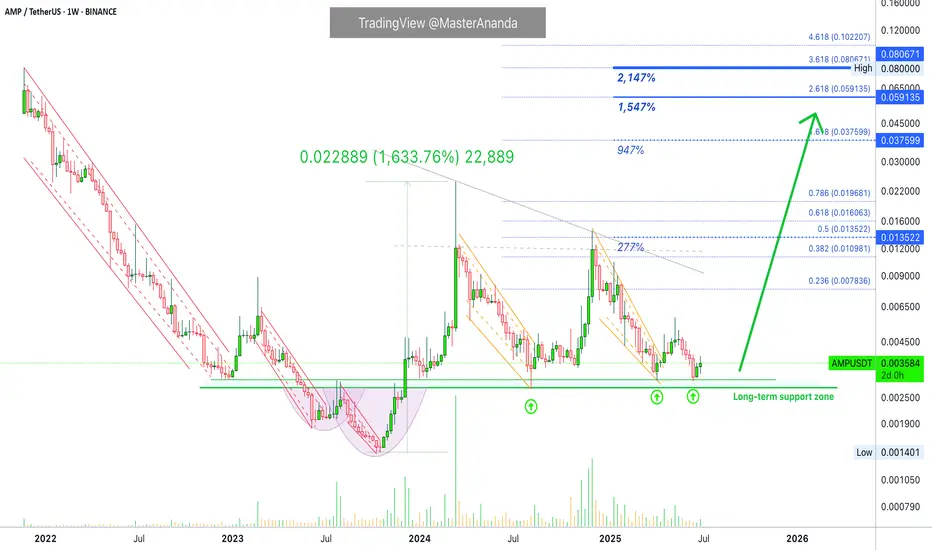
AMP Grew 1,634% in 2023; What About 2025? Follow My ReasoningBetween October 2023 and March 2024 AMPUSDT grew 1,634%. So you could say this move—the one that I am mapping—the next move, is a continuation of the previous cycle, right? Wrong.
It is not necessary. The long correction and consolidation period with a flat base nullifies the previous cycle. We are back to square one. We are at the baseline level. Anything that happens now can be considered new.
Instead of a continuation of a previous period, a new phase/cycle can develop. So growth potential is not limited to past actions or happenings, everything is possible based on current market conditions which are great and getting better with each passing day. Ok? I think we can agree so let's continue.
The last strong bullish wave gave us a taste of what is possible. It showed us that 17X is possible even when the market is in a transition period, the recovery year I dubbed it. That is, 2023. And it was the recovery year because the market recovered from its 2022 bear market bottom.
2025 bull market targets
My aim would be the one around 1,547%. I show higher targets because it can go higher. I show lower targets because different people approach the market in different ways. If you want to aim for the maximum and aim high, you have the high targets. Those that want to get paid short-term also have some targets on the chart. But I am always somewhere in-between the high and the low.
I normally like 1.618 and 2.618. It all depends on which peak I use to plot the Fibonacci extension tool. If we are looking at projections based on the last wave, then the 1.618 is pretty standard and easy to hit, so we can aim even higher.
If we are looking at the last bull market, then going beyond 1.618 might be too optimistic.
I keep saying that it can go higher but truly, it is always the same. The biggest difference is due to inflammation, everything grows in a controlled way because it is not a crazy market, it is very well organized, everything is calculated so that the market can continue to grow and evolve long-term.
There is something for the serious, for the slow, for the fast, for the greedy, for the humble, for the grateful, for the ungrateful, for the egoist and for the spiritualist. There is a little bit of everything for everybody. That's Cryptocurrency for you. It is censorship proof.
They continue to attack us, to censor us and to block us on all fronts, but they have not found a way to block our Bitcoins... Uhhh. It is working just as intended. Peer to peer electronic cash, no middleman, no intermediary. The future of finance. Money for the age of the Internet.
Thanks a lot for your support.
Namaste.
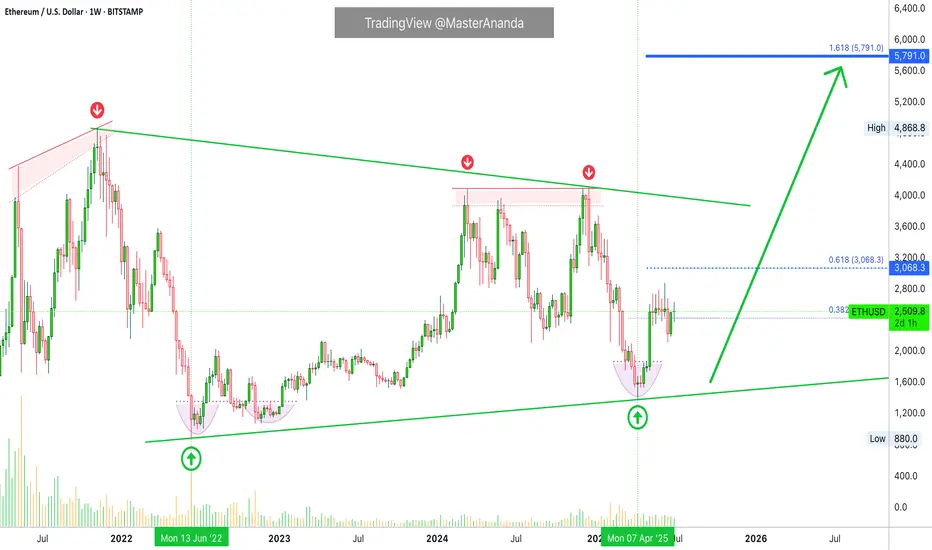
Ethereum $5,791 followed by $8,500 Late 2025Ethereum is due a major, major bullish wave. No new highs since March 2024. Double-top December 2024.
The bear market ended June 2022. April 2025 marks a long-term higher low.
So the peak remains flat, March 2024 vs December 2024. While the bottom is rising, June 2022 vs April 2025.
You could say the top is a lower high of course, November 2021 vs 2024. This is also valid. Even with a lower high top a bullish wave is due leading to a minimum of around $3,800 or $4,000; back to baseline.
Now, if we really want to talk about minimum because we really don't care about worst case scenario, the fundamentals are improving and everything is getting better, consider $5,791. This would be the minimum. With the Ethereum ETFs and the 2025 bull market, we then open up $8,500 and so on. Growth potential is unlimited and we will have to use our imagination. These numbers are good though and definitely a strong level where action will happen. You will see some resistance, some something going on when Ethereum reaches these numbers.
Ethereum is due a major, major bullish wave. It is not a question of "if," it is a question of "when." When will it happen? "If it happens?" No! When, will it happen?
It will happen in 2025. You can be certain about it... Just watch!
....
Ethereum (ETHUSDT) has been consolidating two months above support. Support being $2,425. One week it broke below this level just to recover the next week. More than 8 weeks sideways wicking lower and higher.
The 7-April low, candle and rounded bottom, as well as long-term higher low makes this date a clear bottom. From the bottom we grow. Once the bottom is hit, the trend changes. The trend has been bearish since March 2024. A long time in Crypto term. We are in the bull market year, 2025. What is not happening now, is what will happen next.
The market was bearish for a long time and that's ok. The good news are the waves within cycles... We just came out of a strong correction; we have a small recovery and consolidation. The initial breakout is being consolidated before additional growth.
Lots of thinking, lots of reasoning, lots of studying... Everything you need to know is already present on the chart. Ethereum will grow. Mark by words. It is already happening.
Thank you for reading.
Namaste.
Bitcoin Recovers Above 105,000, Extremely Bullish +AltcoinsBitcoin produced only two days red, a bear-trap, and is now trading daily back above $107,000, an extremely bullish development.
Good morning my fellow Cryptocurrency trader, I hope you are having wonderful day.
The altcoins market bull market is confirmed and what Bitcoin is currently doing gives further strength to the bullish case and bias. It will be only a matter of days before the entire altcoins market turns strongly bullish with major momentum.
The range is still valid though, $100,000 - $110,000. But this time around the upper-boundary is likely to break and the last ATH tested, a new all-time high is even possible and also highly probable which is what will propelled the altcoins to hit multi-year highs and some even new all-time highs. Many pairs will move ahead.
With each passing day, the Cryptocurrency market will continue to heat up. We can expect growth long-term.
The 2025 bullish cycle started with the 7-April market low. The start of the third wave started 22-June and should go for 2-3 months. Then we will have a correction, the fourth wave followed by one final jump, the fifth wave.
We can expect growth now and all through late 2025. The entire period will be bullish. Only when the marketwide correction comes there will be a pause but many pairs will grow even at this point.
Choose wisely. Low risk vs high potential for reward.
Aim high. Focus on the long-term.
Thanks a lot for your continued support.
Namaste.

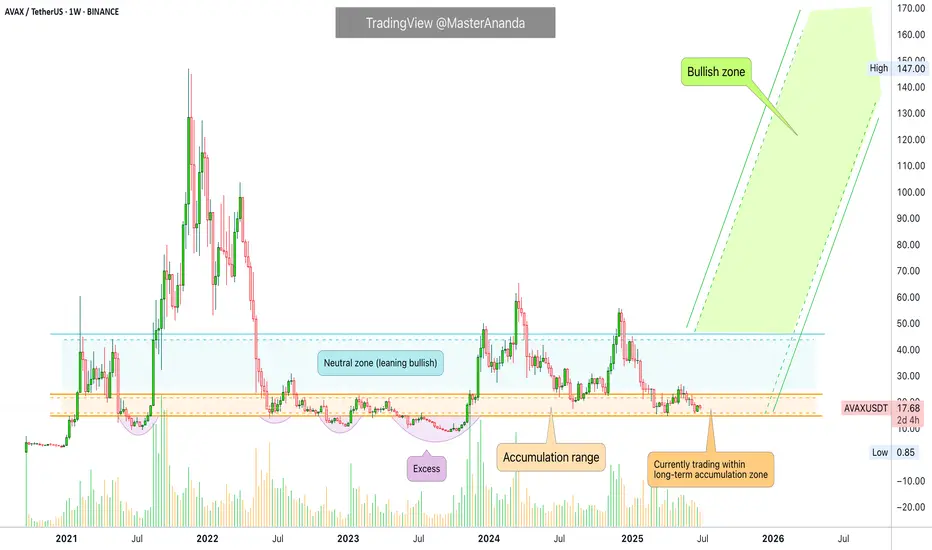
Avalanche 2025 All-Time High, Accumulation & Bullish ZonesI am using $495 as the next bullish cycle top. The 2025/26 bull market all-time high. It can be more but it can also be less. We can only guess at this point because the Cryptocurrency market is just so young that everything becomes possible. We err by being conservative.
Avalanche is trading within a long-term accumulation zone. The best possible prices, literally.
The purple-rounded bottoms on the chart denotes an excess.
This year, 2025, the accumulation zone was activated in February. The action then moved within this orange-zone in March and this is where everything is happening now.
If you wanted to put tens of millions of dollars into this project at the best possible prices pre-2025 bull market wave, then you would need to do it based on the long-term. Back in July-August-November 2024 and February, March, April, June and so on 2025.
If you were to buy too big too fast it would push prices up. So whales wait months in order to accumulate. After years of accumulation at low prices, they send the signal and the market can move. Once the market starts moving, the consolidation/accumulation period is over, there is no going back.
The "neutral zone" here is light blue. This is already bullish but not ultra-bullish because there is no continuation inside this zone. Only when Avalanche (AVAX) moves and stays above it we can get a new bull market cycle. Since it only happens every four years, like clockwork, there is no need to guess.
Pre-2021 we buy as much as we can and sell when prices are high up. Post 2021 bearish, SHORT, SHORT, SHORT. After 2022 comes the transition period, the long-term accumulation and consolidation phase. In 2025 is the next bull market, this is where we are at now.
So now we can buy as much as we can but only with the intention to sell when prices are up.
An investor does not sell, only buys forever more. But still, if you are an investor, you shouldn't buy when prices are high. The time is now to accumulate on everything.
A trader sells every few weeks, every few months. Each wave. Buy support (low) and sell resistance (high). Buy low (red) and sell high (green).
You need to know clearly if you are trading or investing. Getting things confused can result in loses. Getting this topic confused simply means lack of planning.
We are entering a major bullish cycle and wave. This is not the time to be a trader if you've never traded before. This is the time to invest, accumulate; buy and hold. Sell only when prices are astronomically high.
When the bullish cycle is over and if you find a pair trading at support, you can buy to sell again within weeks or months. But not now. Now, after you buy, you hold. Makes sense?
We are in this together.
I love you!
Your continued support is appreciated, truly.
Namaste.
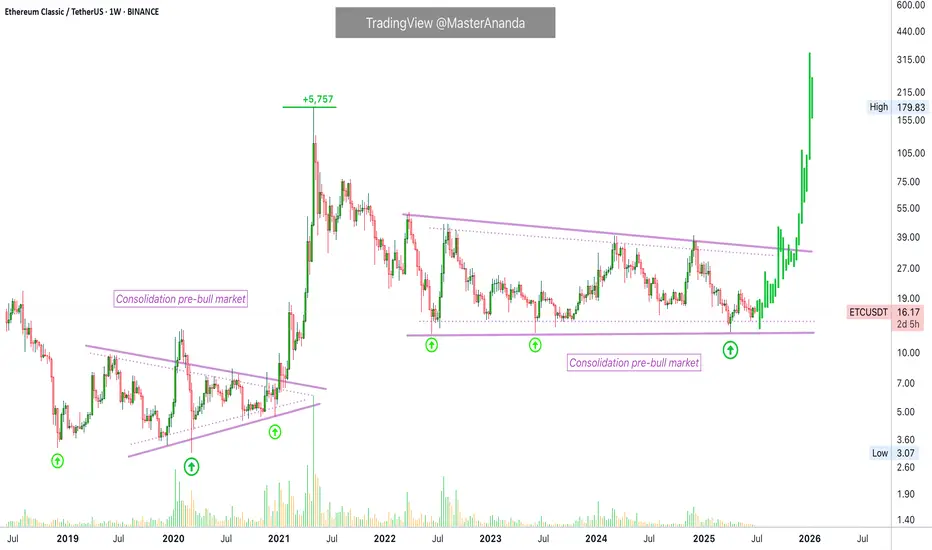
Ethereum Classic Long-Term Consolidation & The 2025 Bull MarketIt feels like we've been looking at the same chart for three years. Remember June 2022? A "small" 260% price bounce and we all did pretty good. Market conditions have not changed.
It's been three years and three years Ethereum Classic (ETC) continues to move, trade, sideways. A long-term consolidation phase.
The 2021 bull market was also preceded by a consolidation phase. This is marked on the chart.
The 2025 bull market is getting ready, we are still loading and I call for your patience once more but, you can know for certain that Cryptocurrency—the altcoins market—will meet all of your expectations and beyond.
The consolidation pattern has three major lows. June 2022, June 2023 and April 2025.
The last bull market produced total growth of 5,757% from bottom to top.
The current consolidation pattern has a technical triple-bottom. Higher lows each time but only by a few cents. We are only missing the bull market wave and bull run phase.
Think of something similar to what we saw between December 2020 and May 2021. Or, instead of a 6 months long bullish wave, we can get a 12-18 months long bullish cycle. Slow and steady growth.
It is likely to go fast because the consolidation phase has been so long. There is no need for long drawn-out bullish cycle, the market had plenty of time to test everyones patience and reset.
You know how Crypto goes, once it starts moving there is no going back. Nothing slow, fast and strong. That's my guess of course but I am open to seeing anything develop and I will update, adapt and change if something different happens.
One thing is certain, Ethereum Classic will grow.
We are getting closer with each passing day. The best is yet to come.
Namaste.
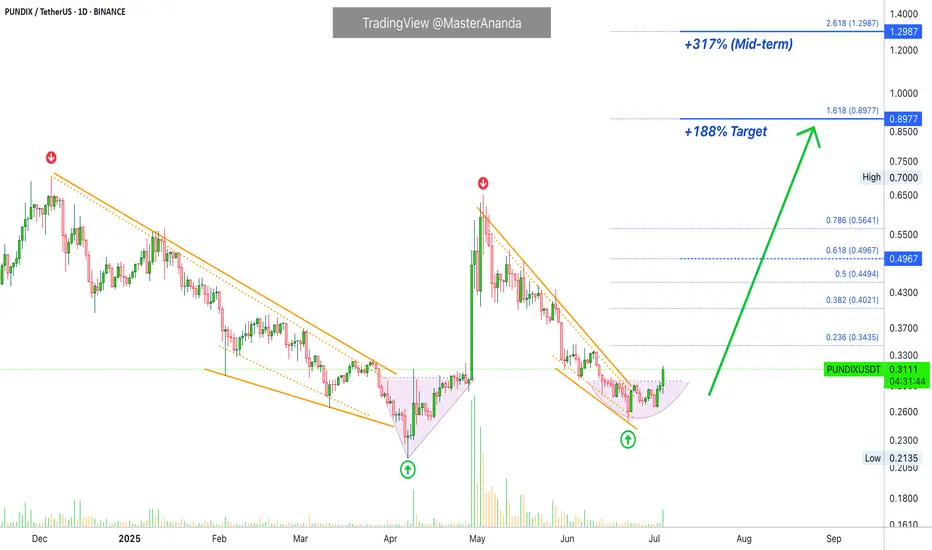
PundiX: Focus on the WinIf you had to choose between a pair that is dropping or set to drop vs one that is rising or set to rise, which one would you choose?
Looking at the chart, the red arrow shows a peak and subsequent drop; the green arrow shows a bottom. The bottom is followed by a rise.
PUNDIXUSDT is now trading within a higher low and producing a bullish breakout supported by rising volume. Trading volume today is many times the daily average in the past month.
These are simple signals; bullish confirmed, a new bullish wave with a nice 188% target short-term and beyond.
Happy 4th of July USA.
Thanks a lot for your continued support.
Namaste.
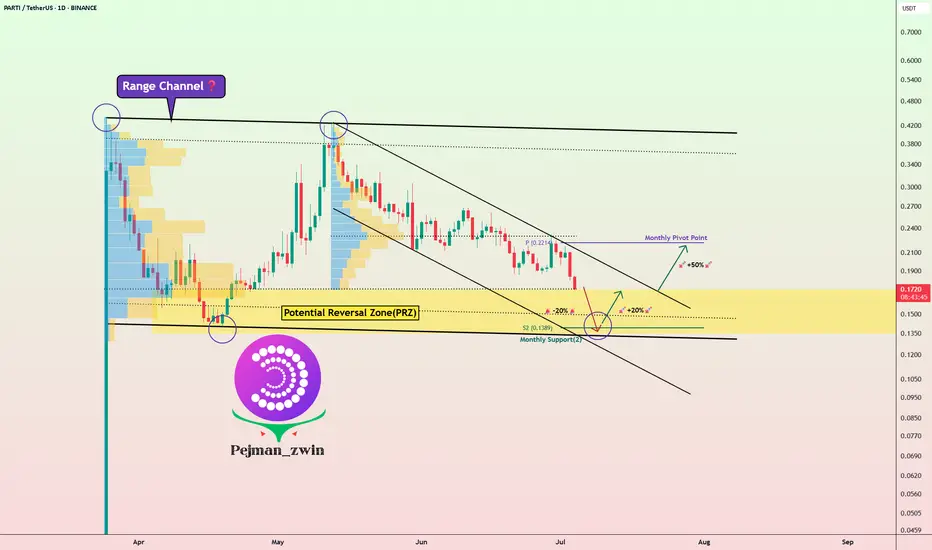
PARTI Setup: Key Reversal Zone Could Spark +50% RallyToday, I want to analyze the Particle Network ( BINANCE:PARTIUSDT ) project for you, which has a chance of increasing by +20% to +50% in the short term .
Let's first take a look at the fundamental state of the Particle Network (PARTI) project .
Particle Network is building a modular Layer-1 blockchain with a focus on Chain Abstraction, aiming to unify user experiences across multiple chains through:
Universal Accounts – Single account across all chains
Universal Liquidity – Access liquidity without bridging
Universal Gas – Seamless cross-chain transactions without gas token concerns
The project has:
Raised $25M+ funding from top-tier investors (Binance Labs, Animoca Brands, Spartan Group)
Integrated with 60+ blockchains and 900+ dApps
Reached over 1.3M testnet accounts and 27,100 daily transactions (Messari Q1 2025 report)
Recently launched UniversalX (a cross-chain DEX) as its flagship dApp
Summary:
Particle Network shows strong fundamentals with innovative tech, a growing ecosystem, and backing from major players in crypto. Long-term success will depend on user adoption of Universal Accounts and dApps like UniversalX.
------------------------------------------------------
Now let's take a look at the PARTI token chart on the daily time frame .
PARTI token is currently trading near Potential Reversal Zone(PRZ) , Monthly Support(2) . There is also a possibility of a Range channel forming, we should wait for the confirmation of the second bottom .
I expect the PARTI token to start rising again from the Potential Reversal Zone(PRZ) and near $0.14 .
Note: Stop Loss(SL)= $0.1177
Please respect each other's ideas and express them politely if you agree or disagree.
Particle Network Analyze (PARTIUSDT), Daily time frame.
Be sure to follow the updated ideas.
Do not forget to put a Stop loss for your positions (For every position you want to open).
Please follow your strategy and updates; this is just my Idea, and I will gladly see your ideas in this post.
Please do not forget the ✅' like '✅ button 🙏😊 & Share it with your friends; thanks, and Trade safe.
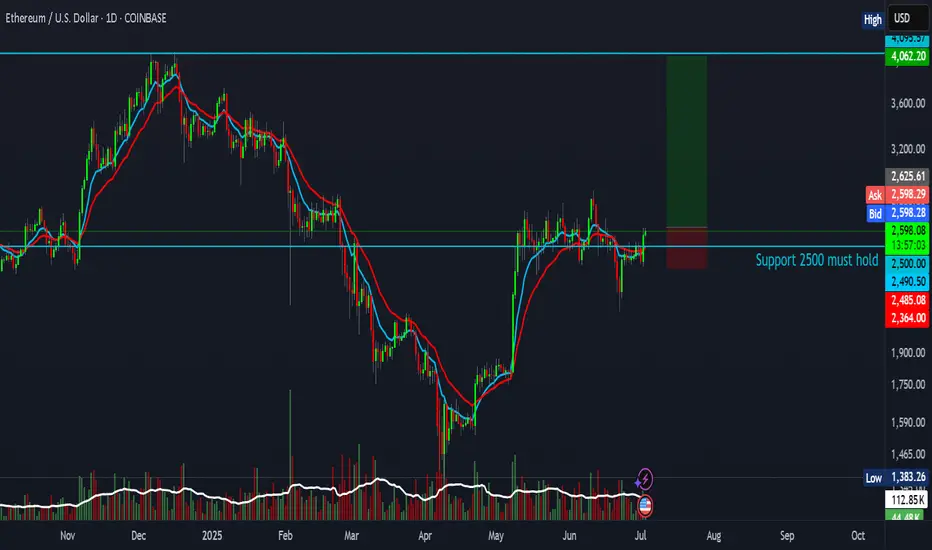
Ethereum Trading Strategy: 5:1 Risk-to-Reward Ratio"Ethereum Showing Strength on the 4-Hour Chart — A New Bullish Trend Emerging?"
The 4-hour timeframe is starting to show strong bullish momentum. Could this be the beginning of a new uptrend?
A potential 5:1 risk-to-reward setup is forming:
Entry: 2,620
Stop Loss: 2,364
Target: 4,062
Support 2500 must hold!!!
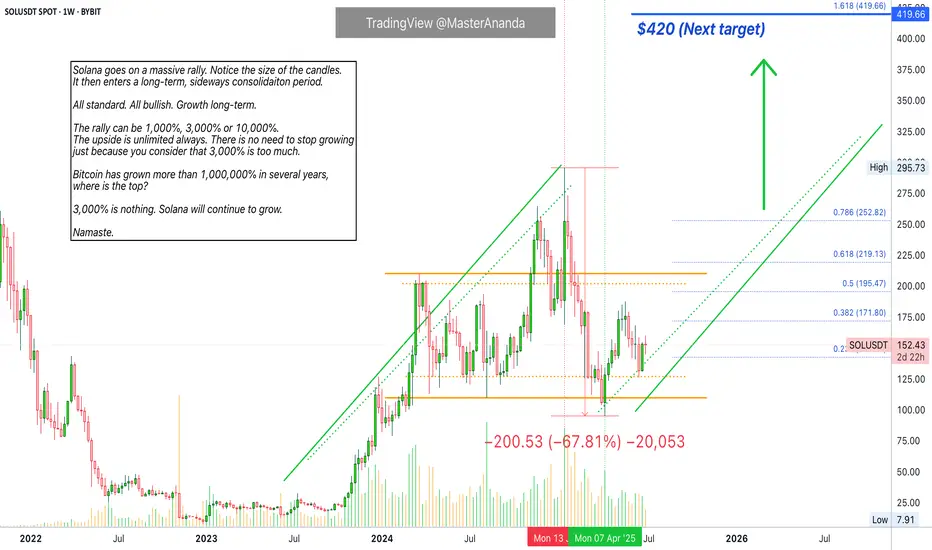
Solana Will Grow Despite "3,200% Rally"Oh my god! Folks, this friend of ours is saying Solana is going down because of a "3,200% rally." Crazy stuff. Can it continue growing after a 3,200% rally? But he is ignoring a massive correction between January and April. How big is the correction you ask? 67%. Meaning, there is no need to mention the previous rally because it has been corrected already.
Ok, hold on... Let's breatheeeeee deeply first.
Solana ETFs. Growing Cryptocurrency market. Global adoption. Old finance finally waking up to the new financial system. Even banks are starting to buy Crypto and opening up a ramp for their customers to buy Crypto, Solana, using their savings and other funds. This is why it will grow.
Think of this. Think of Apple, Inc. when it was young. Think of Tesla and Google and Microsoft. Would you quit after a 3,000% rally? Well, these companies are still growing today. Crypto is no different, it will grow for decades to come. Solana is going up. 100% certainty, you can see it on the chart; the fundamentals as well.
Get on board the bullish train, it is not too late.
Everything money goes into Crypto. You will be happy with the results.
If you stay out, your loss.
Namaste.
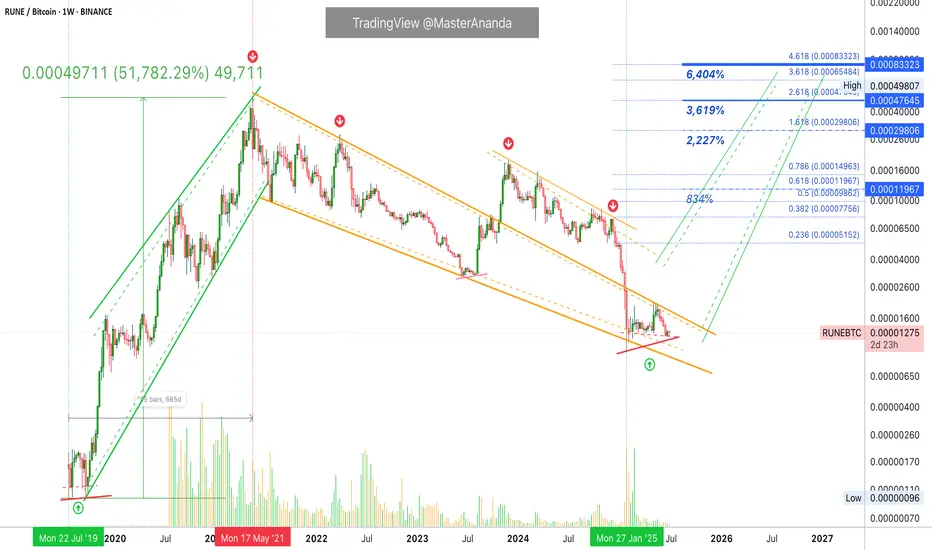
RUNEBTC Grew 51,782% in 2021 — Is 6,000% Possible in 2025?Would you like to know something crazy? Just say yes....
THORChain grew 51,782% vs Bitcoin in 665 days. RUNEBTC. Between July 2019 and May 2021.
Now, let me ask you another question. Do you still think that 1,000%, 2,000%, 3,000% is something crazy or out of this world? Looking at how Crypto behaved in the past, we know this is not only possible no, such numbers are not even normal, they might be too low. We might be underestimating the market when we saw 834% potential for growth for example.
Of course it will be go higher... All the top project are getting their own ETFs. The world is evolving towards Crypto.
Listen to me, pay attention. It is not that people are buying Crypto and will trade Crypto to make some money, etc. It is the entire financial system that is called 'Cryptocurrencies'. It is the end of the world basically. It is a new technology.
Just as WiFi took over landline and all that stuff;
Just as email took over mail;
Just as the Internet took over... Telepathy? I don't know.
What I am trying to say is that whatever system we had in the past, everything continues to evolve. It is not something incredible or extraordinary, we were due a monetary upgrade. It is here now. We are all Crypto because we know that paper money is just too old.
Let them close all of my bank accounts... Go ahead!
We have Cryptocurrency now. You can't block us anymore.
Money is free now. Money is freedom.
THORChain has huge potential for growth.
Thanks a lot for your support.
Namaste.
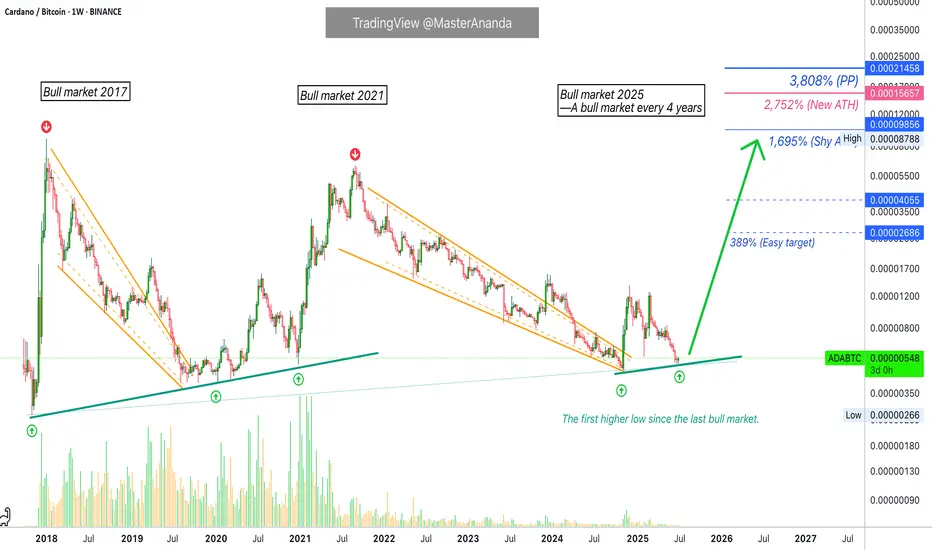
Cardano vs Bitcoin, 3800% Potential Profits—The 2025 Bull MarketCardano grew non-stop in 2021. After a bottom in August 2019 and 8 months of consolidation, it started a strong bull market. Total growth reached almost 1,500%. The peak happened August 2021. The bullish signal here comes from the fact that after the August 2021 peak, ADABTC went down and continued to produced lower and lower lows, all of the time, for years.
Them, in November 2024 we have the market bottom. In June 2025 we have a higher low. The first higher low long-term since December 2020. A low in March 2020 and then a higher low in December 2020 that produced the last bull market.
The situation now is similar. A low in November 2024 and a higher low June 2025 that will produce a new bull market.
ADABTC produced another bull market late 2017 through January 2018. If we go by Elliott's law of alternation, this bull market wave should be similar to 2017 vs 2021. So it should be really strong but also fast. I prefer the prolonged one but we will have to wait and see.
The good news is that massive growth will happen and this cannot be avoided. It will be the best experience for an entire generation of Cryptocurrency holders, buyers, investors and traders. It will be awesome for the entire market and we are blessed to be part of this game. We are blessed for all the great opportunities and we love to see the world and humanity evolve. We love Crypto and we will continue to buy and hold.
Thanks a lot for your continued support.
Boost if you enjoy the content. Do it often.
Namaste.
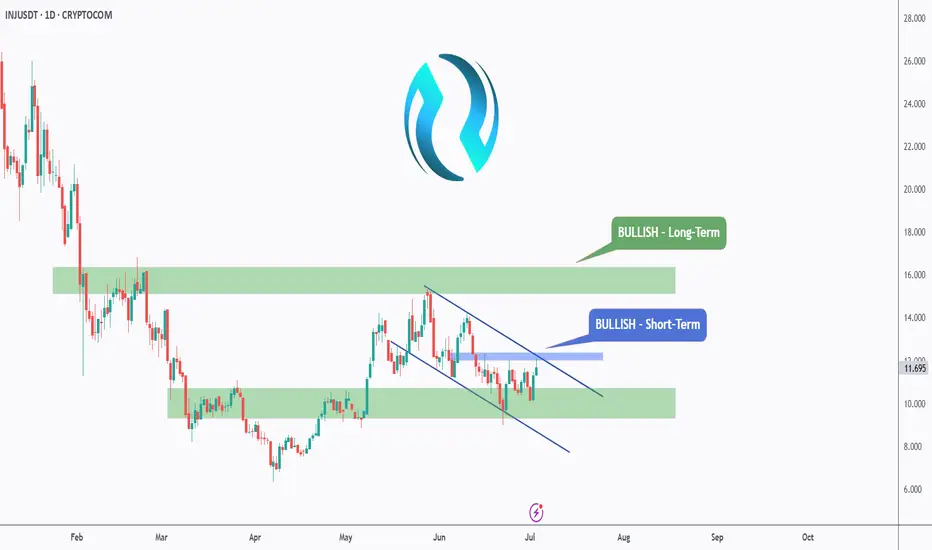
INJ - Back from the Dead?Hello TradingView Family / Fellow Traders. This is Richard, also known as theSignalyst.
INJ has been hovering within a wide range between our two green zones, spanning from $10 to $16.
For the bulls to take control in the medium term, a break above the last major high marked in blue is needed.
To confirm long-term bullish dominance, a breakout above the upper boundary of the green range is required.
📚 Always follow your trading plan regarding entry, risk management, and trade management.
Good luck!
All Strategies Are Good; If Managed Properly!
~Rich
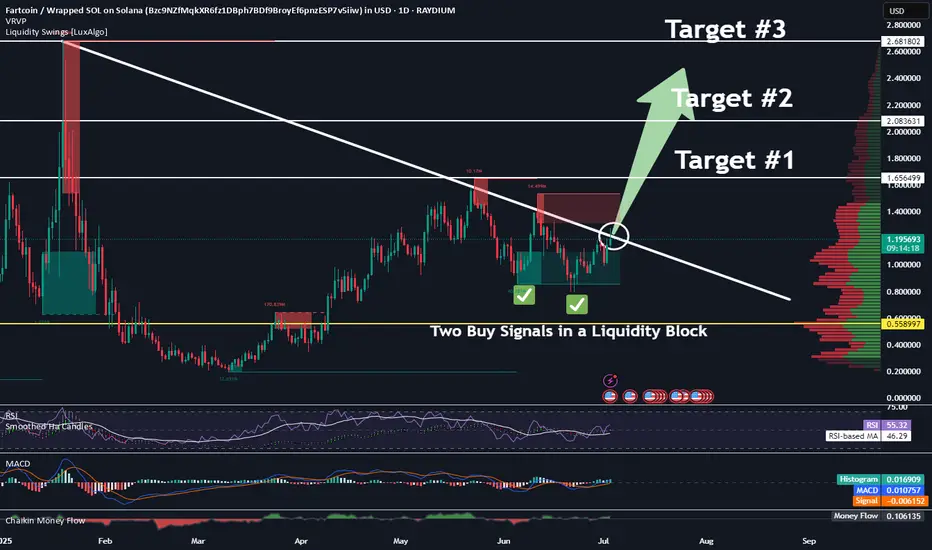
Get Ready! Hot Air Rises. Fartcoin About To Break Wind.Trading Fam,
Our national debt is a meme. The buying power of our dollar is a meme. Our monetary system is a meme. The Fed is a ponzi scheme and a meme. Everything related to geopolitical economics has become a meme. We can't take any of this stuff seriously anymore. So, why not make a profit on the best memes of the day? Enter pungeant FARTCOIN. AI-created and managed, FARTCOIN is cutting loose with no reservations. And it looks like it is about to break wind again. They say hot air rises. Let's see how far this stink can go.
Let her rip!
Stew
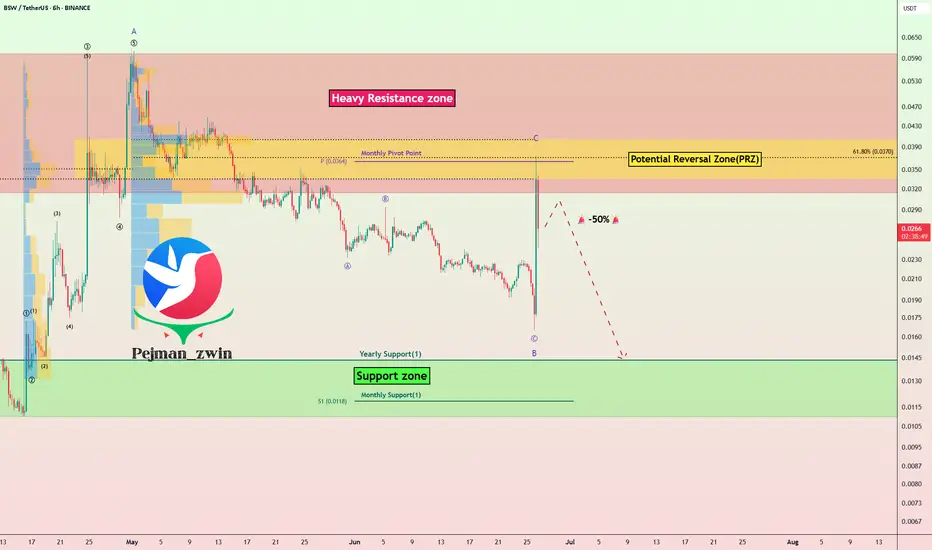
BSW Bull Trap:Binance Delisting + Weak Fundamentals = -50% AheadToday, I want to analyze the Biswap project ( BINANCE:BSWUSDT ) with the BSW token for you and examine the opportunity for a short position on the BSW token from a Fundamental and Technical perspective.
First, let's examine the conditions of the Biswap project from a Fundamental perspective.
Biswap is a decentralized exchange (DEX) built on the BNB Chain, offering features like token swaps, farming, staking, and an NFT marketplace. It became popular due to its very low trading fees (0.1%) and an aggressive referral & reward system.
However, the project is facing key fundamental issues:
Decline in trading volume and user activity
Drop in TVL rankings among DEX platforms
Inflationary tokenomics with constant reward emissions, increasing sell pressure
Most critically, Binance announced the delisting of BSW (effective July 4, 2025), shaking investor confidence severely .
In summary, while Biswap started strong, its fundamentals have weakened significantly, especially after the Binance delisting, which casts doubt over its future viability.
---------------------------------------------------
In terms of Technical Analysis , the BSW token managed to reach the Heavy Resistance zone($0.060-$0.0315) and Potential Reversal Zone(PRZ) with the previous hours' pump( more than +100% ), but then started to decline again.
In terms of Elliott wave theory , I consider the recent hours pump as a wave C of the Zigzag Correction(ABC/5-3-5) .
I expect that given the delisting(soon) of the BSW token and the technical analysis of the BSW token, it will fall by at least -50% . In fact, this pump could act as a Bull Trap .
Note: Stop Loss(SL)= $0.0422 = We can expect more pumps.
Please respect each other's ideas and express them politely if you agree or disagree.
Biswap Analyze (BSWUSDT), 1-hour time frame.
Be sure to follow the updated ideas.
Do not forget to put a Stop loss for your positions (For every position you want to open).
Please follow your strategy and updates; this is just my Idea, and I will gladly see your ideas in this post.
Please do not forget the ✅' like '✅ button 🙏😊 & Share it with your friends; thanks, and Trade safe.
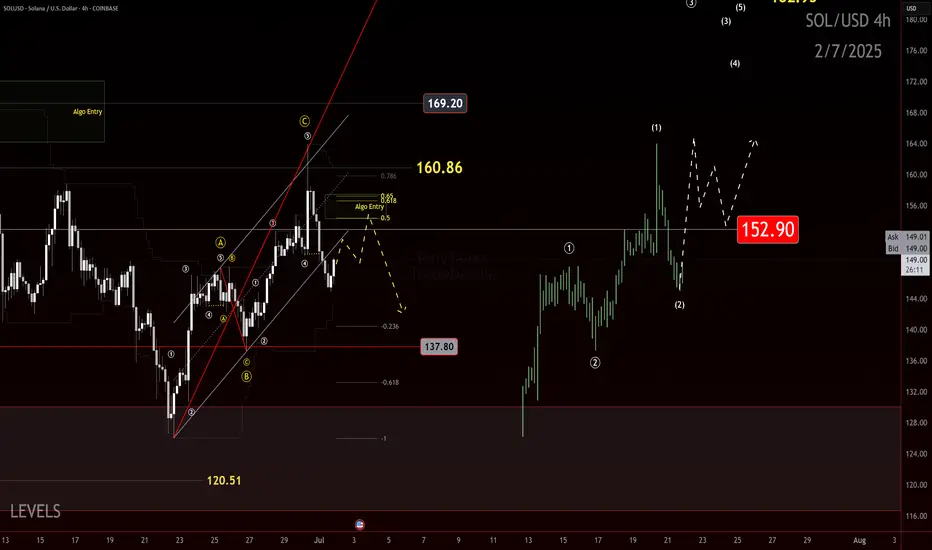
Sol searching, for an entry. If you find this information inspiring/helpful, please consider a boost and follow! Any questions or comments, please leave a comment!
The Elliottician’s Paradox: 12-12 or Zigzag? Bias Is the Key
Ever stare at a chart and ask, “Is that a 12-12 or a classic zigzag?” Yeah… welcome to the paradox we Elliotticians live in. Pattern recognition’s a blessing and a curse because context is everything, but confidence can get you wrecked.
This one’s got me on the edge.
What’s Happening Here
We’re currently watching a move that could be either:
- A corrective zigzag (5-3-5), or
- A 1-2, 1-2 setup, gearing up for a blastoff
That’s the core dilemma — two valid options, both technically legal. So what tips the scales? Bias.
The Line in the Sand: 152
Here’s what I’m watching for:
Key Level: 152
- That’s the bull/bear line for me.
- A strong impulsive reclaim above 152 flips the script. I’d reconsider the bearish view if price surges with intent.
- But if we return to 152 in a sluggish, corrective way? I’ll be eyeing continuation lower, aligned with a more traditional zigzag structure.
Elliott View
This is where the paradox plays out:
If we’re looking at a 1-2, 1-2 setup, expect:
- A powerful Wave 3 soon (should not be shy)
If it’s a Zigzag ABC:
- Then we should expect a corrective internal retracement and continuation to the down side, at minimum past the origin of the initial move.
The chart will speak loudest. But structure and strength of this next leg will confirm the story.
Final Thoughts
Trading isn’t about being right. It’s about managing scenarios — and this one’s a classic fork-in-the-road moment. I’ve got a plan for both directions.
152 is my trigger. Stay below it and fade the rally. Break above it impulsively, and I’ll flip my bias with it.
The Elliottician’s paradox isn’t a trap — it’s an invitation to stay sharp.
Your Turn
How are you reading this structure? Do you favor the zigzag or the 1-2 setup? Drop a comment and let me know.
Trade safe, trade clarity!
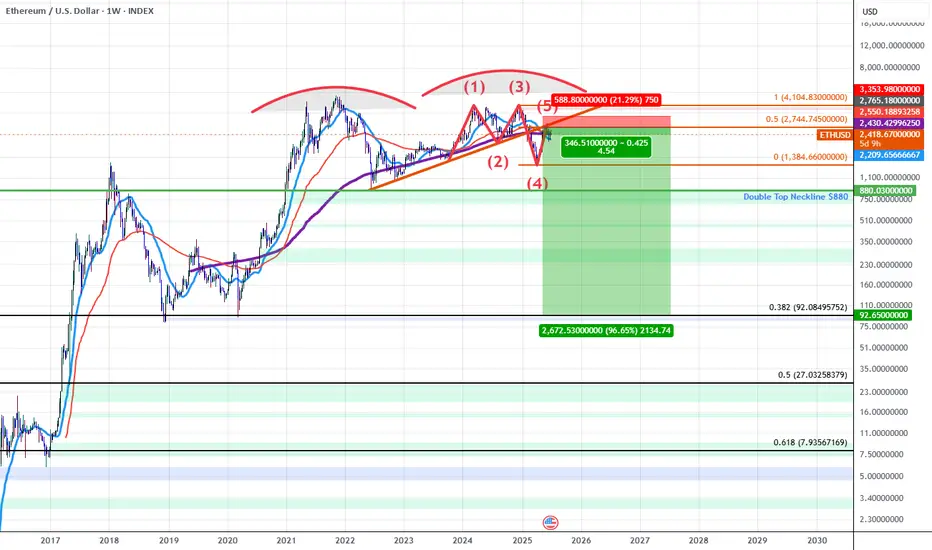
ETHUSD: Double Top into A Bearish 5-0 BreakdownETH for the last 5 years has been developing a Double Topping pattern which has put in a series of lower highs during the most recent 2nd run up. As we've confirmed these lower highs we've broken down below trendline and found resistance at the trendline which happens to have confluence with the PCZ of a Bearish 5-0 wave formation.
As we begin to find weakness and Bearish price action begins I suspect price will make it's way towards the neckline of the double top aligning with the $880 price level if ETH breaks below that level there will be no significant support until it reaches the all-time 0.382 retrace down at around $92.10.
In short it seems ETH is in the early stages of a macro breakdown which could result in value declines greater than 80%.
do not SHORT Bitcoin with 20XA consolidation range happens when the market trades sideways, in a neutral capacity. This sideways trading is neither bearish nor bullish, thus neutral. The bearish or bullish tendencies can only be defined based on the broader market structure.
If the consolidation range develops coming from a major drop, you can say that the market is bearish and the consolidation a bearish consolidation even if the breakout happens to the upside. Once it happens to the upside we can say that a reversal developed but the tendencies were bearish nonetheless.
If the consolidation range develops coming from a major rise, you can easy say while being correct that the market is bullish and the consolidation phase a bullish one, because of the bigger structure, previous price action and the chart.
Bitcoin is consolidating with bullish tendencies but there is a boundary which we call resistance and another boundary which we call support, this is the trading range. When the market is ranging, this is when margin traders lose the most because the trend remains hidden and money tends to be made when the market is in a clear trend.
Whenever the upper boundary gets challenged we get a retrace and a test of support. Whenever the lower boundary gets tested prices recover and move back up. This process gets repeated for as long as it is needed to remove all the weak hands, most of the signals are pure noise.
This is the situation in which we find Bitcoin today. Ultra-bullish but sideways and anything can happen short-term. Do not SHORT Bitcoin with 20X. You might end up with some fast and easy profits.
Thank you for reading.
Namaste.
