Harvest Finance 1,490% Profits Potential & The 2025 Bull MarketThis is a yield aggregator, DeFi. And if there is something people love about the Cryptocurrency market is decentralized finance.
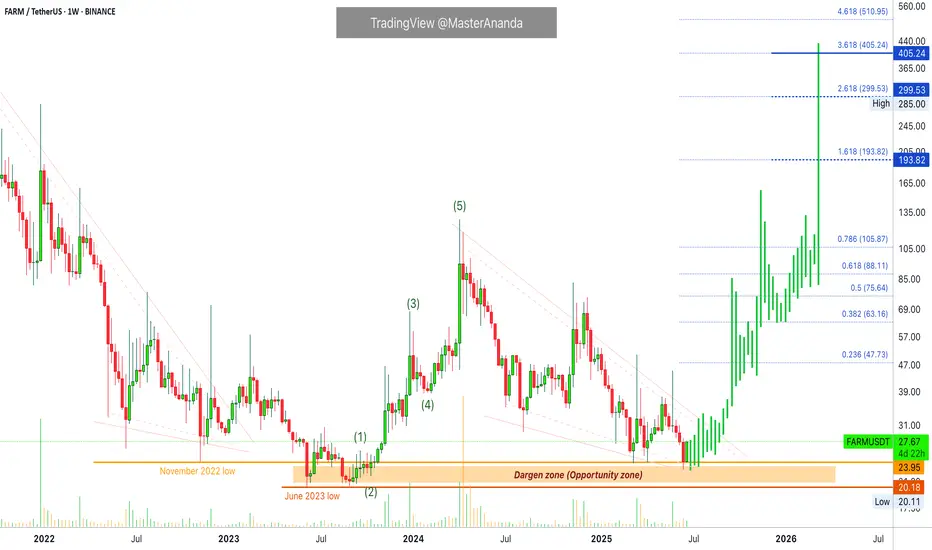
Harvest Finance —FARMUSDT
The danger zone is also the opportunity zone. An opportunity that is not available anymore. This is a price range between the November 2022 and June 2023 lows.
FARM found support in April and May 2025 at the exact same level from November 2022, on a wick. In June, last week, it wicked below this level (orange line on the chart) just to quickly recover. This week FARMUSDT is full green.
While the opportunity zone is likely gone forever, there is still some time to buy while prices are low. This pair has great potential for growth and I can see the development of a new bullish impulse in the coming days.
Entry level
Anything below $30 should be consider a strong buy opportunity when considering the long-term.
Growth potential
Growth potential is truly unlimited and it is hard to make accurate predictions here because this pair started trading in August 2021. It was near the end of the previous bull market. So we don't know if the top is a valid number or it simply crashed because the bull market force had already run its course.
Some conservative targets yet strong can be seen on the chart.
$299 and $430 are looking good, I would say high probability.
The $193 target I would say is the minimum within the next 3-6 months. This one would produce a total of 615% profits potential. So this is a good pair.
The $430 target, just to give you an idea, gives more than 1,490%.
Some pairs show maximum growth potential reaching 500-600%. Some other pairs can go as high as 8,000-9,000%. It really depends on the size of the project, the popularity, past action and how many exchanges carry it for trading. I do all my projections based on the chart and past action.
One thing to keep in mind is that the market tends to surprise, very important. The bull market is very likely to end up breaking all the targets that we extracted so far. It is a common situation, it always tend to go much higher and for much longer than anything we can imagine; great.
Thank you for reading.
Namaste.
Altcoins
Stacks Short- Mid- & Long-Term Bullish Signals (PP: 900%+)Stacks is a very interesting project and I believe it has many fans. Here the signals are really good and by good I mean strong.
This pair, STXUSDT, has been a top performer but the action bearish since March 2024.
Between March 2024 and April 2025 we have a classic ABC correction, a long-term one. Needless to say, this type of correction is always followed by an impulse, a bullish impulse and this is a sequence of 1,2,3,4,5 waves. Three waves up and two waves down in-between.
The August 2023 low produces a rounded bottom and then a new wave of growth. This low is preceded by another bullish wave. This pair has been growing long-term.
Then a new rounded bottom shows up but this one a long-term higher low compared to August 2023. That is April and June 2025. So mixed bullish signal. Short-term, mid-term and long-term all being combined to give us a bullish mix. Ultra-bullish in short.
The last all-time high happened around $3.84, so the next one can happen around $7.11 or $9.65. The $7.11 projection gives more than 900% profits potential.
Oh, and this week is young and already full green. The candle's real body trades above the two previous weeks open and close.
Thank you for reading.
Your support is appreciated.
Namaste.

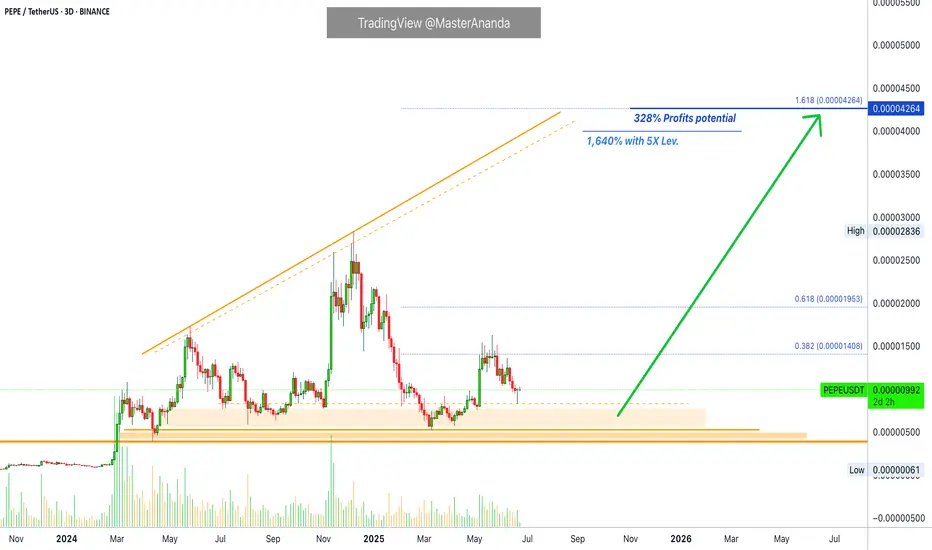
Pepe Prepares To Grow After 5 Weeks Red (5X Possible)I am sorry, the system is not working and won't let me write more than a few lines. This is the best I managed to publish without getting an error.
You can get the idea by looking at the chart and drawings. It points to higher prices in the coming weeks and months. Namaste.
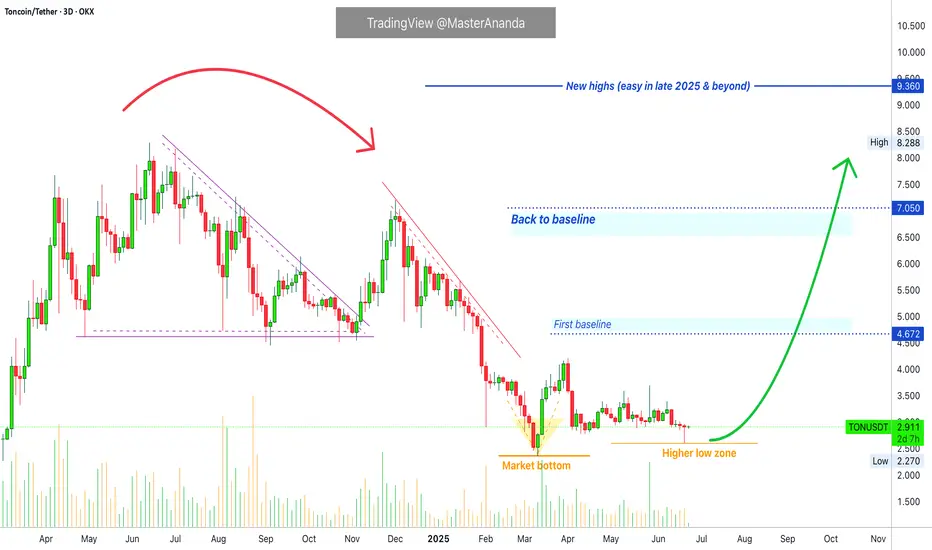
Toncoin Final Call: Last Chance For Bottom Prices (3-5X Lev Pos)The last 3D session that closed produced a major reversal signal and this is the last chance truly, the last opportunity; the final call. It is the final call to get Toncoin at low prices before a major bull market. It will be a massive bullish wave and this wave will reach new all-time highs and beyond during the price discovery phase.
This chart setup can be traded with leverage. Traders can use 3-5X leverage with very low risk. Spot traders can buy and hold and this will be one of the biggest projects in this cycle.
The pairs that moved weakly in the first bounce, 7-April, will do much better in this second jump. These pairs will also move fast and stronger compared to the ones that already moved strong between April and May.
There are many pairs and many projects. In each wave, a different set of pairs moves strong and becomes top performers. The ones that didn't move last time can move this time. Those that did move can move again but they tend to lag behind. The energy moves around the entire market and never gets stuck in one place.
Adapt and change. The market is always changing... Choose wisely.
This is a huge opportunity. It is time to trade.
Buy the bottom and hold; you will be happy with the results.
Namaste.
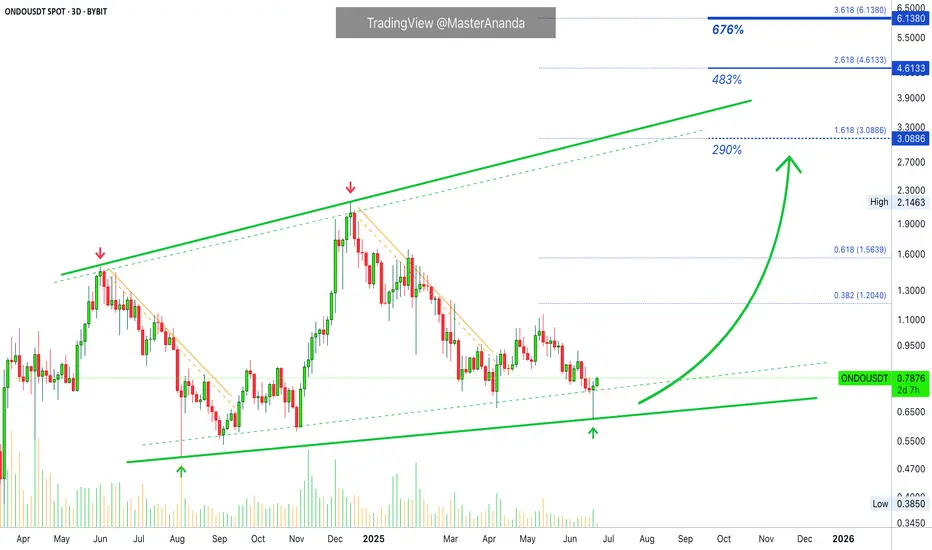
Ondo Finance: 290%, 483% & 676% Summer & FallBullish momentum right now is building up so fast that I can hardly share a chart before prices are up 5 to 10%. If you try to buy, prices can runaway from you specially when using leverage. That's what I mean when I say that the bottom, bottom prices, will only last a few days at max. The time is now.
Here we have Ondo Finance with a great pattern, the ascending channel. This chart structure clearly reveals a very strong, long-term bullish bias. And the logical conclusion is always obvious based on price action.
Each time there is a drop, the lowest point is a higher low.
Each time there is an advance, the market ends up producing a higher high...
I know, people are allergic to bottom prices so right now everybody is away but, there is good news; soon the market will be trading really high up and once prices are high, everybody is ready to trade.
Huge potential for growth on this chart. These target can be hit within 1-3 months, 3-6 months with the potential open for higher than what is shown.
Namaste.
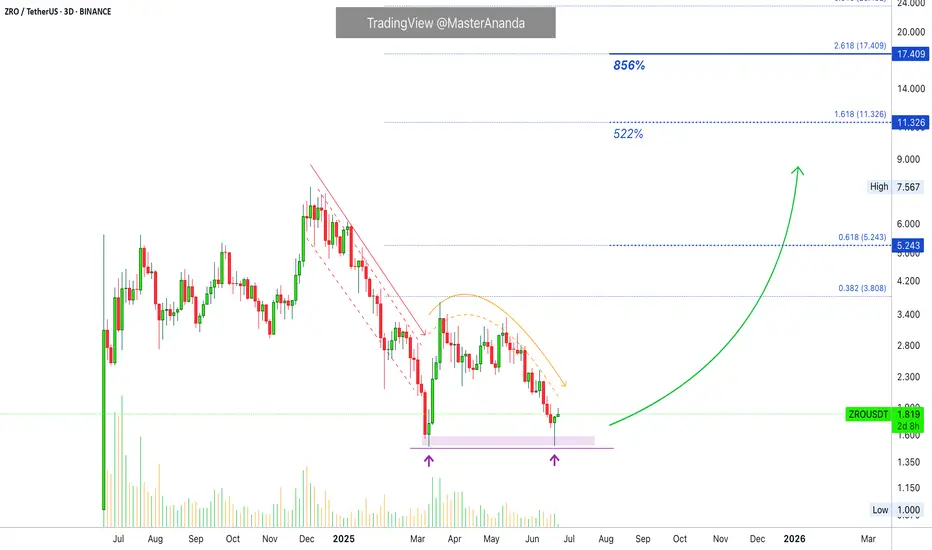
LayerZero, Exposing The Bottom, NEW Uptrend in The MakingNotice how a very steep decline suddenly becomes flat. The bottom that is. As ZROUSDT was crashing down from December 2024 we have lower lows. Then something changes; market dynamics, price action, the trend, instead of lower lows the bottom goes flat and yesterday we have a double-bottom. This means that bears are no longer in charge. Buyers were present at support.
Truly, that's all we need to know.
No complexities, no hundreds of indicators, no "fundamentals," nothing, none.
Just this small amount of information tells us that the downtrend is over, with the downtrend being over we know a reversal can happen any day. We are expecting this reversal to start to shape itself now. A new uptrend will show up in the coming weeks. Bullish action will start within days.
LayerZero is going up.
Thank you for reading.
Namaste.
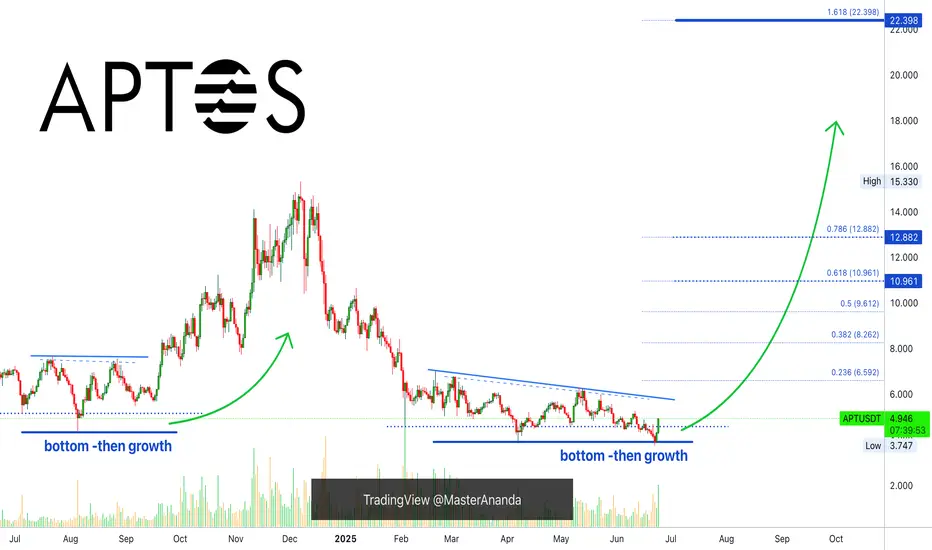
Aptos Bullish, Altcoins BullishThe best is yet to come. Do not despair my dear friend, patience is key.
Aptos is breaking bullish right now after a final low with the highest volume since February. This confirms the latest double-bottom as the market bottom.
The high bullish momentum developing on today's candle, full green, coupled with the fact that a major flush is present on the chart reveals really good news. Today, things might seen down and quiet; everything can change in a day.
The bullish wave is on, it is starting now and it will be strong. Bottom prices will be gone within hours but we will experience long-term growth. Keep in mind that 100%-200% can happen within a matter of days. This is because the market is set to grow in excess of 1,000-2,000%, so the first jump is very strong but only signals the start. Getting bottom prices can be life changing.
This is a friendly reminder; the best is yet to come.
Aptos bullish means the altcoins are bullish.
The altcoins going bullish means that Bitcoin will soon resume with new all-time highs and additional growth.
Trust crypto, trust the market, trust your plan. You will be rewarded long-term.
The time to buy is now. Profits are on their way. To you!
Namaste.
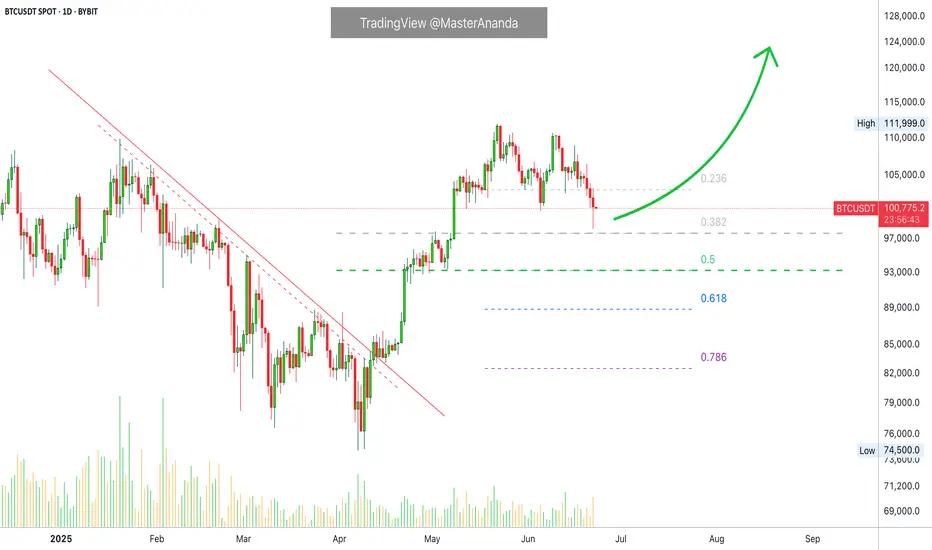
Bitcoin Recovers...What we've learned in the past few years is that Bitcoin's demand is just too strong. Retraces and corrections are no longer wild like before, these are limited and capped. Nobody wants to take the risk of selling too much and being left out or losing their Bitcoins for good, they are just too valuable. Many times more valuable than the USD Dollar or Gold. It is the most valuable asset in the whole digital world.
Other than food and toilet paper, nothing is more valuable than Bitcoin.
Technical analysis
Ok, let's focus on the chart.
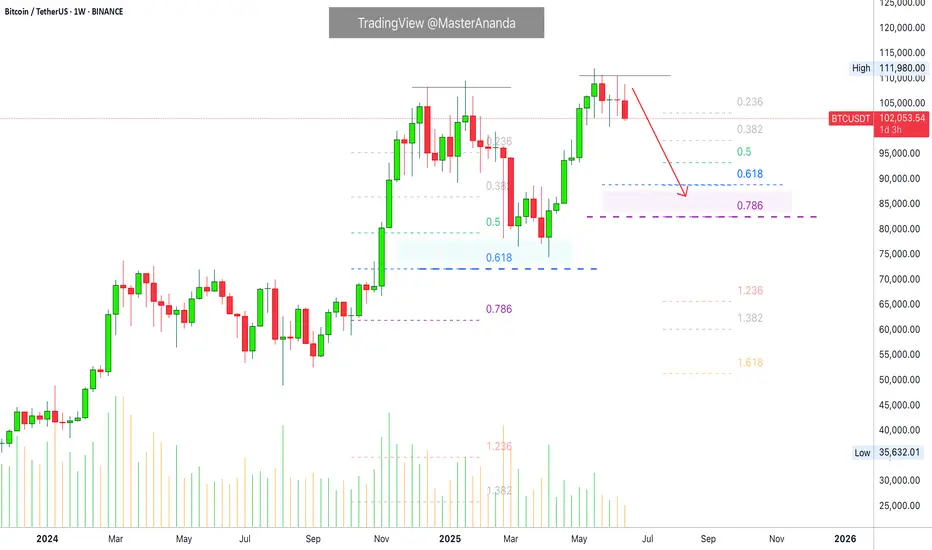
The retrace has been ongoing for 31 days, since 22-May.
Total drop amounts to 12.33% (-12%).
The action moved below the 5-June low around $100,400. Bitcoin is now back above this level. Clearly showing that this is a stop-loss hunt event.
Stop-loss hunt and liquidity hunt because thousands, if not millions, of over-leveraged traders have been liquidated. They were betting on the wrong side short-term. Long-term yes, bullish is the trend, the direction and the win. Short-term, it was SHORT but not anymore.
Never trade with 20X that's crazy. Imagine going LONG 20X at the all-time high? Isn't that stupid?
I can bet you the same people didn't want to buy LONG when Bitcoin was trading at $75,000. In fact, I can bet that these people that just got liquidated were selling below $80,000 and buying LONG with 20X at $110,000. A recipe for disaster.
Anyway, I am calling it early. This is it, we are going up.
I got my signals, as you already know, from the altcoins.
If you agree boost and follow.
Thanks a lot for your continued support.
Namaste.
Bitcoin Weekly Ultra-BearishThe 100K support is still valid but the weekly timeframe chart isn't looking good.
Good afternoon my fellow Cryptocurrency trader, how are you feeling today?
Bitcoin peaked the week 19-May. Then we have bearish action only.
The week after 19-May was red, then two neutral weeks and a continuation this week. It looks pretty bad right now, terrible to be honest.
» The main support range sits between $82,500 and $88,888.
Thank you for reading.
This support zone will only become active is 100K breaks on the weekly timeframe.
Namaste.
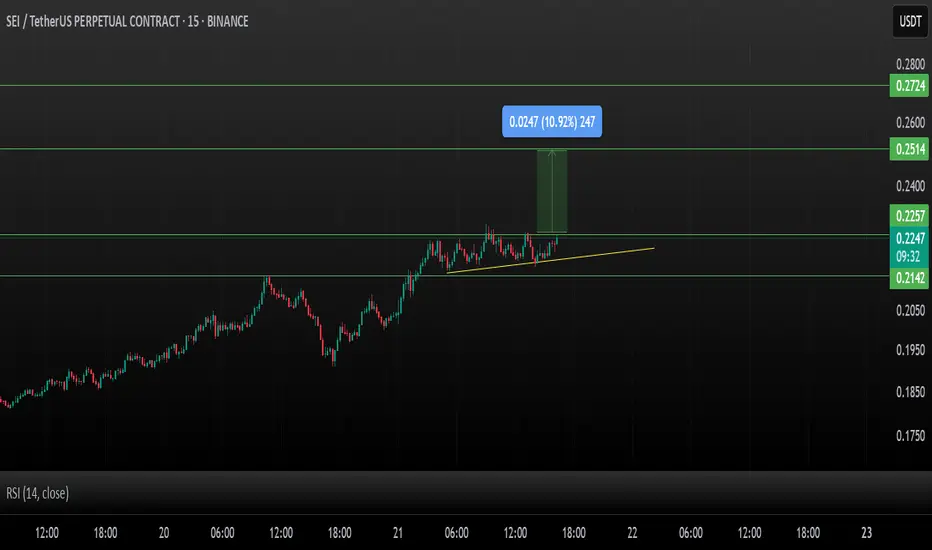
SEI/USDT – Bullish Breakout Setup!SEI consolidates in a classic ascending triangle, showing a strong structure with higher lows and flat resistance.
A breakout above ~$0.225 could trigger a move toward higher targets.
Key Levels:
Support: $0.2142 (triangle base)
Resistance: $0.2257 (breakout level)
Stoploss: Below $0.214 (invalidation of structure)
Targets on Breakout:
TP1: $0.2514
TP2: $0.2724
RSI is climbing from mid-range with a bullish crossover, indicating strengthening momentum.
Structure looks favorable as long as support holds. Wait for volume confirmation on breakout for higher probability.
Not financial advice. Do your own research before investing (DYOR).
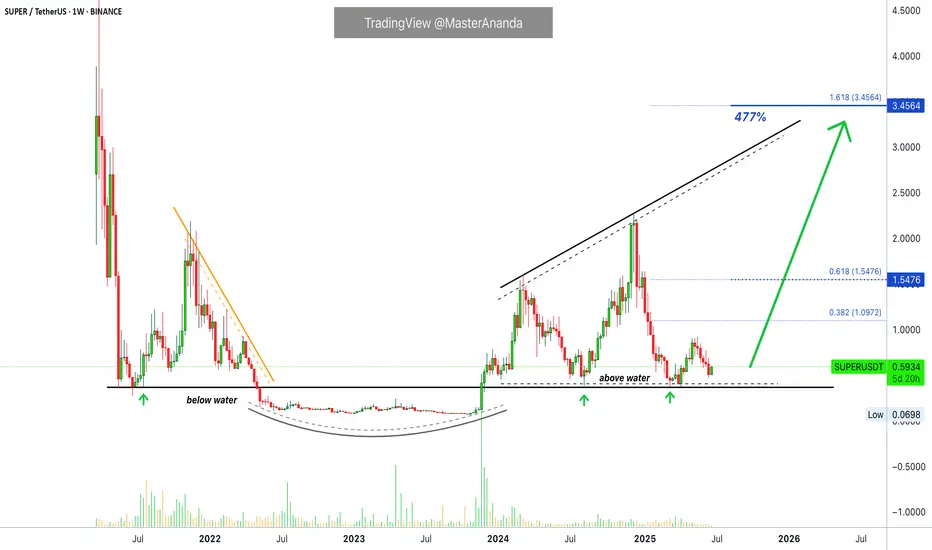
SuperVerse "Above Water," Higher Highs With A Solid BaseHere we have a really long-term support. In May and June 2021 SuperVerse (SUPERUSDT) found support at the same level as in August 2024 and March/April 2025. Amazing.
Back in 2021 SUPERUSDT was coming down from a high point and this support zone worked to produce a small bounce before a long-term market bottom was established. SuperVerse went 'below water' for 560 days. Once back 'above water' the bulls have the upper hand and this is where the action is happening today.
In simple terms, the bullish zone. SUPERUSDT confirmed recently its long-term support producing higher highs with a solid base. The bottom is flat but the peaks become higher with each bullish wave. This is to say that the next high will be a major new high and the biggest ever for this pair-project.
SuperVerse has never experienced what it is about to experience. It started in a bear market and it did good in late 2023, but 2023 was the recovery year, part of a long-term transition between bear and bull.
Now the year is 2025 and this is the bull market year. Notice that between 2022 and 2023 SUPERUSDT traded below water. In 2024 and 2025 it trades above water. We are about to experience the best yet.
Prepare for maximum growth.
SuperVerse will go higher than the easy target shown on the chart. Much higher.
Namaste.
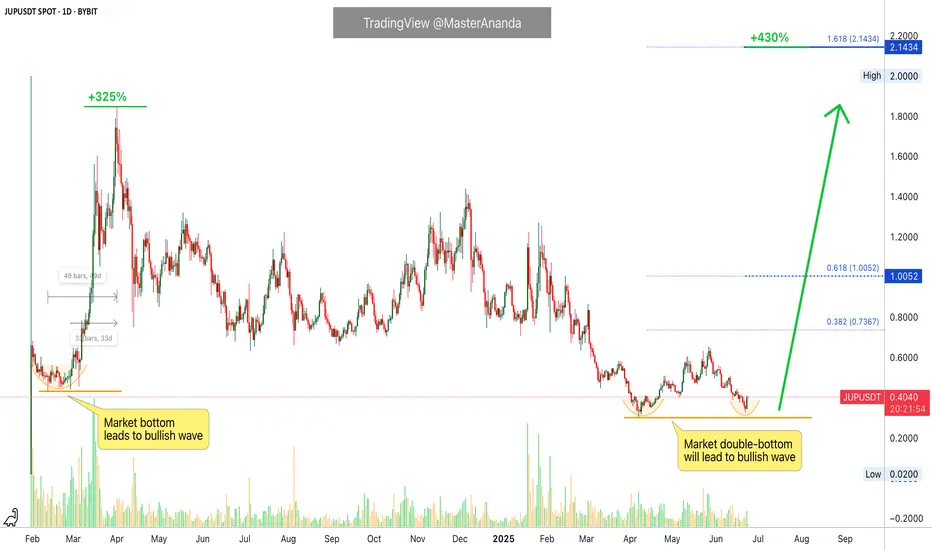
Jupiter, Mapping A 430% Bullish WaveJupiter is set to grow really strong, we agree correct?
When we agree right from the start, I can skip the technical analysis and move straight to the target. Because everybody knows JUPUSDT is set to grow really strong in the coming months.
Back in early 2024 a market bottom led to growth. A 325% bullish wave developed within 49 days. The bulk of the action happened within 33 days. We can say +100% profits every ten days, sounds good. Looks great.
We know for a fact that this pair can grow more than 300% in a single month. What if the bullish phase is stronger now, longer now... How much growth would be possible if JUPUSDT grows straight up for 3 months? What about six months?
Here I have an easy target at $2.14 with 430% profits potential. This is mid-term, within 3 months.
My ideas and believe project think see much more happening in 2025 than what I am showing on this chart. But this is the start. This is an easy 430% wave. It can start now, soon, within days but once it starts going it will keep on going non-stop until the end. Sorry, no wait; one stop before the final bull run, but the whole process can take more than six months.
Are you ready?
How are you going to maximize profits if you are one of those trading this coin?
What's your plan?
Will you buy and wait for everything to be up in order to sell? Meaning, just securing lower prices now and "let the market take care of the rest"?
Or, are you going to set up your sell orders on target, selling portions at each resistance level as prices grow?
Are you going to buy with leverage? Are you ready to lose everything if the market shakes? Are you going with 2-3X or 10-20X? I would always recommend the lower end because it is better to earn a sure 200% than lose everything looking for an uncertain 10,000%.
What you do is up to you. But here you have this chart; you know what is coming, you have the blessing of knowing ahead of time so you can plan based on your own trading style and goals.
It can be big or it can be small but we are all going to win if we approach the market with the right mindset, and if we keep risk to a minimum. Some people like high risk though and that's ok too. There is something for each and every one of us.
Jupiter will end up going much higher than what is shown on the chart.
Namaste.
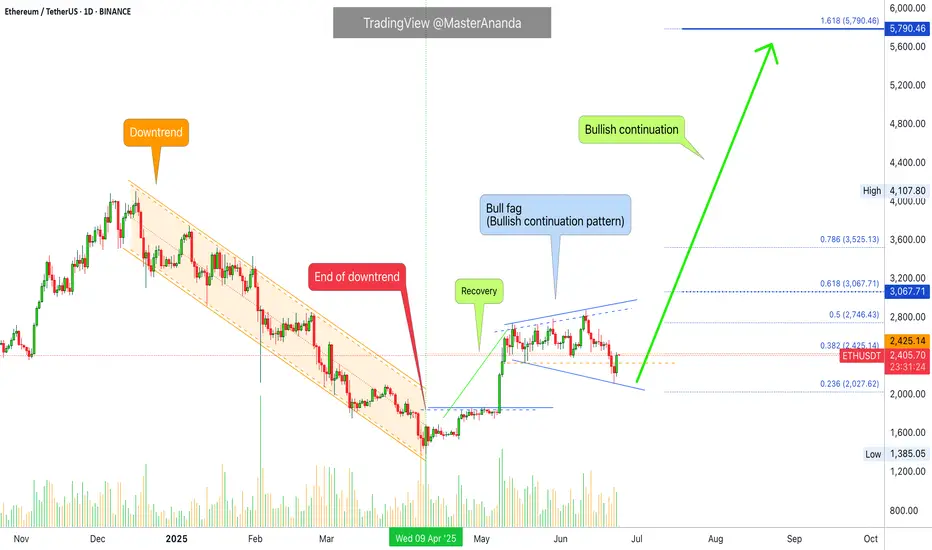
Ethereum vs Small Cap. & The 2025-26 Cryptocurrency Bull MarketThe last three days ended up being a very nice flush, a strong one but the action quickly recovered above the 18-May low.
Ethereum was trading above $2,300 since mid-May and always stayed above this level. It broke suddenly below, out of nowhere, but the action is bullish again. We can say that this was a stop-loss hunt event, a bear-trap and nothing more or else we would see a continuation of the bearish action rather than a strong inverse reaction, a bullish jump.
It is not only Ethereum of course that is experiencing this type of bullish action, some altcoins are going nuts. Really crazy right now producing so much momentum that people are still wondering if the market is going down... Or is it going up?
It is obviously up, just look at the 7-April low.
Ethereum hit a low of $1,385 on 7-April. The higher low yesterday ended at $2,111.
You see what I mean?
The market is ultra-bullish because the last low is so far away. It is impossible that it will be tested even less possible for it to break. Ok, so a market shakeout we agree but now that the shakeout is complete what is supposed to happen next?
Watch the smaller altcoins.
Thank you for reading.
Namaste.
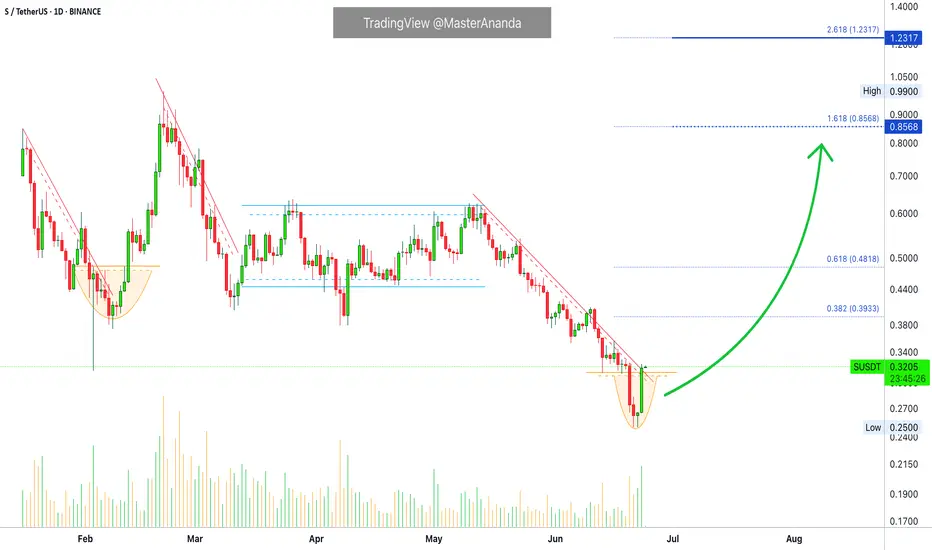
The Altcoins Bull Market is Here: Sonic Enters New Uptrend"Everything can change in a day."
It is amazing just how fast everything can change. One day the market is bearish, it is the end; the next day everything is green and we are certain of a strong bullish wave. Watch-out, stay alert! Everything can change in a day.
Everything is already changing for the better and this is great. The greatest part of all is the fact that we are early, extremely early and us knowing that this bullish wave will be the biggest since 2021.
If you are reading this now you are blessed. You are very smart, you waited patiently or simply, you work within the Cryptocurrency space. The time is now. Take advantage of all the opportunities all around you because soon they will be gone. There will be growth long-term but bottom prices only last for a few days.
Technical analysis
SUSDT (Sonic) already produced a strong rounded bottom, high volume and ready to break the downtrend. The end of a downtrend leads to an uptrend; uptrend means long-term growth.
Thank you for reading.
Namaste.
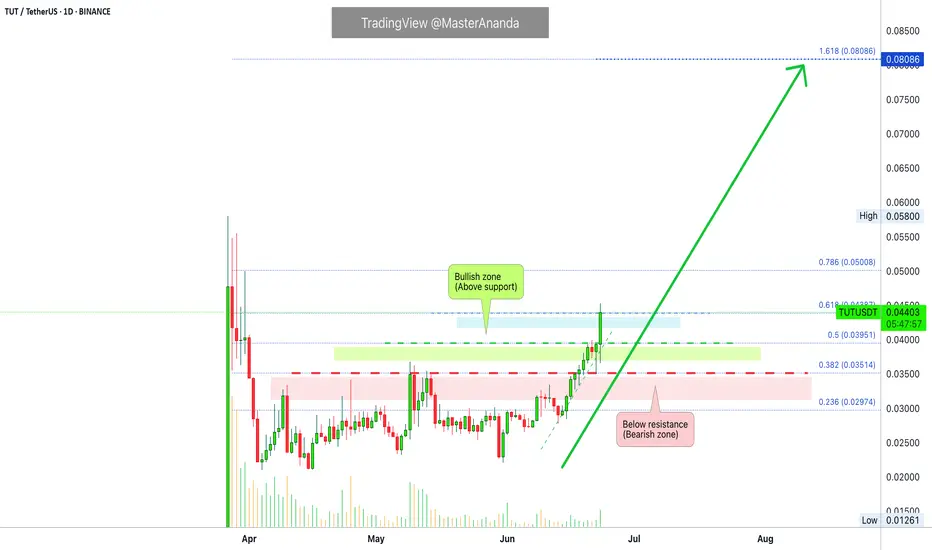
Tutorial Bullish Zone & Map (84% Easy Target Short-Term)Today TUTUSDT (Tutorial) has a combination of bullish signals.
It is moving above three strong support levels that were formally resistance. The red zone has been flipped, resistance turned support. The green and blue zones are yet a work in process. The action is happening above but the confirmation only comes ones the daily candle (session) closes above. That is, if today closes above 0.04387, this final resistance level has been flipped support.
Above 0.5 Fib. extension or 0.03951 is the bullish zone. TUTUSDT is now strongly bullish.
Today we have a full green candle and this is great, with rising volume. The highest volume since 1-June with room of course for it to go higher. We can easily see higher prices in the coming weeks and months.
Notice that this is a young chart, but if we couple marketwide action with short-term action, we can predict the next move. This is using the assumption that the market is one; what one does, the rest follows.
It is tricky but with practice you can predict how the market will move as well.
Thanks a lot for your continued support.
The next target stands at 0.08086. That's the main target short-term. An easy target I should say. Potential sits around 84% right now.
Namaste.
BNB Double Correction Hits Extreme ZoneBINANCE:BNBUSD has now entered the Blue Box buying area, signaling the final phase of the correction. A weekly reversal confirmation is the next key step — once that’s in place, the bounce phase is expected to begin.

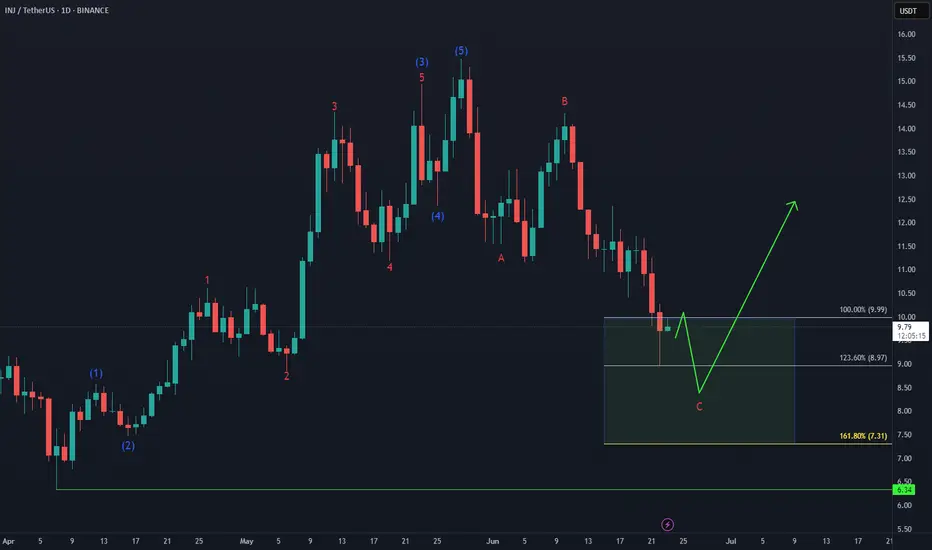
Injective Enters the Daily Bouncing AreaCRYPTO:INJUSD has tapped into the equal legs zone at $9.99–$8.97, a key Fibonacci-based support area where buyers may begin to step in. This zone often acts as a magnet for a reaction higher, especially if the broader structure supports a bullish reversal.
In the coming weeks, watch for confirmation signals — a strong bounce from this zone could kick off the next leg up.
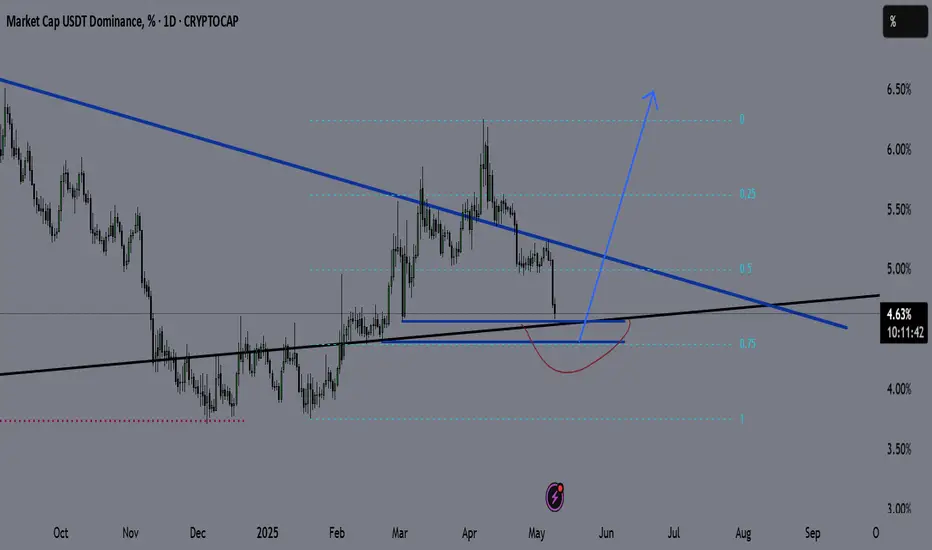
USDT.D LONG - MID TERM PLANUSDT.D is one of the best tools to understand what's happening in the crypto market.
It shows the dominance of USDT across the entire space — and has a strong inverse correlation with BTC and crypto assets.
Technicals:
USDT.D is approaching its long-term support trendline.
I expect a deviation below that line — possibly toward the 0.75 Fibonacci level — before a strong move up.
That move could last 1–3 months, which means more downside for alts during this time.
Plan:
Shorting altcoins — especially ETH-related tokens and memecoins.
Looking to buy back around early August.
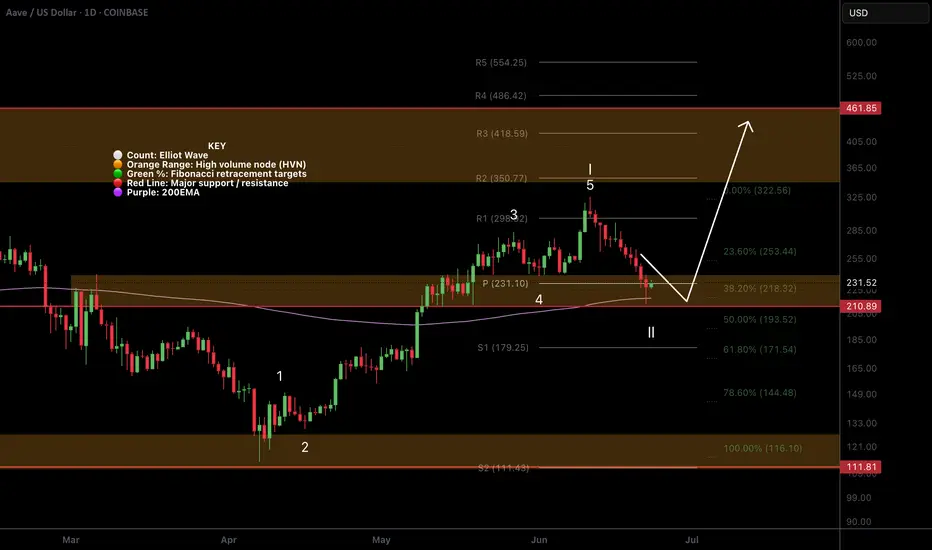
AAVE Standing out among the alt coins!CRYPTOCAP:AAVE is looking stronger than most for now. Local analysis has broken the bullish market structure on what appears to be a textbook Elliot Wave 1.
Price is testing quadruple support: Daily 200EMA, daily pivot, major support High Volume Node (HVN) and the 0.382-0.5 Fib retracements. This should be a tough nut to crack (as long as CRYPTOCAP:BTC doesn't dump hard).
Wave 2 retracement's are usually deep and come with a strong fear. It is where most retail investors capitulate only to find price turns around and continues bullishly without them in a aggressive wave 3.
Analysis is invalidated below $111, so quite a ways off yet.
If war escalation continue, irrational investor behaviour will likely break this technical analysis.
Safe trading.
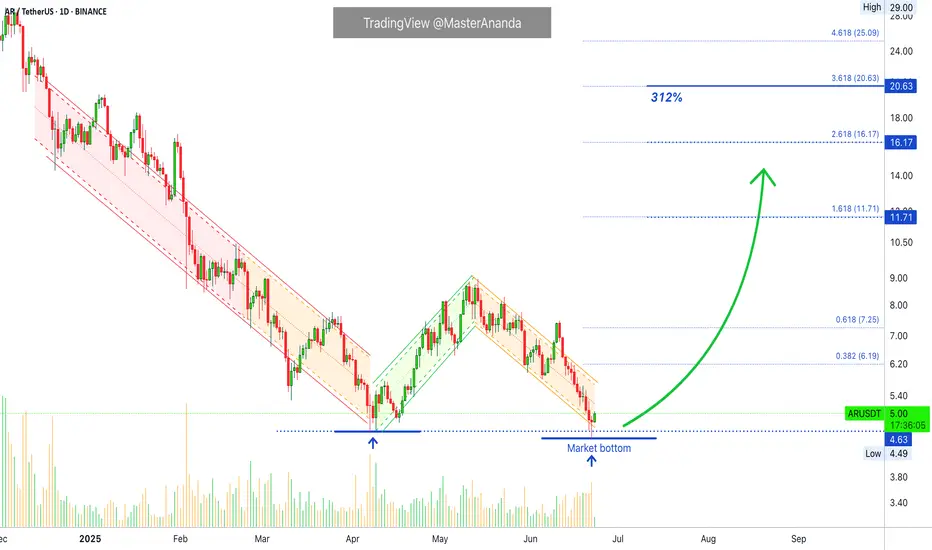
Arweave—Bullish Bias Confirmed (Altcoins Bull Market As Promise)Three weeks ago I told you a very strong bullish wave was approaching the altcoins market. It is here, confirmed. The rest is just too easy...
Tell me... Can you see this?
Tell me you can see this. I know you can.
Tell me you can see the end of a correction, the bearish wave.
On the 5th of June the market was supposed to move up. It started up and went up for five days. 11-June produced a major crash rather than a bullish continuation... Surprise! but the market never moves straight down, this was the final leg down; the bottom is in, we can change trend now.
Technically speaking, the 7-April bottom-low holds. We have a double-bottom situation.
The low in April led to growth. This time around we have a slightly lower low with a bullish signal coming from the last candle that closed, a reversal candle. We also have a bullish chart pattern and marketwide action; it is very early of course. I am always early because I look 24-7 at the charts.
We have first a bottom and then a double-bottom after a little more than two months. This is it. Bear volume continues to drop and has been dropping since late 2024. This means that the bearish force has been exhausted, fully exhausted. Even the latest low yesterday has lower volume than the previous lows.
This is it. The bullish bias is now fully confirmed.
We won't have to wait long. It will be clear based on price action.
Thanks a lot for your continued support.
Namaste.
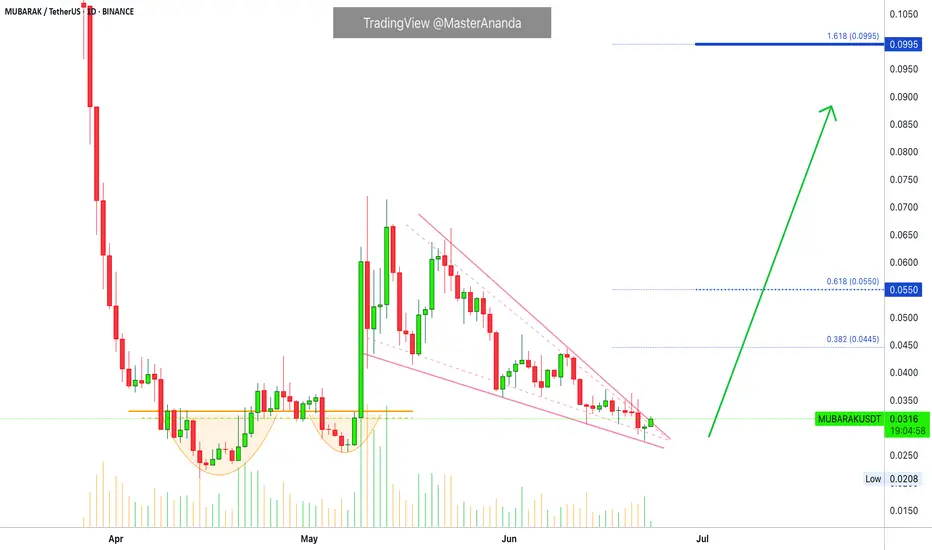
Mubarak Falling Wedge & Reversal Candle, Simple TradingAnother good chart setup, trade-opportunity, fully based on TA: MUBARAKUSDT.
The classic falling wedge is present on the chart, a perfect one.
The last candle that closed resulted in a reversal signal with increasing volume, also a higher low compared to April and May. Perfect market conditions. There is first a bottom pattern that leads to a bullish wave. The bullish wave gets corrected into a higher low and a clear reversal pattern develops. This higher low will lead to a new bullish wave where we are expected to sell at the top.
After this new bullish wave runs its course, we get a new correction. We know the end of this new correction because some form of signal will show up. We don't have to worry about the next correction nor about the long-term. Here, we can simply focus on the next target; buy now, wait and the market takes care of the rest.
Buy now when prices are low and hold. Set your sell (limit) order on target; the market takes care of the rest. Once your target hits, you will see a new balance in your account containing your initial layout plus profits. Very easy. Then rinse and repeat.
Next chart, next opportunity, next altcoin, next project, next pair, next trade.
Buy when prices are low; hold.
Sell when prices are high.
You can thank me now.
Namaste.
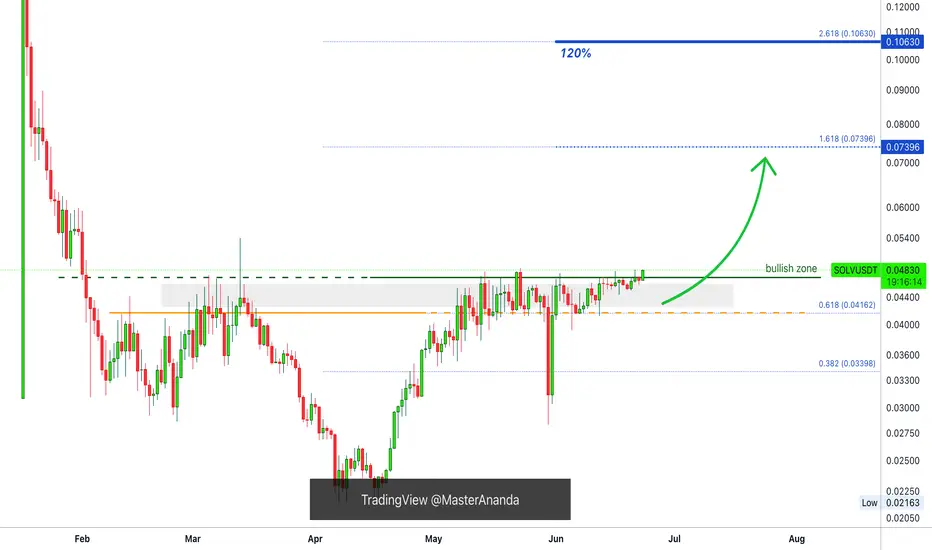
Solv Protocol Conquers Resistance, Easy 120%SOLVUSDT has been creeping higher slowly. It has been challenging resistance for weeks and finally, just today, the major resistance level on this chart breaks. It has been conquered.
SOLVUSDT is now in bullish territory and moving higher. The way I see it goes something like this: There will be a small time window for SOLV to develop bullish force. As soon as prices move higher, just a bit higher, say above 0.05000, bullish momentum will grow and there will be a major jump. The 120% target on the chart is intended for the short-term and should be an easy one.
This is another good chart for short-term profits. Everything altcoins will do great in the coming weeks and days. If you waited patiently, you will be rewarded. If you held through the final shakeout and market flush, you are about to get paid for doing a good job. You deserve all the best and more.
Thanks a lot for your continued support.
Namaste.
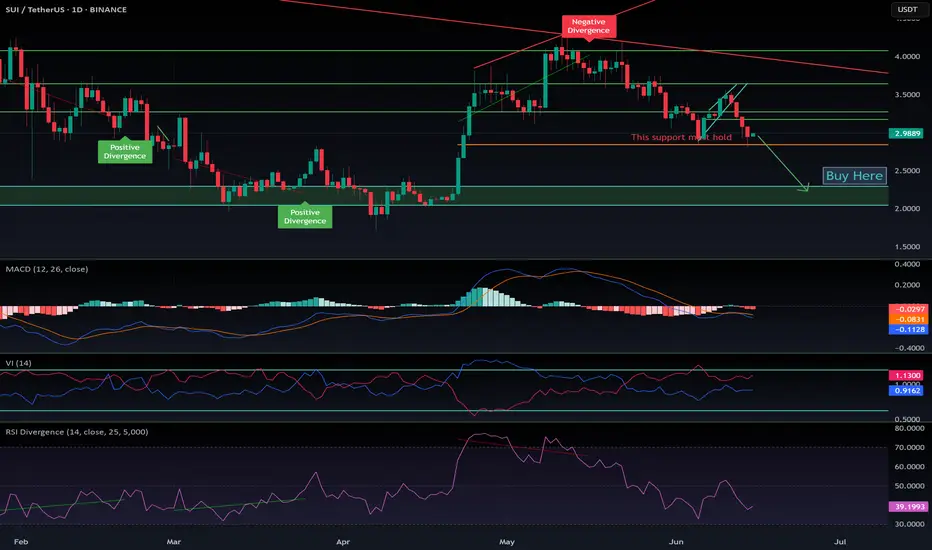
$SUI follow up for June 2025CRYPTOCAP:SUI has tapped my support zone around $2.85, which is currently holding well.
That said, the broader trend remains corrective, and it's likely only a matter of time before this support gives way.
If that happens, we could see a drop into my green buy zone — sitting just below a major order block. A break there might trigger heavy liquidations and a sharp move to the next support level.
I don't expect a deeper crash, as bulls are showing strong activity to defend this area.
If you set buy orders around this zone, a solid bounce could offer attractive profits.
As always, DYOR.
This is a follow up for this idea from May 2025