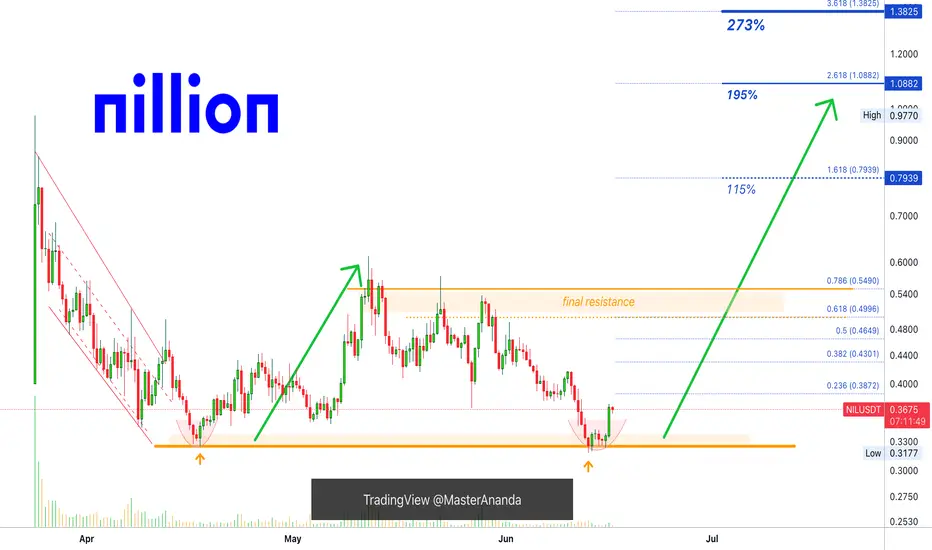
Nillion To Meet Final Resistance To Reach 273% —Trading BasicsNillion hit bottom 13-June but the bottom is only confirmed today with the current bullish breakout.
As the action turns bullish Nillion will grow to face its "final resistance" around $0.55. The good news is that this resistance level will break followed by additional growth.
Within the next 2 months, we have an easy target of 195% profits potential, followed by 273%. These are easy, and this means that NILUSDT will produce even more growth in the ensuing months. We will see an uptrend develop leading to a price discovery phase.
How far up this pair goes is a question mark because it is new, but total growth potential for this bullish cycle is huge. The fact that it is moving early is also good news.
Trading cryptocurrencies can be complex or it can be simplified, I like the simplified version; turn it into a waiting game, truly.
With a chart setup like this one, buy and hold, the market takes care of the rest. That's the waiting game but that's not all... You are waiting but once prices start to grow, you can enjoy the profits as they come. The next step will be to sell to secure a win. You only sell when prices are high, big green. Never sell when prices are low/red. Sell high. Buy low, sell high. Prices are low now.
Thank you for reading.
Namaste.
Altcoins
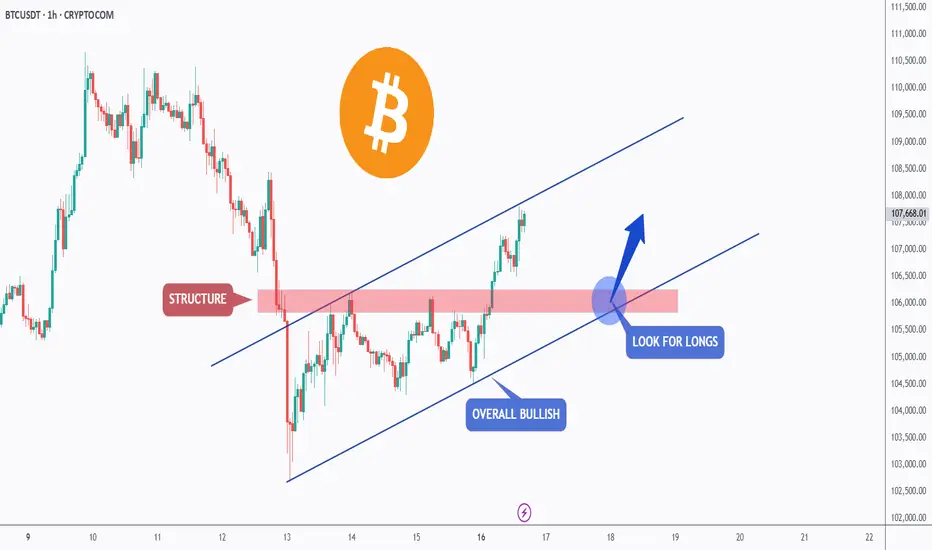
BTC is Bullish!Hello TradingView Family / Fellow Traders. This is Richard, also known as theSignalyst.
📈BTC has been overall bullish trading within the rising channel marked in blue.
Moreover, the red zone is a strong structure!
🏹 Thus, the highlighted blue circle is a strong area to look for buy setups as it is the intersection of structure and lower blue trendline acting as a non-horizontal support.
📚 As per my trading style:
As #BTC approaches the blue circle zone, I will be looking for bullish reversal setups (like a double bottom pattern, trendline break , and so on...)
📚 Always follow your trading plan regarding entry, risk management, and trade management.
Good luck!
All Strategies Are Good; If Managed Properly!
~Rich
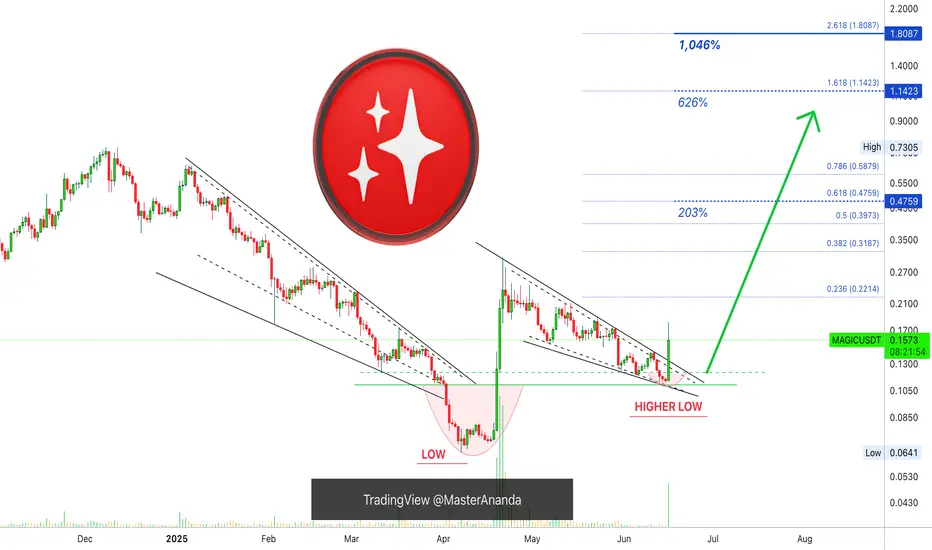
Magic: Higher Low, Falling Wedge & Bullish Continuation (1,046%)It seems like forever, but it is worth it because of the huge potential for growth.
The falling wedge pattern is a classic, we haven't been seeing that many recently and here we have one.
The initial breakout in April only lasted two weeks. MAGICUSDT peaked 21-April and started a long retrace, this retrace as always happens ends in a higher low. The candles formed a falling wedge pattern which can be used as a bullish reversal signal.
As the breakout from the pattern happens today, we can see trading volume going up. The highest volume since April. This high volume confirms this move being real and we can expect additional growth.
The following targets can be hit within 1-3 months. So these are huge numbers watch:
» $1.14 Gives 626%.
» $1.80 Gives 1,046%.
» $0.4759 Gives 203%.
These are great numbers, nice potential for growth. The last target can be hit short-term, within thirty days. It can be less.
Thank you for reading.
Your support is truly appreciated.
I hope we can continue to exchange for the long-term.
You give me attention, and I give you knowledge and great trading opportunities.
Namaste.
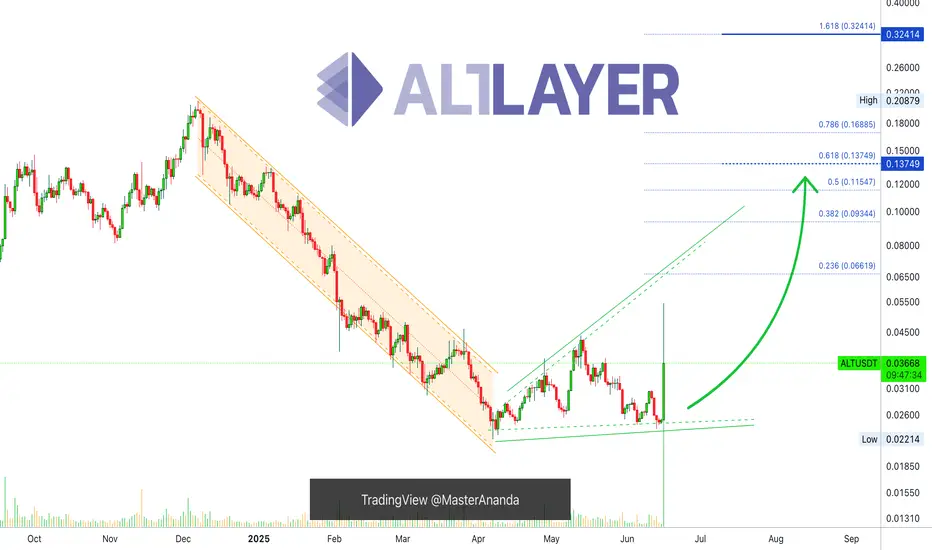
Altcoins Market Bull Market Confirmed, AltLayerThis is just one, another one, but this theme will continue to repeat over and over, again and again.
Here AltLayer is producing a three digits strong bullish breakout; the highest volume ever today and this confirms the start of the 2025 altcoins market bull market.
Total growth amounts to more than 115% in the past few hours. This is similar to what we saw with Ravencoin and Axelar, these projects produced three digits green in a single day and the market is producing a bullish continuation on those, here it will do so as well.
This is only the start, prepare for maximum growth.
If you enjoy the content, consider hitting follow. I will be sharing new altcoins daily for year to come.
Namaste.
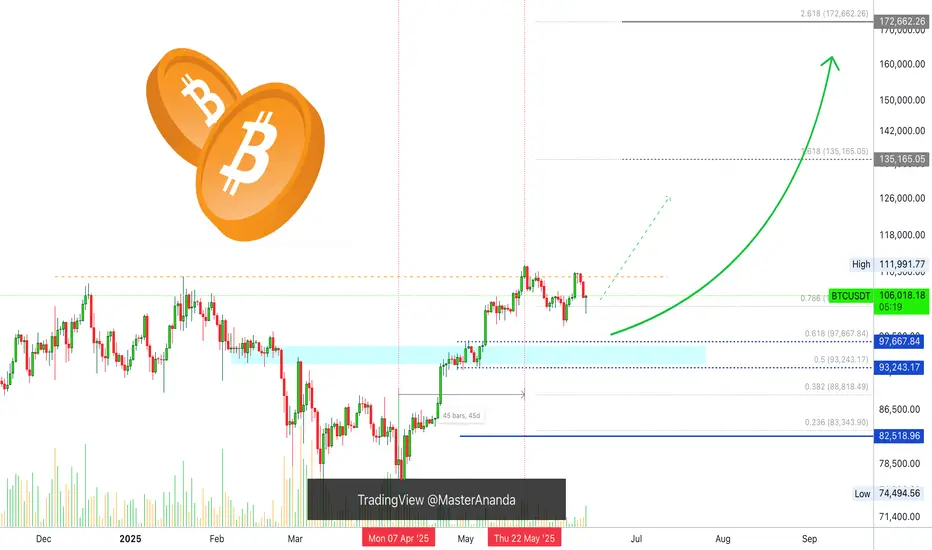
Bitcoin, Good News & Good News —Bullish Confirmed (Retrace Over)First, the good news is that we have a higher low and a strong recovery in place. The current candle has a long lower wick and is already trading green, at the top of the session.
The second good news is how far down the retrace went. Last time Bitcoin bottomed around $100,300, this time the bottom happened at $102,660. This is an early signal of course because the week is not yet over. It can happen that prices move higher today and tomorrow they move back down, crash on Sunday and we get a bearish close. But, looking at short-term price action and other altcoins, also the volume—notice the volume—we can say that the retrace is over and we are set to experience immediately additional growth.
The volume is the most revealing signal right now.
The drop had no volume compared to today. Today's session has more volume than the last three red-days combined.
Another signal to consider is the amount of over-leveraged gamblers that were liquidated, a total of 1 billion dollars. When this much greed is removed from the market, there is no need for lower prices.
I will call it early, the retrace is over. Time to go bullish again.
Thanks a lot for your continued support.
I will show you several more altcoins that are also looking ready to grow.
Namaste.
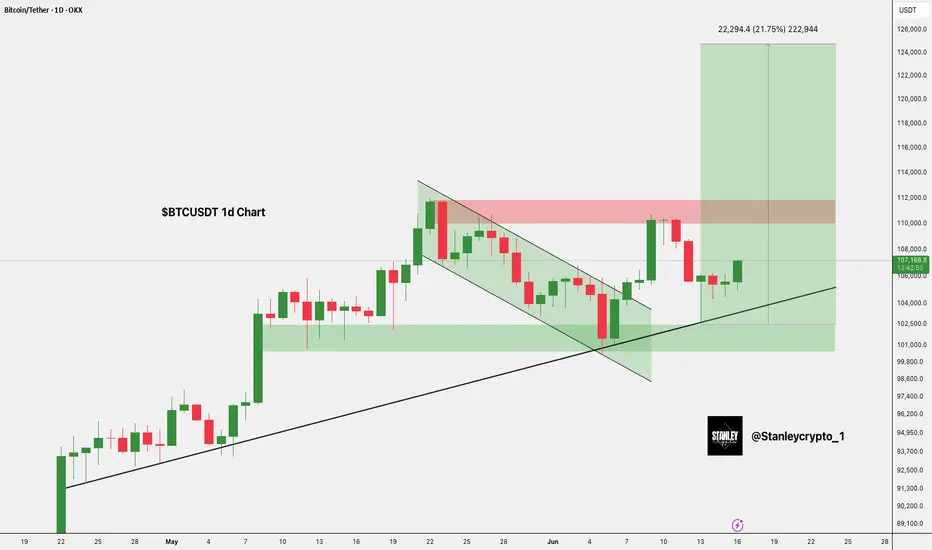
$BTC Breakout Targets $125KCRYPTOCAP:BTC has broken out of a falling wedge and is holding strong above the $103K support zone.
Price is pushing upward toward the key resistance at $110K– $112K.
A breakout above this zone could trigger a move toward $125K.
DYRO, NFA
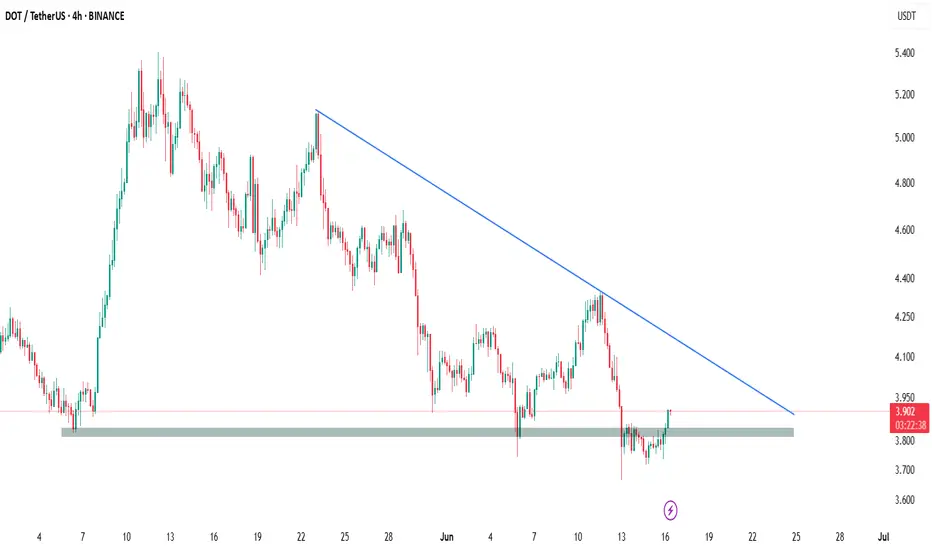
DOT/USDT - Bullish On the 4-hour chart, DOT/USDT has shown a clear bullish rejection from its significant horizontal support zone around $3.80 - $3.85. This strong bounce indicates robust buying interest at this critical level, signaling a potential reversal and a buying opportunity. The price action here underscores the validity of this support, suggesting diminishing selling pressure.
While a descending trendline remains overhead as dynamic resistance, the current rebound sets the stage for a potential challenge to this overhead barrier. A confirmed break above this trendline would further strengthen the bullish outlook. Traders may consider long positions with a prudent stop-loss placed below the $3.80 support to manage risk effectively.
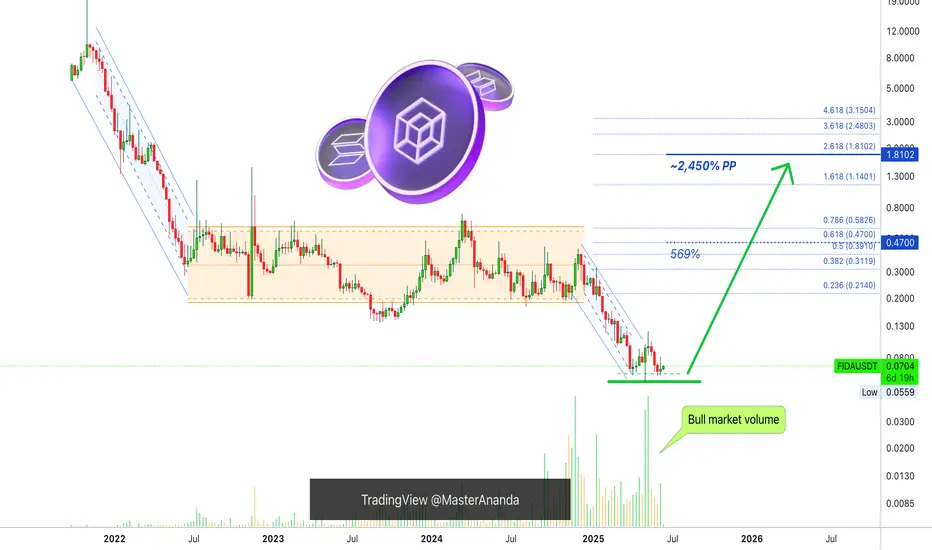
Solana Name Service—Bonfida, Bull Market Volume (2,450% PP)Sometimes just one signal is enough. We have a clear bottom pattern and the highest volume ever. The interesting part is that trading volume started to rise significantly in September 2024, a long time ago. There is lots of interest for this pair.
Solana Name Service—Bonfida—FIDAUSDT is still early, not bullish confirmed.
There is a low in April, then in May and again in June. This chart pattern reveals a bottom. Coupled with the highest volume ever for two consecutive weeks, and you know a strong support level has been established.
Not many people will be able to catch (grab) this bottom. Many people are even allergic to such a strong opportunity. We tend to feel repelled by the market and turn away when prices are low. Only when there is action, strong bullish action and prices are high our interest is piqued.
Ok, things are different today. We are going to fight this force that tells us to move on, and we are going to consider an easy spot trade. We are going to buy and hold. What can go wrong buying LONG when the market hits bottom? Nothing. The worst case scenario is a long-term wait. On the other hand, if the altcoins market turns bullish tomorrow, we can profit from the entire bullish wave. Months and months and months of rising prices. Whenever there is a correction, we don't have to worry our entry is the best possible.
The best possible ever is now for this pair.
FIDAUSDT is set to grow. Bitcoin and the altcoins market will follow. Everything will grow... Just watch!
Thanks a lot for your continued support.
Namaste.
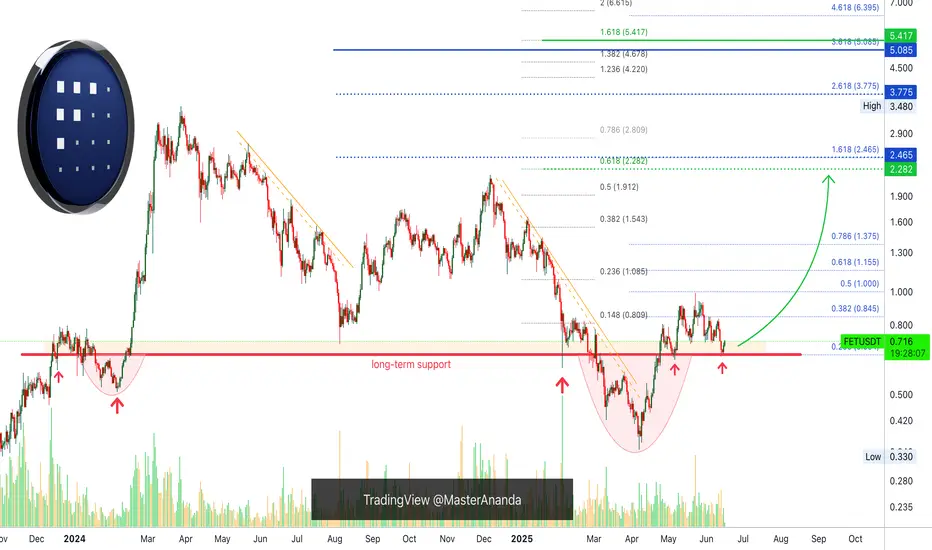
FetchAI New All-Time High —656% Profits Potential MappedSupport here is well defined, it is a long-term situation. Resistance in late 2023 and early 2024; resistance in late April 2025; support in early May and mid-June. This is the red line on the chart.
In early 2024 there was a small rounded bottom pattern below this long-term support line. After resistance was conquered a major bullish wave appeared, more than 400%.
In early to mid-2025 a big rounded bottom pattern appeared below this long-term support line. Below support it is resistance; it has been conquered as resistance and now FETUSDT trades above. This opens the doors for massive growth, really massive.
This chart setup is calling for a new all-time high. You can find several targets mapped on the chart.
» 221% is an easy target, easy profits; high certainty-high probability. This is around $2.30.
» $3.77 is a shy new all-time but I believe this is also high probability. This target gives 426% profits potential.
» The standard 2025 all-time high projection sits around $5.42. From current price, this gives a total of 656%. If we take the same target and use the April bottom as the startup point, we get 1,471%. This would be the total growth of a bullish wave that peaks at $5.42 in late 2025, but there can be more.
Prepare for the best, hope for the best.
The best is yet to come.
Namaste.
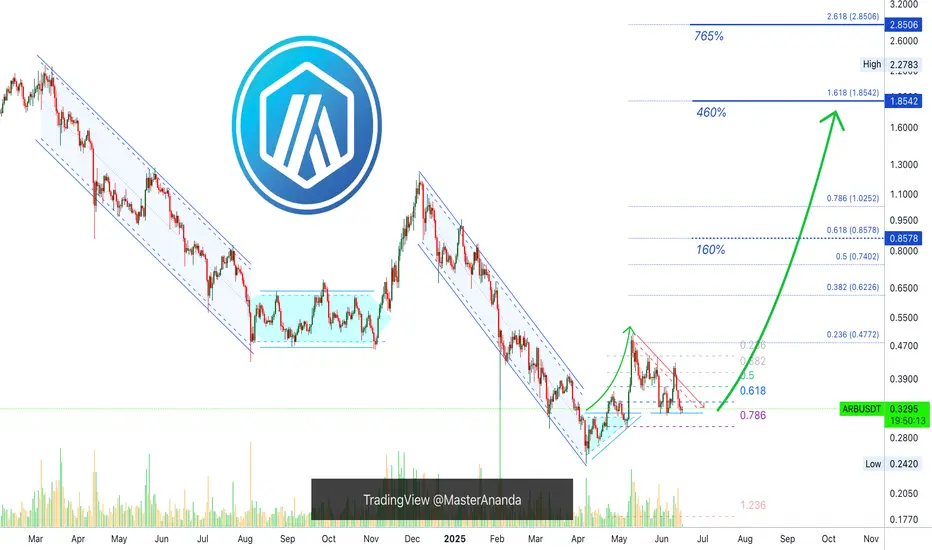
All Signals Positive, Arbitrum: 765% Easy Profits Potential—PPThis is a great pair and chart because the easy target goes beyond 450% profits potential. Another mid-term target can yield 765% in less than 6 months. Likely within 4 months. So this is a great chart setup because there is so much room for growth.
Arbitrum (ARBUSDT): Technical analysis daily timeframe
Arbitrum hit bottom 7-April and produced a small recovery, it grew a little more than 100%. This is the initial bullish breakout, and this move is always followed by a retrace. The retrace is in with a triple bottom above 0.786 fib. retracement and just below 0.618. This is the baseline for the start of the previous jump, resistance turned support. From this point a bullish continuation can develop. This continuation can start within days, say 5-6 days. So, in less than a weeks time, the Altcoins market will be green again.
ARBUSDT is preparing to grow. All chart signals are positive; this is an easy one; buy and hold.
Namaste.
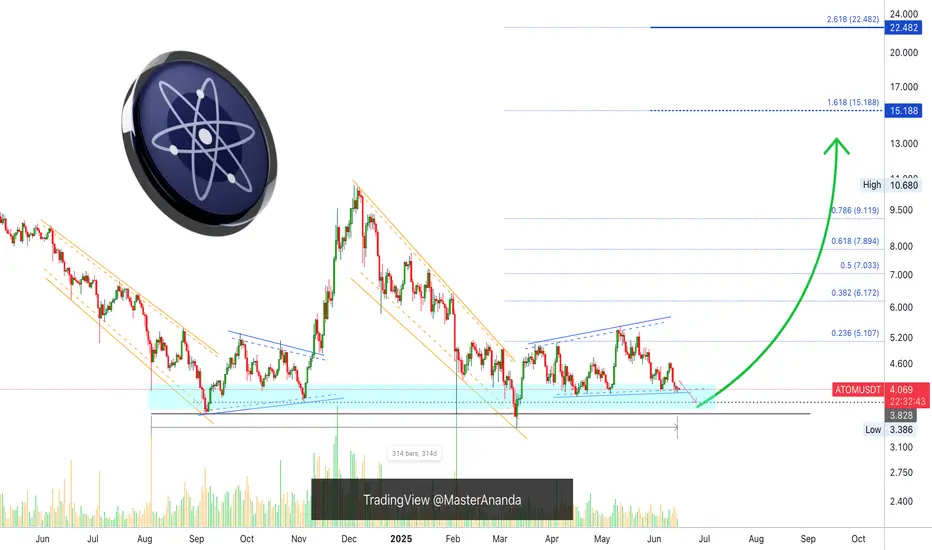
Cosmos (Atom) 11 Months Within Accumulation ZoneThis is a repeating theme and pattern; this is a classic. Cosmos is now sideways after a correction. The correction is preceded by a bullish wave.
The bullish wave in late 2024 was a short-term, it lasted only one month. But what is interesting is the fact that the bottom range is the same now as it was before the last bullish wave.
If you count the period from the September 2024 low until present day, we have more than 280 days. A very long time. If we start counting from August 2024, when the current accumulation zone was activated, this gives us a total of 314 days, more than 10 months. This is truly all that we need to know. The same low holds for almost a year, getting very close.
If ATOMUSDT does not rise within 2 weeks, this would give us a total of 11 months within the same zone. But it doesn't break, each time a low point is activated there is strong buying and this has been happening long-term.
August 2024, September 2024, November 2024. Then again February 2025, March 2025, April, May and the same accumulation zone is still active today.
The whales are accumulating now, this is their buy-range. Once the accumulation phase is over, we will experience a strong bullish phase. Not a small jump as back in late 2024, but an uptrend, higher highs and higher lows.
Ravencoin weekly is a great example. See the 'related publications.'
Thanks a lot for your continued support.
Namaste.
Bitcoin 100K Support Intact, The Bulls Win!Lately we've seen many cries about volume. Where is the volume? There is no volume! Etc. I tend to agree. My excuse in favor of a bullish Bitcoin was to say that low volume as prices moved higher worked as a continuation signal, things change.
We are now looking at BTCUSDT on the Daily timeframe and what I can notice is trading volume being relatively high. The days with high bull (green-buy) volume, are sometimes two to three times higher than the days with bearish (red) volume. This signal seals the deals. The bulls win.
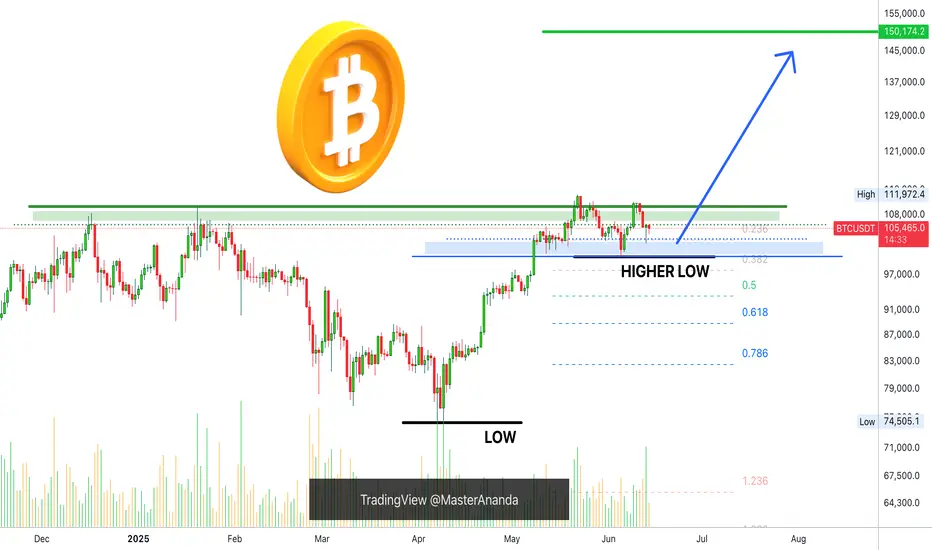
This is a chart drawing that I used in the past. We have the low 7-April low and a higher low 5-June. Very strong bullish action for two months straight; very little retrace, weak bearish action for several weeks, the bulls win again.
The consolidation zone, the accumulation range, is defined here with blue and green, we know the price to be $100,000 and $110,000, Bitcoin trades at the exact middle, above $105,000. Giving the bulls another win.
Yesterday the action produced a higher low compared to 5-June. Even with very bad geopolitical conditions, a surprise war, Bitcoin remains strong. If not even war can break 100K as support, this simply means that Bitcoin isn't going any lower, Bitcoin is going up.
The most revealing part is the fact that Bitcoin didn't even reach 100K. Not in 5-June, not yesterday. 5-June the low was hit at 100,386. Yesterday, the low was 102,656.
There is lots of demand, supply is limited.
People are buying the dip. Whales are buying, institutions are buying; the world wants Bitcoin. Price action says Bitcoin is going up.
We can extract supporting signals from the Altcoins, Ethereum, XRP and Dogecoin are good examples, all the big projects are strong now when we consider the fact they are trading above MA200 daily and weekly, and this confirms a bullish bias with long-term growth.
$150,000 is not the top, Bitcoin is likely to go higher by the end of the next bullish wave. We can consider prices such as $180,000 and $200,000. This is because nobody is selling. Since people are not willing to sell, prices are sure to increase. Many altcoins are now extremely bullish, small and big.
All market conditions are fully aligned, it is only a matter of time.
Patience is key. Prices will rise.
Namaste.
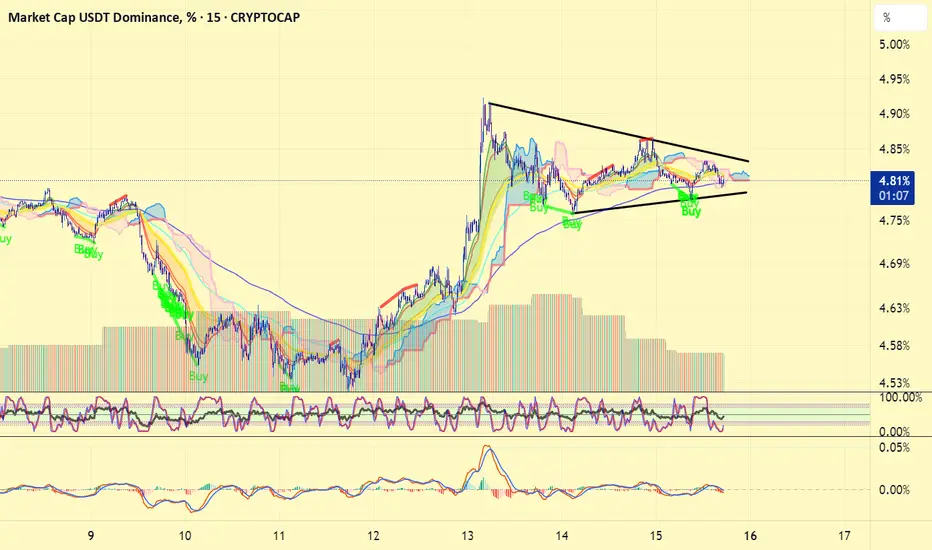
Tether Dominance matters!USDT #tether dominance is forming a bullish flag in lower time chart. If #usdtd manages to breakout, the next wave of correction will hit #bitcoin and #altcoins. If USDT.d loses %4.75 , that will be the invalidation.
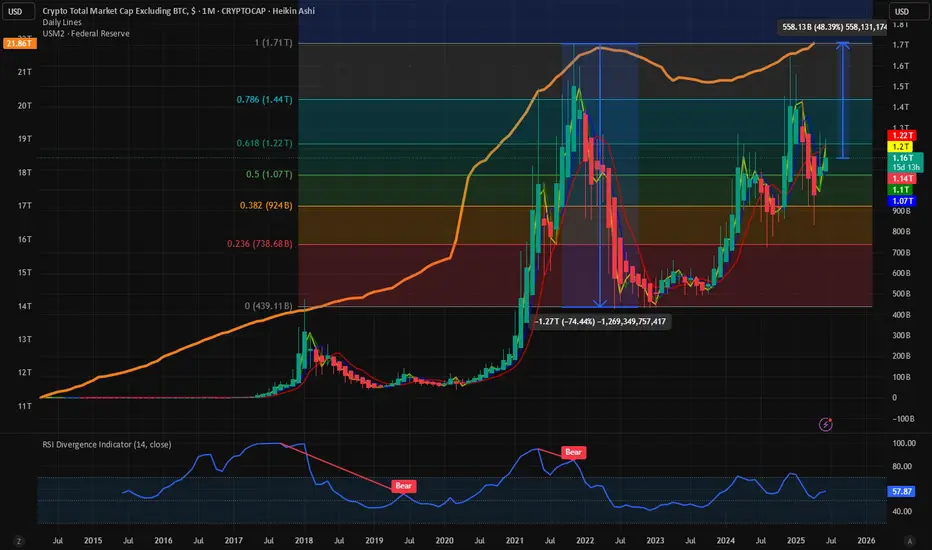
$TOTAL2 and $USM2: Correlation never broken. What now? Today we dive into the world of crypto. We are looking into the recent rally in the Altcoins including CRYPTOCAP:ETH and §Sol and try to understand the reasons behind it and what is means for the future. CRYPTOCAP:TOTAL2 depicts the total market capitalization of all the Altcoins except CRYPTOCAP:BTC but including stable coins. When in doubt, zoom out. Today we are looking at the monthly candle stick charts for the CRYPTOCAP:TOTAL2 vs the $USM2. ECONOMICS:USM2 is the total M2 money supply from all the sources not only the banks but also other forms of cash within the economy. M2 money supply generally goes up and the economy grows and the Govt and Fed Balance sheets grow.
ECONOMICS:USM2 is primarily responsible for the increase in stock and asset prices. Crypto is no exception to it. Whenever the M2 Money supply goes up the Altcoins usually goes up. During the last Crypto cycle, the Altcoins peaked @ 1.7T $ in Nov 2021 and the ECONOMICS:USM2 peaked a few months after that in March 2022 @ 21.71T $. When the ECONOMICS:USM2 fell to 20.66T $ the Altcoins market suffered a bear market and lost 75% of the value. So, the question comes what happens to the CRYPTOCAP:TOTAL2 chart when the M2 money supply is expanding. We have clearly saw a recent surge in the Altcoin market but still below the ATH. Currently CRYPTOCAP:TOTAL2 at 1.16T $ is still below the 0.618 Fib retracement level plotted on the last cycle from top to bottom. Still CRYPTOCAP:TOTAL2 must cover a lot of ground and grow by 50% to reach its previous cycle top. In those cases, the ECONOMICS:USM2 must go up also by 1-2T $ to support such a jump in the $TOTAL2. But what will CRYPTOCAP:BTC do in that case?
Verdict : CRYPTOCAP:TOTAL2 can only go above $1.7T $ if ECONOMICS:USM2 expands by 1-2T $. Watch out for CRYPTOCAP:BTC in that case.
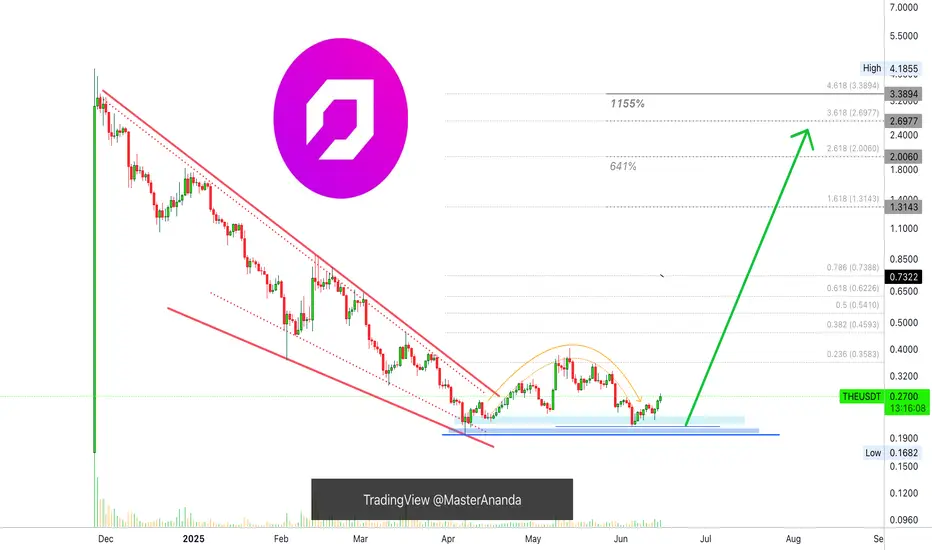
Thena Ready To Move Now! Strong Short- & Long-Term (1,155% PP)I don't like to post the same charts because there are just too many options and we cannot even get close to looking at all those, specially with a limit of only ten post per day. But, with that said, here we have Thena again, THEUSDT, why? Because it is ready to move and a great time-based opportunity only comes around so often.
When it comes to Cryptocurrencies opportunities are endless is true, but some tend to move faster than others and this one looks good. It looks good short-term and has huge potential also long-term. So good on all sides. Risk is very low. We have a classic local higher low and the stage is set, the world is ready; watch it grow.
Nothing is pointing down. Everything is pointing up.
No plan, no strategy, no complexities... Just buy and hold.
Namaste.
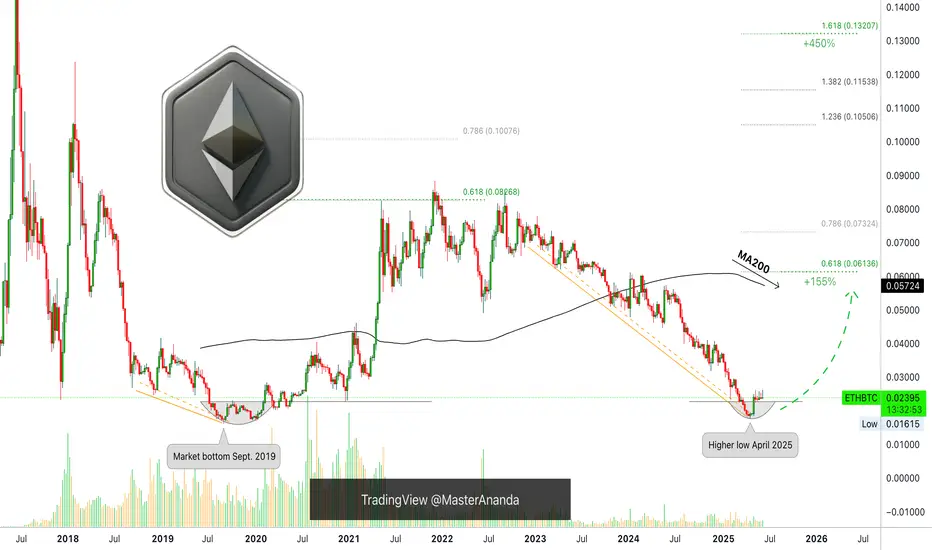
Ethereum vs Bitcoin 450% Growth Potential, Already ConfirmedEthereum is preparing a 155% rise vs Bitcoin, ETHBTC. The bottom is already in and this bullish wave confirmed. The 155% target is the minimum, "back to baseline," and it happens to match MA200 and the 0.618 Fib. extension level.
The main signal is a rounded bottom after a major multiple-years long downtrend. The same signal ETHBTC produced back in September 2019 but smaller in size.
The second signal is not specific to this pair only and relates to the cyclical nature of this market. Every four years, there is a bull market.
» ETHBTC produced a bull market in 2017.
» ETHBTC produced a bull market in 2021.
» ETHBTC will produce a bull market in 2025.
(Due to changing and evolving market conditions, the 2025 bull market can extend into early 2026. Just a possibility.)
This is true also for the small and medium cap. altcoins that are yet to grow. Strong projects such as Bitcoin and many big altcoins have been bullish for very long. These are on a league of their own. They cannot wait for the end of 2025 to produce a bull market because they have too much too strong demand and so they have been growing for years on end. The other part of the market, the neglected part, is about to go nuts. Extremely bullish in short.
This is a friendly reminder, load up and hold.
You will be happy with the results.
Prepare yourself to wait for months. On the safe side, 6-8 months. That would be minimum. The longer you are prepared to wait, the better it is for your mental state. There is no way to go wrong with Crypto unless you are doing leveraged trades. If you want to have certain profits, choose reputable projects through spot, and watch your money grow. Focused always on the long-term of course.
Namaste.
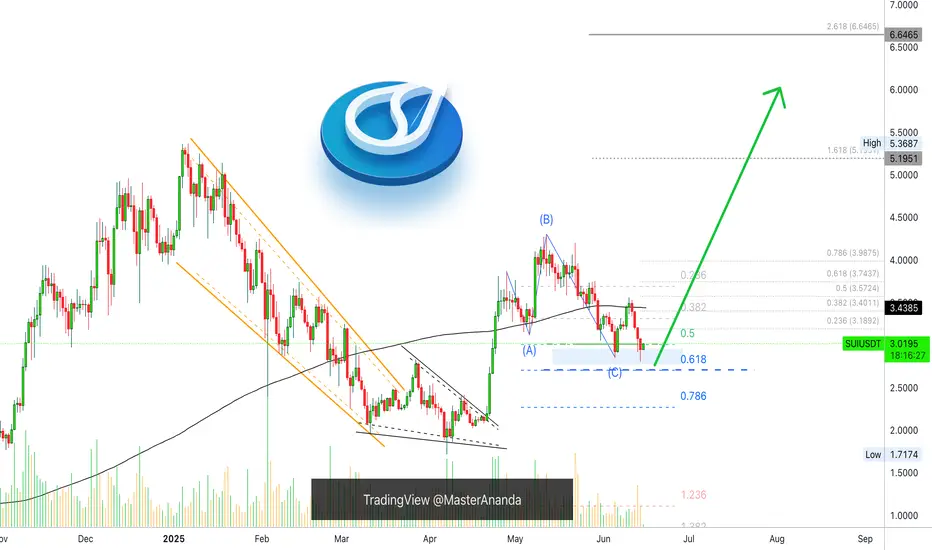
Sui Update, Retest of Support; Bullish ConfirmedIt's been 9 days since my last Sui update. The chart looks good.
For context, see the previous analysis:
We started at the C wave of an ABC correction. There was an attempt to push prices higher but resistance was found at MA200. The resistance produced retrace and the same support zone is tested and holds. If a new advance develops here, which is exactly what is going to happen, then you can expect much higher prices next. This time around, MA200 as resistance will break, which means a new high. The highest prices in more than six months, since January 2025.
This is where the next move will take us and this is easy to predict now that support has gone through a retest and holds.
Namaste.
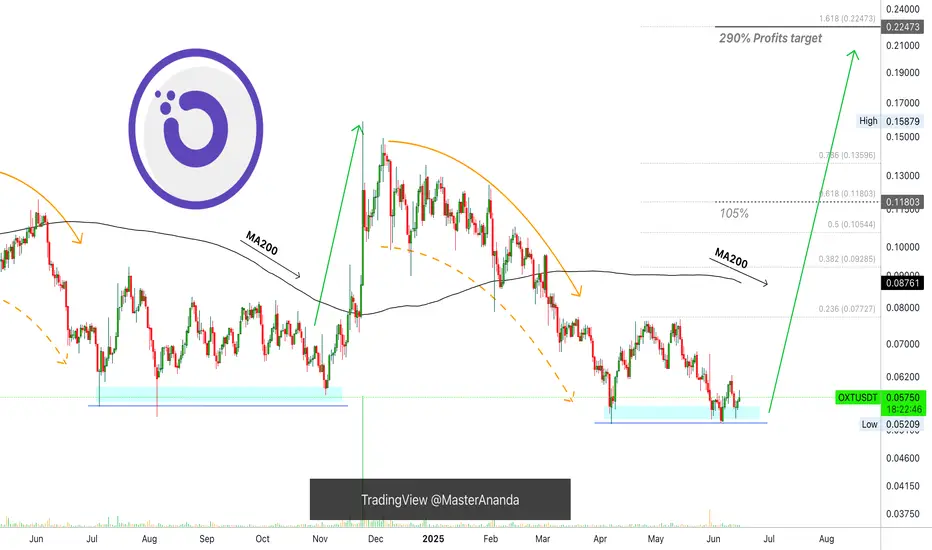
Orchid 290% Profits Target, MA200 & Price Action FractalThe classic signals are already present on this chart, the double-bottom, etc. But I also have a price action fractal plus an unconventional signal supporting a bullish jump.
The easy target here is 290%, it can be hit within months. Not more than two to be more exact after the bullish breakout is confirmed. Long-term there can be more growth.
The price action fractal is a 1,2,3 sequence. A correction leads to a low that leads to sideways and then a bullish breakout. (1) The correction, (2) then consolidation and finally (3) the bullish breakout.
The unconventional signal revolves around MA200. When MA200 starts to curve down prices tend to shoot up. Right now this indicator only has a tiny curve but this is the start.
If you look at the action around September 2024, MA200 started to curve down. Prices continued sideways for more then a month but eventually a bullish jump developed. It always happens when MA200 starts to curve down. As it goes down, prices go up.
This is another signal that can be used to spot a trend reversal.
Thanks a lot for your continued support.
Namaste.
Ravencoin Bullish Continuation, Altcoins Bull Market ConfirmedRavencoin produced a major bullish breakout, we've seen many of those. It happens that you get one of these breakouts but the following week bullish action is dead. That was all, end of story. This isn't the case here and this is truly great news.
First, Ravencoin produced some of the biggest volume ever, only once was there a week with higher volume and the volume in the last two weeks is higher even than in the 2021 bull market. This clearly reveals the start of the next bullish phase, at least for this pair, but never in the history of Crypto has this project or any other gone on a bull market on its own, not in 2021 and not in 2025. What one does, the rest follows.
So we have a bullish continuation. Really high volume to break above EMA34 followed by additional growth. We can expect this trend to continue. These weekly candles are the biggest since 2021.
Get ready, because the same will happen across hundreds of altcoins.
Here is the daily timeframe:
Two days red and it is clear that this project is creating a new uptrend... Thank you for reading.
Namaste.

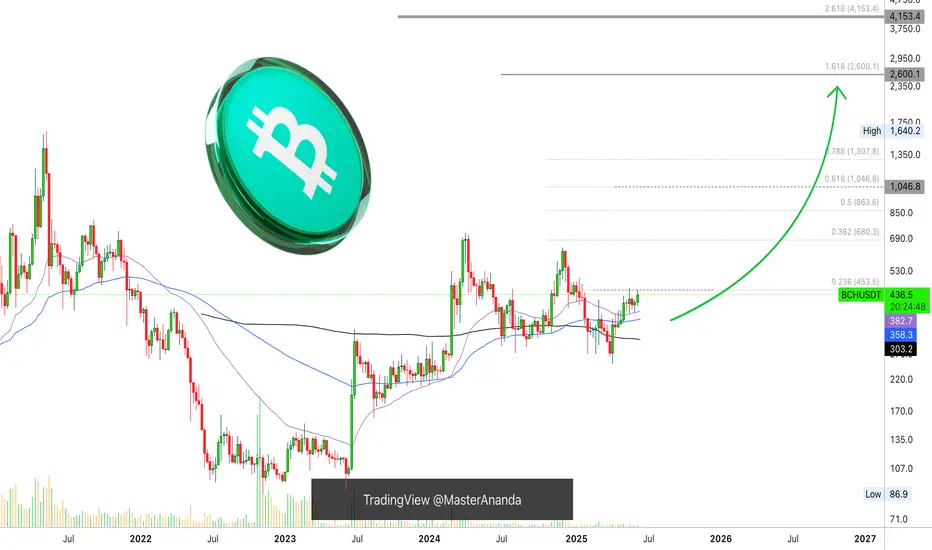
Bitcoin Cash Weekly Update, Moving Averages & Bullish PotentialI already looked at Bitcoin Cash recently, this time I want to see how the moving averages are doing here to compare with the other Crypto-projects. Good news for one pair is good news for other projects as well specially when they are in the same category. Bitcoin Cash is one of the big projects.
Here we can see BCHUSDT trading weekly above EMA34, EMA89 and MA200, while rising.
Resistance was found at $453, a fib. extension level. Once this level is broken as resistance you can expect a swift advance toward $680. It will be nice and easy. This is the last barrier and current price action is kind of mix.
It is good because this week trades at the highest since November 2024 coming from a low. It is bad because it is lower compared to 19-May on the wick but the week is yet to close.
A weekly close above $420 is highly desirable and favors the bulls, anything lower and we continue with a mixed situation. Make no mistake, the situation is mixed only short-term. The chart shows a clear bullish bias and there will be additional growth in the coming weeks and months. Only the short-term is questionable.
Bitcoin Cash, Bitcoin and the entire Cryptocurrency market is set to grow.
Thanks a lot for your continued support.
Namaste.
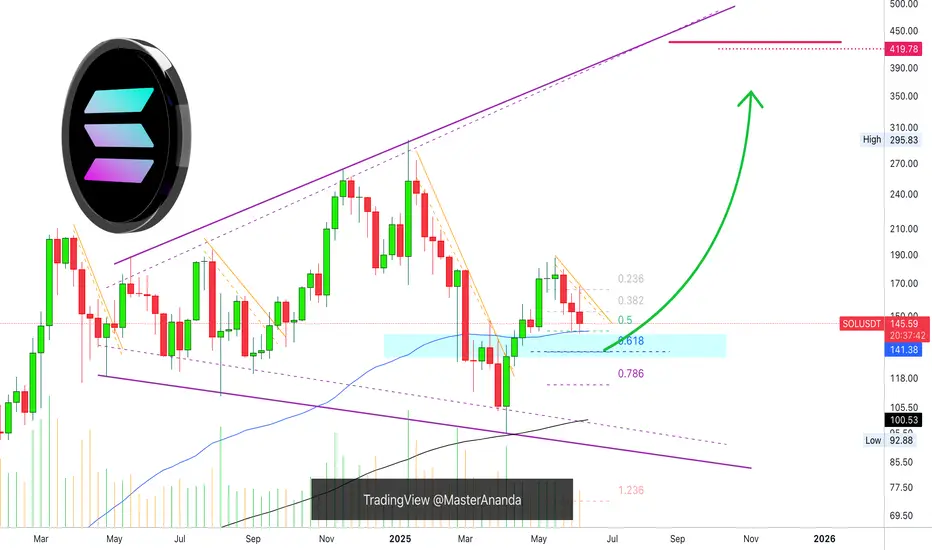
Solana Weekly TF, Good NewsI've gone deeper into Solana's chart and I have good news... You are looking at the weekly timeframe.
I looked at EMA34 and MA200 for some of the major Crypto projects, Bitcoin, Dogecoin, XRP, Cardano and Ethereum. You can find these in my profile @MasterAnanda.
Some were clearly bullish as the action was happening above both moving averages, others were mixed and one was bearish.
Solana is trading below EMA34 weekly but safely above MA200.
MA200 weekly sits at $100 for SOLUSDT.
There is another level of relevance, EMA89. On this chart shown as a blue line and this is the good news. EMA89 is working as support, it worked last week and this week it still holds. This same level matches perfectly the 0.5 Fib. retracement support relative to the move from 7-April to 19-May.
This is all to say that we are looking at a strong support zone, which means that it is likely to hold. If it breaks, it should be brief followed by a recovery right away.
Namaste.
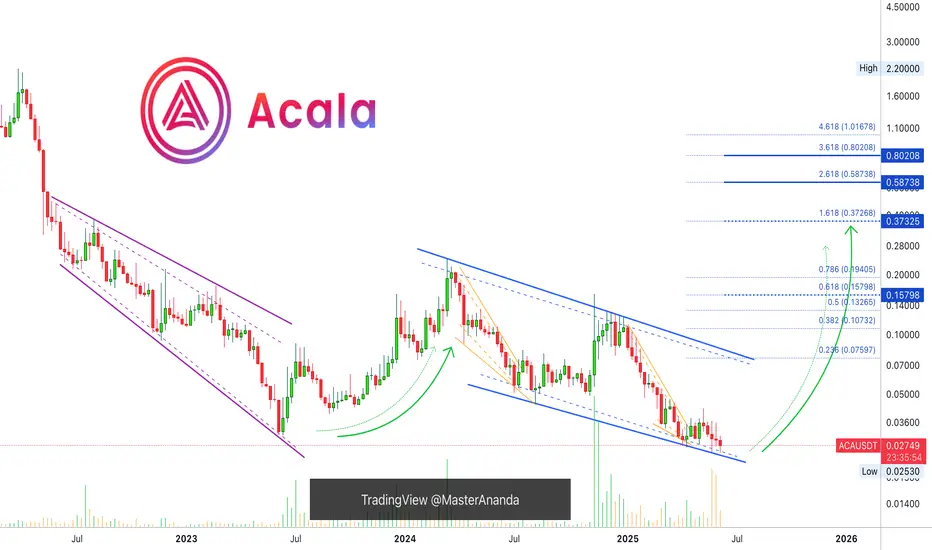
Acala Hits Bottom, Which Means Bull Market Next (2800-3500% PP)Acala is now five weeks into the fire. If you read often you will understand clearly what I mean; if you are new, this might not make much sense.
The low happened 14-April here, ACAUSDT. Some weak action and then red. Five weeks red and the action remains relatively sideways, not much change in price.
Current price trades above the 14-April low. The 14-April low was 0.02698. Current price is higher. Five weeks red, high bearish volume and yet, no new major lows.
Notice the drop from early December 2024 until April 2025. Five weeks red can cover a huge distance, there can be a strong decline. When you see five weeks red but no change in price, this is a bullish signal. It means that the bears have no strength. It means we are not seeing a bearish trend nor a bearish impulse, instead, a retrace and stop-loss hunt. Since bearish pressure is non-existent and after weeks of selling prices aren't going any lower, we can predict change soon.
This change is bullish. The bullish signal comes from the fact that the bearish action is just too weak. It is like seeing prices trading near resistance (say a new all-time high) for weeks, months with no advance. This would reveal that the top is in and a crash comes next. In this case, the bottom is in and a bull market will follow.
Thank you for reading.
Namaste.
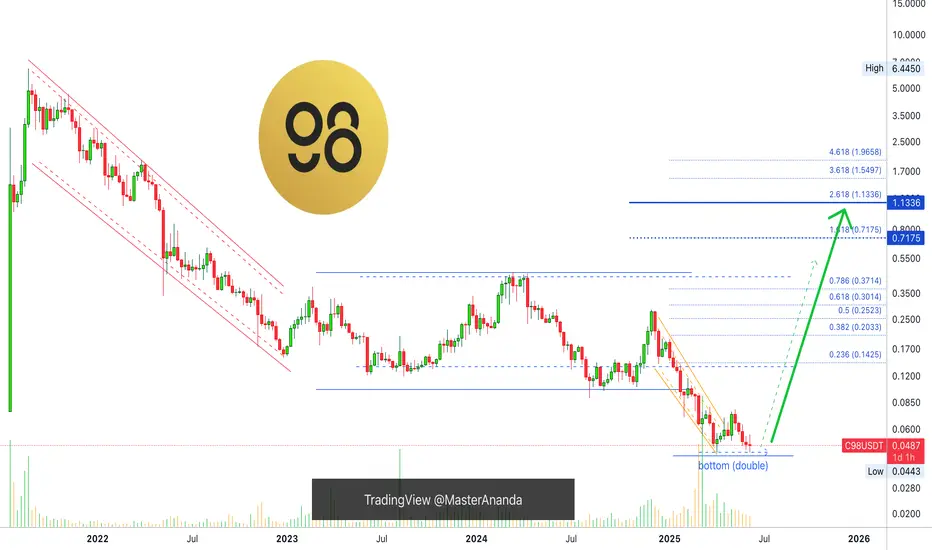
C98 Hits Bottom, More Than 3,333% Growth PotentialHere C98 breaks the pattern, a channel breakdown after going sideways for years. This is the liquidity hunt event. Two signals reveal that this drop is the bottom and precedes a change of trend.
1) The highest volume ever and since 2021 came in March as C98USDT looked for a new low.
2) We have a double-bottom.
The bullish action will start without warning, Boom!, 100-200% up. Then it will continue with full force, month after month after month of a rising market, see the green arrow. We are now very close.
That's all there is. Once you hit bottom, there is no other place left to go but up. Nothing, nada, nichts, niente, rien. Only up is possible now and that's where we are headed next.
Buy and hold. Growth potential goes between 2,500% and 3,900%.
Namaste.