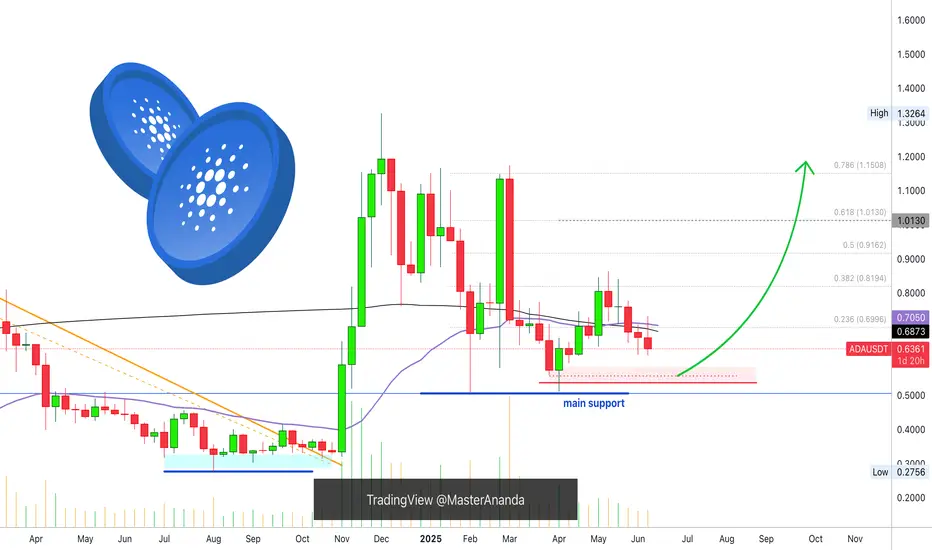
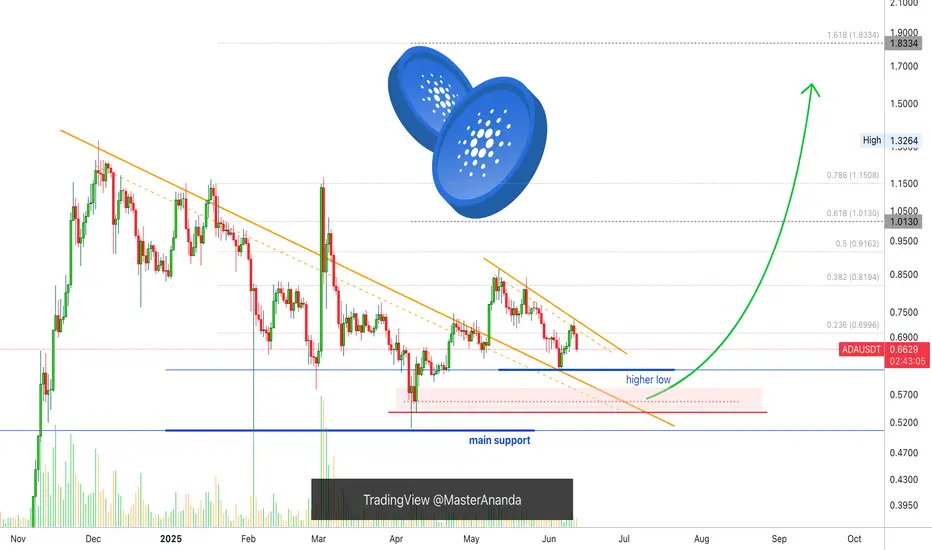
Cardano Weekly, UpdateCardano weekly doesn't look as good as XRP and Ethereum, this is true because I am using the same indicators.
Here we can see ADAUSDT trading below EMA34 and MA200. We can even see an attempt this week to move higher followed by a rejection, this means that there can be some more bearish action before higher prices but this bearish action can easily happen short-term. Why? Because Cardano has already been dropping for five weeks straight.
The rise from the 7-April low lasted a total of six weeks. The week that produced the peak is also the first week of lower prices. So we can say 6 weeks up and four weeks down, or, five weeks up and five weeks down.
The thing is that the market seeks balance and this retrace is already big enough and has been going long enough. Yes, the action is happening below these moving averages but this can easily change.
Short-term bearish.
» ADAUSDT will continue bearish as long as it trades weekly below the $0.7050 - $0.6875 price range. When ADAUSDT moves and closes above this range, the bullish bias is confirmed. Any trading below and we wait.
Thank you for reading.
Your support is appreciated.
Namaste.
Altcoins
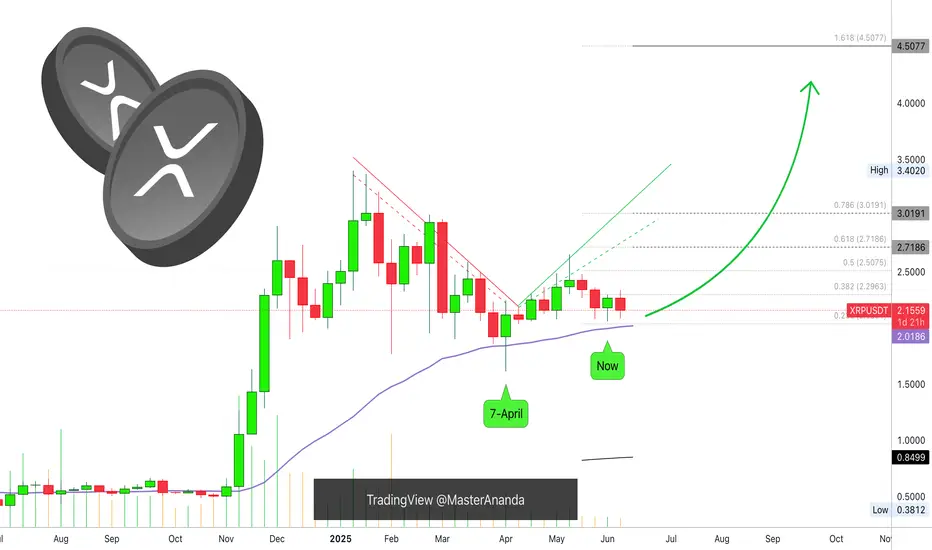
XRP Weekly UpdateThe line on the chart stands for EMA34. Notice two things about this level: 1) It was challenged 7-April but the action closed above. 2) The action "now" remains above this level but it has not been tested again, this is a bullish signal.
When it comes to the weekly timeframe, long-term, XRPUSDT continues bullish, with a bullish bias aiming higher. What we are seeing now is consolidation, accumulation, nothing changes and we can expect more growth.
Yes, the market shakes a little bit but this is the classic short-term noise. Zoom out, what do you see? You see just a few candles, red and green, but no change at all. The market is advancing to the side, after this side-advance, it will advance up; a bullish jump.
EMA34 sits at $2.01. We are strongly bullish above this level. We can expect growth in matter of weeks. Can be 1-3 weeks but it can also happen within days.
The retrace was small, consolidation has been going long enough. We are ready to start the next bullish wave.
Namaste.
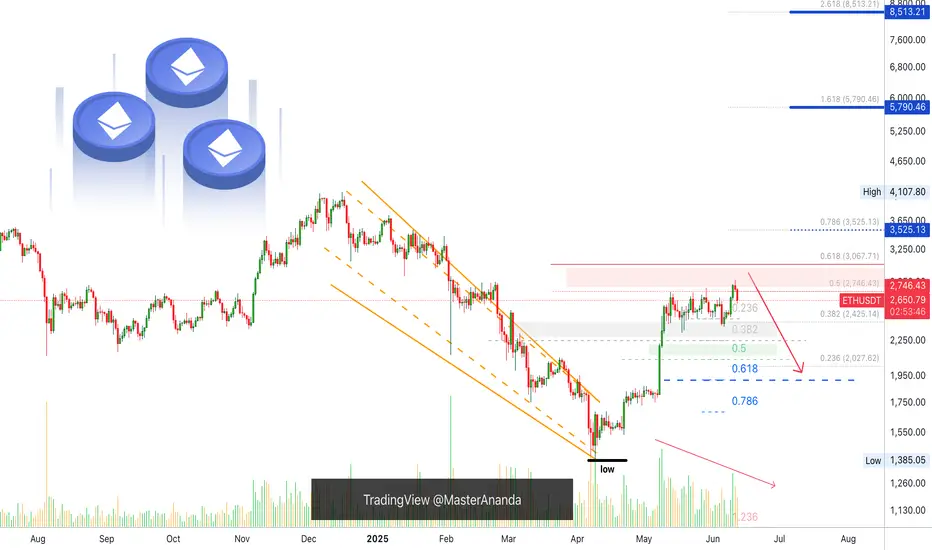
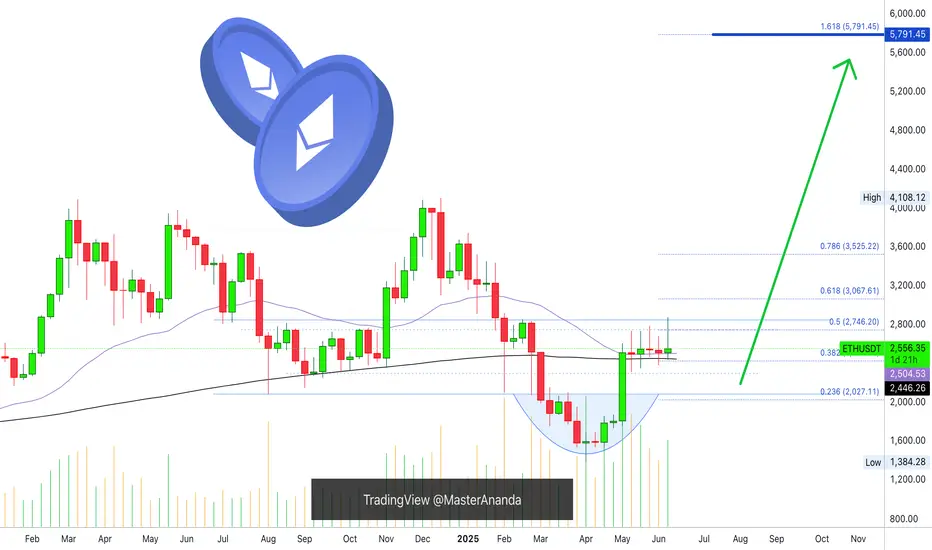
Ethereum Weekly: Bullish & Bearish ExplainedEthereum has been sideways five weeks straight. Market conditions here are bullish and bearish short-term. Let me explain.
The market has bearish potential because of resistance. Ethereum has been facing resistance and fails to move forward for more than one month, but the bias isn't bearish, this is just a potential based on short-term price action.
The market has bullish potential because of a strong recovery after the 7-April low; because it trades above the August 2024 low and because there is very little retrace since the 5-May break of resistance in the form of EMA34 and MA200.
Ethereum is bullish because it trades above MA200 and remains above this level.
We are seeing bullish consolidation. There was an advance recently and after this advance the market went sideways. This means bullish.
While there can be a retrace short-term, market conditions remain bullish for this pair; ETHUSDT.
The bulls have the upper-hand and the majority of signals are bullish. Ethereum will continue to grow.
There is no scenario where Ethereum moves and closes weekly below its 3-Feb and 24-Feb lows ($2,075). It is simply consolidating before additional growth. It is going to go up, sooner rather than later.
Thanks a lot for your continued support.
Namaste.
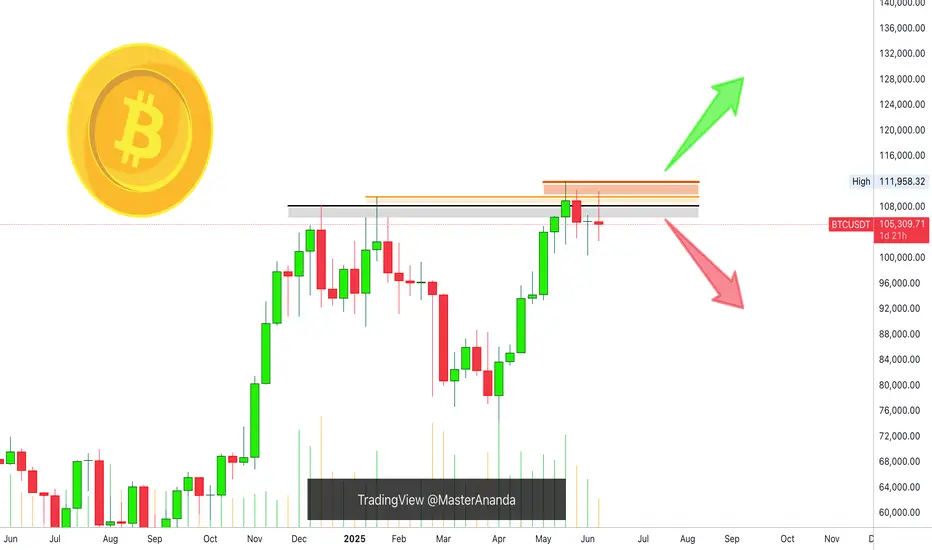
Bitcoin Weekly: Bullish & Bearish ScenariosThis is the definitive analysis based on the weekly timeframe. Depending on how the weekly session closes the market trend will be defined. Bitcoin is both bearish and bullish. Let me explain.
» If Bitcoin can move and close weekly above $110,000, market conditions are considered bullish and we can expect higher prices.
» If Bitcoin moves and closes weekly below $100,000, market conditions are considered bearish and we can expect lower prices.
» Any trading between $100,000 and $110,000 can be considered consolidation. Since the main move is an advance starting 7-April, the consolidation has a bullish bias; makes sense?
It is a bullish bias but a bullish continuation is not confirmed. Bitcoin peaked the 19-May week, a new all-time high. Then it produced a lower high this week. This implies bearish potential and bearish pressure.
» If this week closes above last weeks high, around $107,000, we can say the bulls are gaining ground.
» If this week closes at the open or lower, say $105,000 or lower, then the bears are gaining the upper-hand a lower low becomes more likely.
It has not been decided, anything goes. Anything can happen because Bitcoin will not die, trading won't end if prices move below 100K. This would simply lead to a bounce and a recovery later down the road.
It also works in reverse, if Bitcoin moves higher, nothing happens, the market will continue to be and exist, it will continue to grow and evolve.
Right now we are mixed, this is a decision point. The action is determined by the price, depending on what prices we get we can know what comes next. Since the week is yet to close, we remain in doubt but the bearish bias has the upper-hand short-term.
Short-term bearish potential is strong based on the ath, triple-top and lower high.
Mid-term the market is in a bullish trend facing resistance. The wave from 7-April through present day.
Retraces and corrections are normal.
Long-term Bitcoin is bullish, because it has been growing since November 2022.
Thank you for reading.
👉 If you would like to see an update when the week closes hit boost!
Namaste.
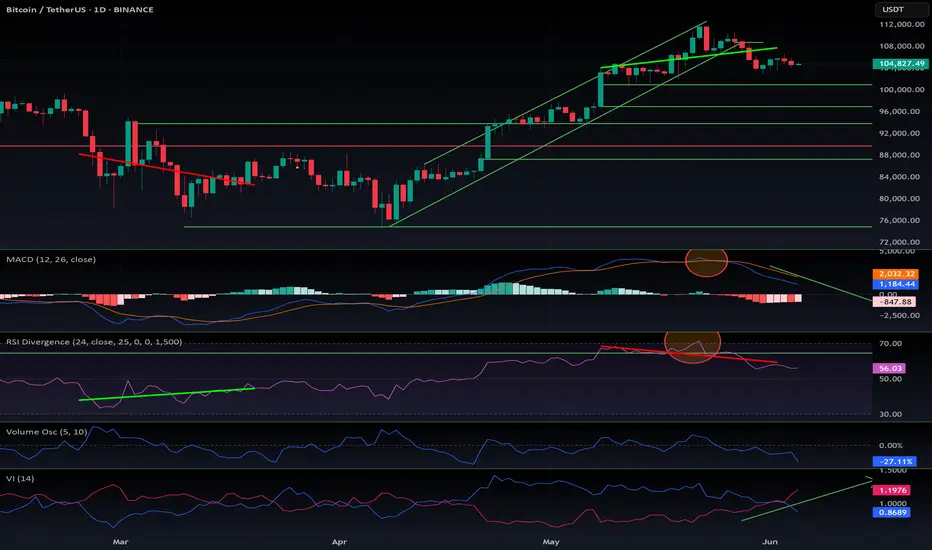
Altcoins: Warning. Check this chart!On the weekly timeframe, I’ve noticed a striking similarity between the 2021 cycle and the current one.
Take a close look at the chart—once you see it, you can’t unsee it.
Are we at the same point we were in March 2022?
The MACD is nearly identical
The RSI mirrors the same pattern
The Vortex Indicator stands at a critical crossroad
The only difference: trading volume is significantly higher
This setup resembles a potential triple top formation. If it confirms, it could completely contradict the bullish forecast I’ve held for months—or it might just be a fakeout.
We're at a decision point for altcoins: either the altseason kicks off in September and invalidates this bearish pattern, or we're headed toward a dot-com-style crash for most altcoins—excluding the top 10.
Keep a close watch on $OTHERS. History tends to repeat—let’s hope not this time.
DYOR
#Crypto #Altseason #BTC #CryptoAnalysis #MACD #RSI #BitcoinDominance #Altcoins #TradingView #TripleTop #CryptoCrash #Blockchain #CryptoCycle #MarketAnalysis

Sell Bitcoin and buy Altcoins!🚨 Controversial Take Ahead – Packed With High-Value Insights 🚨
Let’s dive deep.
👨💻 A bit about me:
I’ve been riding the tech wave since the beginning:
Programmed video games in the 80s and 90s
Built VSTi plugins in the early 2000s
Started creating websites when Internet Explorer 1.0 launched
Sold 3D assets when Unity 2.5 (first PC version) dropped
Launched my own blockchain in 2016
Deployed smart contracts on TRON in 2018
I don’t follow trends—I predict them. My instincts are backed by decades of hands-on experience.
Now, here’s what I see coming:
⚠️ 1. Sell Your Bitcoins
Yes, Bitcoin is obsolete. It’s a technology—not a precious metal—and like all tech, it must evolve or die.
Ask yourself:
Do you use a Blackberry today?
Still flying in 1930s planes?
Gaming on an Atari or Commodore 64?
Surfing the web with Lycos or Altavista?
No? Then why are you betting on a 2009 technology?
Most people don’t even understand how Bitcoin works—ask around what SHA256 or RSA means.
Crypto is misunderstood, and that’s dangerous.
Back in 1998, I created the UPL library, which handled data compression & encryption using all major algorithms—Huffman, LZSS, DES, RSA, etc. I’m not just throwing words around—I’ve built this stuff.
Politicians and financial institutions (yes, even Saylor) are 15 years late to Bitcoin. They're missing the truth: BTC’s upgrades failed (Ordinals, Runes, etc). Its value holds due to FOMO from the uninformed, not innovation.
One day, your Bitcoins will be as worthless as mp3.com stock. That’s not opinion—that’s technological reality.
🪙 2. Buy Altcoins
Not every altcoin is a winner—but that’s where the real opportunity is.
Remember:
Nokia and Blackberry ruled before Samsung and Xiaomi.
The next Amazon, Google, or Nvidia already exists—and it's trading for pennies.
When people laugh at altcoins, that’s the time to buy low.
Altcoins like CRYPTOCAP:SOL , CRYPTOCAP:SUI , MIL:UNI could 100x… even 100,000x.
Bitcoin might double—and then crash.
Smart traders buy when everyone else is mocking.
🌍 3. Consequences of the BTC Collapse
This collapse will come at a turning point in global power.
Wall Street and U.S. states are heavily exposed to BTC. If it crashes, the Western financial system could implode—a dot-com-level disaster.
China, on the other hand, is stable, adaptive, and tech-forward.
Crypto without staking, DeFi, NFTs, GameFi, smart contracts? That’s not the future—that’s Bitcoin. Altcoins are the future.
Bookmark this post. Re-read it in 10 years.
You’ll remember I said it first: Innovation is unstoppable.
Enjoy the last Bitcoin pump. Then watch what comes next.
DYOR.
#CryptoRevolution #AltcoinSeason #BitcoinCollapse #Web3Future #BlockchainInnovation #SellBitcoin #BuyAltcoins #CryptoTruth #DeFi #GameFi #SmartContracts #CryptoShift #UnstoppableInnovation
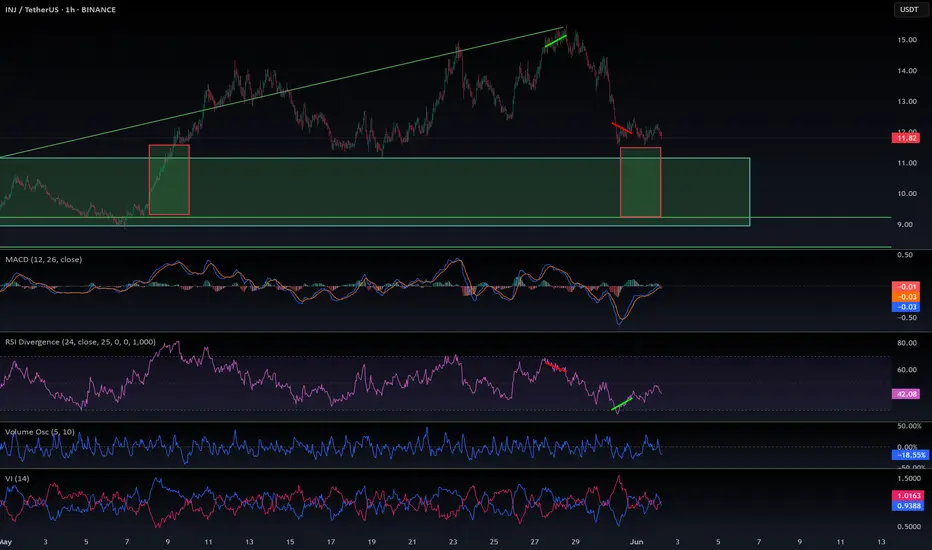
$INJ to re-enter my buy zone? $11.12 must hold!Altcoins are experiencing another pullback.
CRYPTOCAP:INJ had a solid pump recently, but it’s now facing a significant drop.
This could be a good buying opportunity — assuming we’re not entering a bear market.
Key level: $11.12 must hold.
If it breaks, the next major support is around $9.10.
While the macro trend remains bullish, this retracement is concerning.
Set your stop losses accordingly.
DYOR.
#INJ #Altcoins #CryptoTrading #MarketUpdate #CryptoAlert #BuyTheDip #DYOR
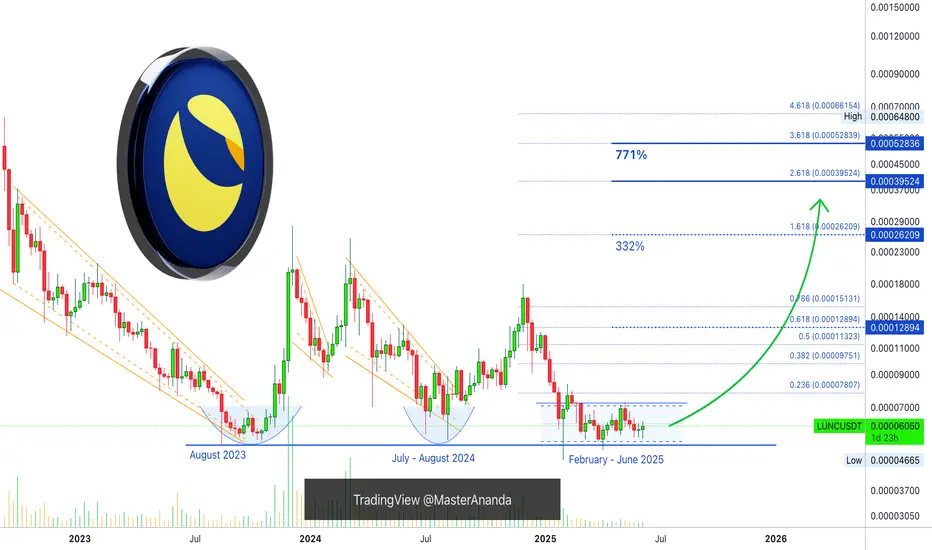
Terra Luna Classic LT Double-Bottom & 771% Potential ProfitsYou can say it is a long-term (LT) triple-bottom when taking into consideration the July-August 2024 support.
Terra Luna Classic (LUNC) has been reacting at the same level for years. Each time this strong support range gets challenged, what follows is a bullish wave.
» August 2023 marked the bottom of the bear market. And this produced a bullish wave.
» July-August 2024 marked the bottom of a correction and this produced a new period of growth.
» February-June 2025 is the present low and this too marks a market bottom, from this point on we will see so much growth. This support level is already confirmed and the action has been turning bullish. Here is what I mean.
A low in February 2025, a higher low in April and now a new higher low in June. LUNC has been growing from its base. This reveals what comes next.
When the market is bearish, these lows become lower and lower, by a significant amount. Instead, there is no bearish momentum, no bearish force, in fact, the bearish wave is over, we are seeing accumulation, four months of accumulation before a new wave of growth.
Hundreds of percentages of points up follow next. The chart shows 771% profits potential but there will be more, likely to be much more. This is the best time to buy, when prices are low. Comeback to this publication and see the results in October or November 2025. You will see the difference in price. Right now LUNCUSDT is trading at 0.00006066. In 4-6 months, prices will be many times higher. Wait and see.
Namaste.
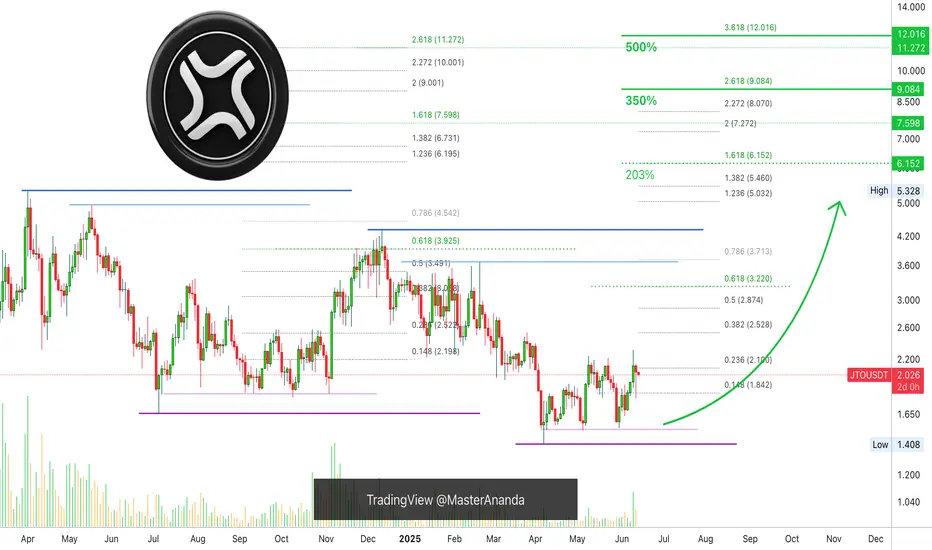
JITO Long-Term Accumulation Phase, Whales, Exchanges & 500% PPThe same market conditions prevail on this chart as with many other altcoins. The low is in. The low has been in for months, since 7-April 2025.
The advance has been happening very slowly and this is good. There will be a point where everything is up "out of the blue." No blue here, no surprise. When you see everything goes up 300% or 500% in a matter of weeks, remember that first the market was sideways for months.
This sideways period is the consolidation-accumulation phase and this phase is when the bulls amass strength. Whales are loading. It takes a while because liquidity is not strong on these pairs so it takes months and months for the whales to be able to inject hundreds of millions into the market. If all the money was injected in a matter of days or weeks, it would be chaos, that's why it takes time for a bullish wave to develop.
This phase can last anywhere between 3-6 months. Some pairs already moved ahead and produced some growth. This growth is corrected, it is just like saying, "Hey calm down, not so fast..." And the exchanges put selling pressure on the market to reduce prices so the whales have more time to accumulate. Retail is always anxious, whales are always patient.
Accumulation can only go for so long. It is like a pressure cooker. Pressure builds up and boom! There needs to be a release, the release here is experienced as a very strong wave of growth.
To be honest, the story is irrelevant, only one thing is relevant if you are here for profits, to make money, to trade; Buy when prices are low and hold. Wait patiently for prices to grow. Sell when prices are high.
Only one thing matters, entry prices and timing.
If you get the right price and the right timing, you will do great. We are witnessing a long-term accumulation phase. It is reaching its end.
Cryptocurrency will grow.
The Altcoins will grow.
Bitcoin is already too strong.
Patience is key.
Thanks a lot for your continued support.
Namaste.
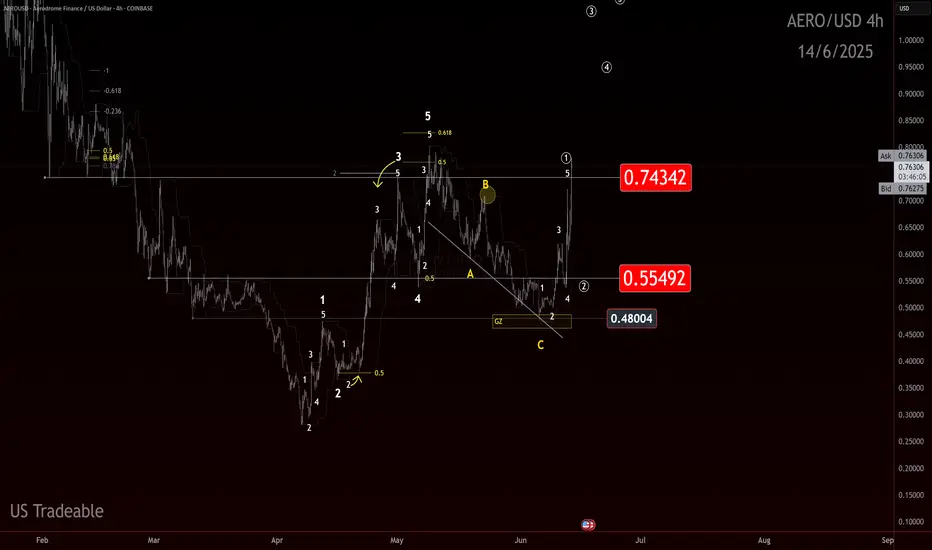
AERO: Take Off!?If you find this information inspiring/helpful, please consider a boost and follow! Any questions or comments, please leave a comment!
Long Entry at $0.515
Recap
SPARKS:AERO caught a bid after Coinbase news hit, but world events quickly clipped the rally’s wings. Price bounced cleanly off the .48 level, which aligned with an Area of Interest (AOI), a Level of Interest (LOI), and a golden zone retracement displayed in the last analysis.
Explanation
The .48 level was key and the reaction was textbook. The Coinbase news provided a catalyst just as price reached the .55 level. However, macro uncertainty remains a headwind.
Now, all eyes are back on .55. Bulls need to defend this structural level. The current pierce of .75 is an encouraging move. Continuation and a proper flip of that level would keep confidence high. Wave 3s are a sight to see, so a retrace may not even occur if price simply sends. Still, while AERO stood up and moved counter to the broader market when world news dropped, that alone may not be enough if global bearish reactions continue.
Outlook
Entry projected in the previous analysis has played out in ideal fashion, but the market remains fluid. Key levels:
.75 recent break
.55 ideal hold
.48 impulse invalidation
Current trend at the lesser degree is up and holding higher lows. Next objective: take out the .80 pivot and change the trend at the higher degree.
Break of the higher lows at the lesser degree would be the first sign of weakness. I’m watching for a definitive correction for a potential long add. A swift move that breaks higher lows could signal danger to bulls.
Trade Safe!
Trade Clarity!
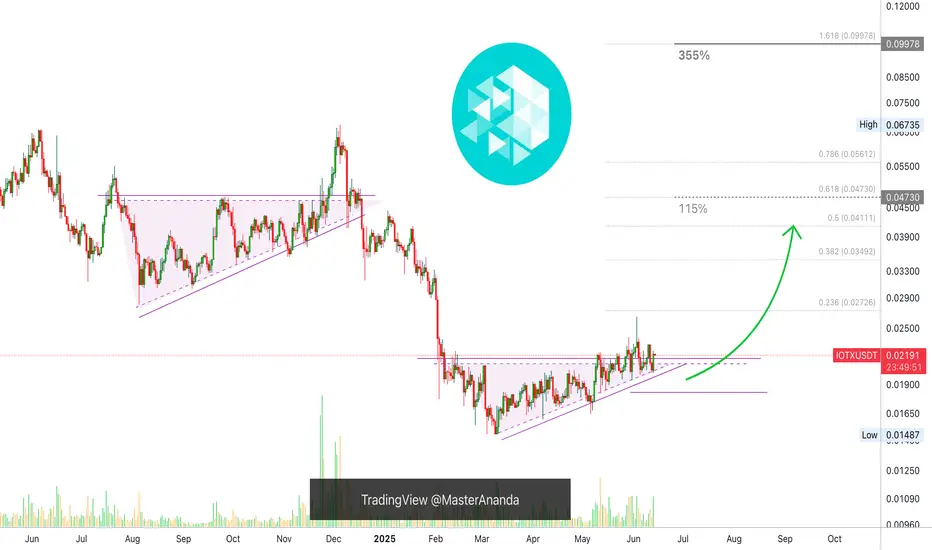
IoTeX 4 Months Bottom Consolidation, Time To GrowThis is one of the best types of chart setups, very low risk and a high potential for reward. Let me explain.
IOTXUSDT hit bottom mid-March, after this bottom, it has been consolidating bullish for more than three months. If we take the drop produced in early February as the start of the consolidation phase, we are talking about more than four months sideways, this is huge. Four months sideways simply means a very long and strong consolidation phase. The longer the consolidation phase the stronger the bullish wave that follows, and bullish is what is coming next.
Notice the higher highs and higher lows. Shy, small; slow and steady growth, but still higher since March. This reveals the broader bias and market trend. IoTeX is set to grow and it will produce a very strong bullish wave. It is only weeks away. Consolidation can only go for so long and it has been already more than four months.
This is an easy pair, an easy trade. Buy and hold.
Namaste.
Bitcoin Cash Early Recovery & Bullish ContinuationToday's candle says it all. Bitcoin Cash moved to hit a low of $397, today, and the same session now trades at $449, the highest price since 23-May which was the date that produced the highest price since January 2025. This is an early recovery signal.
This signal is good and great but it needs one final bit to be confirmed, and that is a continuation tomorrow. The week is about to end and the close is what determines the next move. If the action closes above the 23-May high, $462, then ultra-bullish confirmed. If the session closes below then there is still room for some more shakeouts, retraces and corrections. But the early recovery signal is in. What one does, the rest follows.
Now, not all pairs will move in the same way. Some will continue lower, retrace, while some others produce an early recovery and move ahead.
Today's session is just too strong, we can easily say that Bitcoin Cash is ready to resume its bullish wave of growth. $684 next target, followed by additional growth.
Thanks a lot for your continued support.
Namaste.

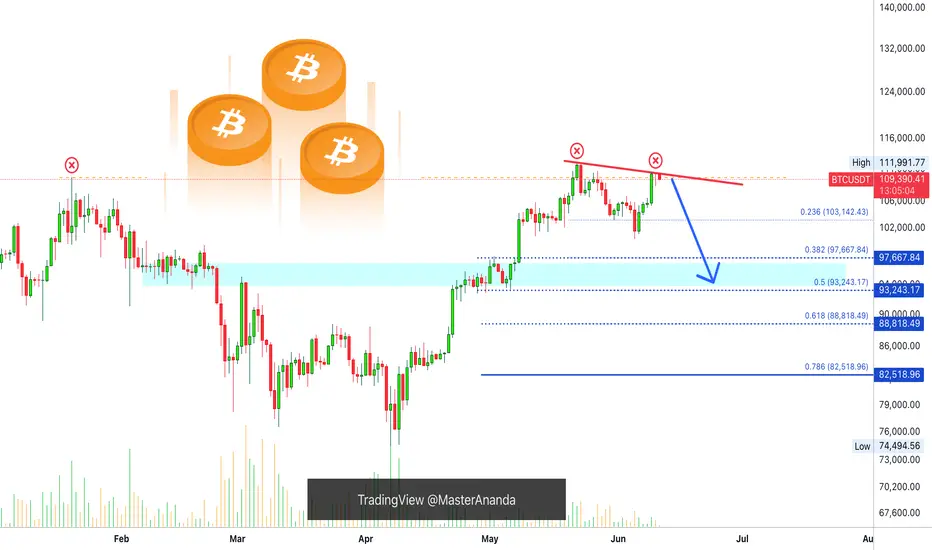
Bitcoin At Resistance: OMG! Not Another 20X SHORT!Sell at resistance; buy at support.
Good morning my fellow Cryptocurrency trader, I hope you are having a wonderful day.
Being able to adapt to changing market conditions is one of the signs of being a great trader. Being able to spot changes on a chart is also indicative of someone that can produce great results in this and other markets. How are you feeling today?
It is no secret, we let everyone know; We sell when prices are high, we buy a lot when prices are low.
Bitcoin is now trading below its 20-Jan 2025 peak price. And it is also producing a lower high. Both bearish signals that are pointing to a lower low.
If the first drop settled around 100K, the second one should settle in the low 90s or right below 90K. It can go lower of course but we go step by step. I am not saying GO SHORT 20X again. This would only be possible for people who are smart, experienced traders and those that can take advantage of a changing situation without breaking their portfolio or long-term plans. Those can definitely SHORT this setup and profit short-term.
A trader trades, it is what he/she does. You sell when prices are high if a drop is incoming, you buy when prices are low if a rise is next.
This is a friendly reminder and it carries great entry prices and timing. Follow the chart.
Trading volume is super low as Bitcoin trades near resistance and this is one of the biggest exchanges in the world. Low volume at this point reveals a pattern of distribution, distribution means lower of course.
Both the MACD & RSI move on the bullish zone but trending lower, bearish at this point.
What will it be: Will Bitcoin move down next? Will Bitcoin move up?
My money is on down.
Leave a comment if you agree.
Thanks a lot for your continued support.
Namaste.
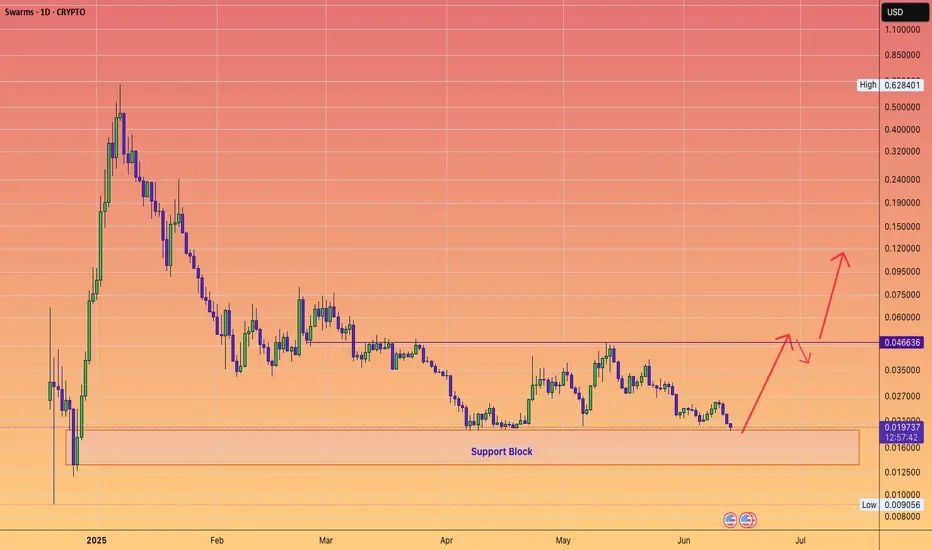
SWARMS can be a double digit crypto again.Low risk entry level --- if we assume the bull still has legs.
ETH - Medium-Term Bulls Confirmed Control!Hello TradingView Family / Fellow Traders. This is Richard, also known as theSignalyst.
📈 As per our previous ETH analysis (shown on the chart), ETH rejected the green support zone and pushed higher, reaching our target near $2,750.
What’s next?
After breaking above the $2,750 structure marked in red, the bulls have confirmed medium-term control.
🏹 As long as the last major low at $2,700 holds, ETH is expected to remain bullish, with a potential move toward the $3,500 resistance zone.
📚 Always follow your trading plan regarding entry, risk management, and trade management.
Good luck!
All Strategies Are Good; If Managed Properly!
~Rich

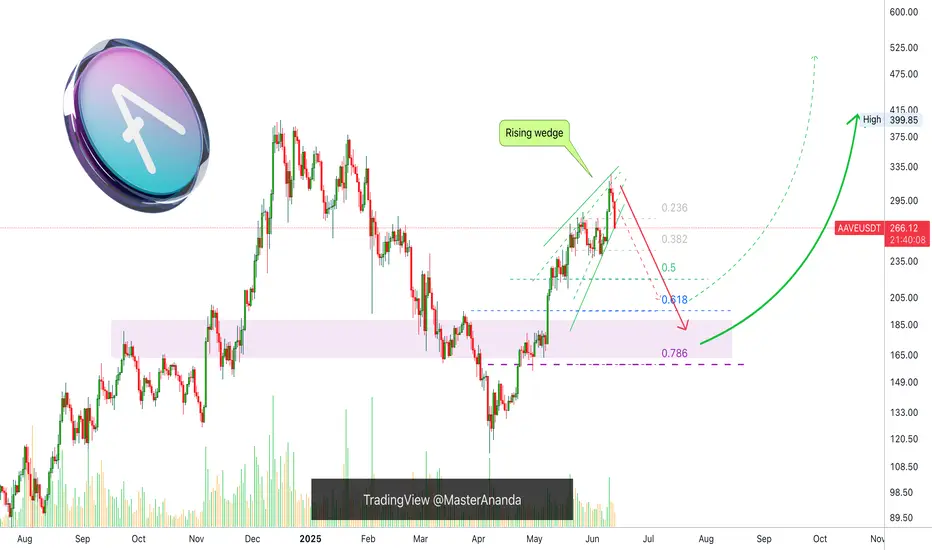
Aave Has Room To Go Lower, I Will Spot The ReversalAave outperformed many pairs. Total growth reached 185%. It even produced one final advance and peaked only two days ago, 11-June. But now the bears are in and taking control of the chart. A strong rise is balanced out by a strong drop.
I think this is a nice project, a great project a nice pair. The strategy here is all the same. Advanced traders go SHORT. The rest, wait for support to be established before going LONG. Wait for the drop to end before buying again.
Remember, there will be plenty of time and plenty of signals showing the low is in. I will be here posting charts everyday.
I will catch the perfect bottom on this retrace, the same we did 7-April. It will be easy.
In fact, we will spot the reversal even before it takes place.
Thanks for the follow and for your continued support.
Namaste.
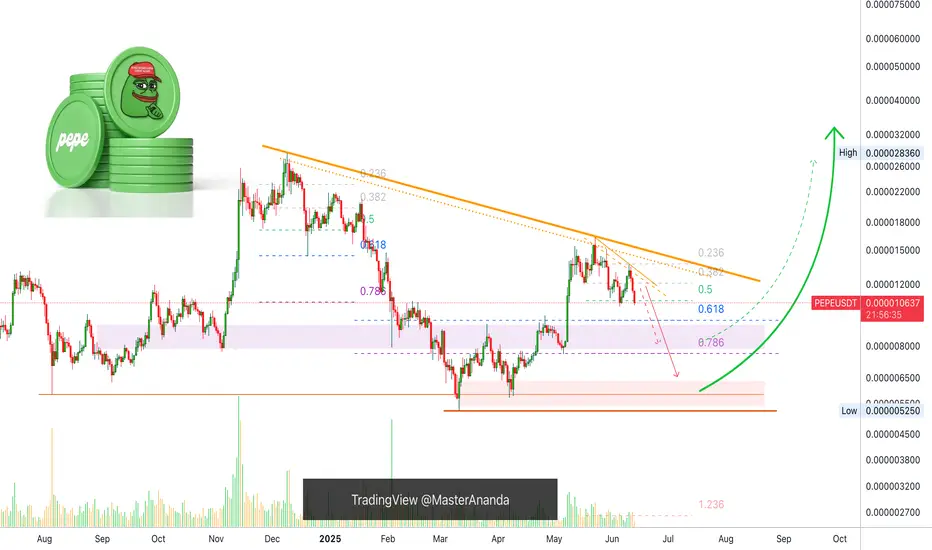
Pepe, Finding The Next Support ZoneThe same analysis that I made for Dogecoin is true here on PEPEUSDT.
We have two support zones. We have lower highs long-term, starting December 2024 (six months is already long-term), and short-term, June vs May.
What we are seeing is a repeat of the December correction but a miniature version. The bullish wave that follows will be a repeat of the April-May advance but with total growth highly magnified.
So the correction will end up being much smaller while the bullish wave that follows much stronger. Alternation.
If you want more information on price action, what is happening, read all the recent charts I just published. The situation across several projects is quite similar, at least the ones I've been seeing.
The duration of the correction will vary between a few days to a few weeks. Some pairs are already at bottom and will recover soon while others still have a long way to go. Those that grew nicely recently will remain lower, those that didn't grow will move up strong first.
Each chart needs to be considered individually but that's the general picture. You can find which ones will move first on the next wave based on recent past action.
Thank you for reading.
Namaste.
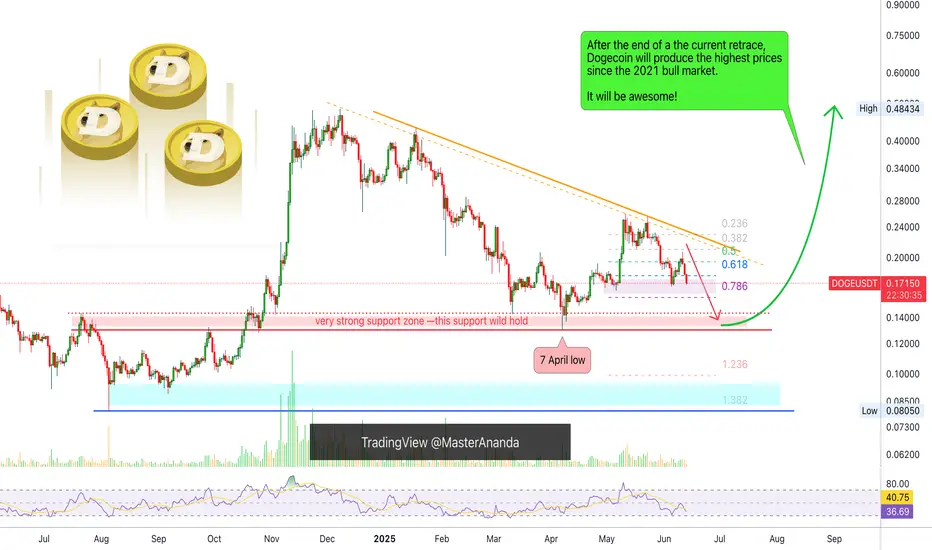
Dogecoin, How Far Down Can It Go? Support Confirmed!The retrace is on and Dogecoin is moving lower with a full red candle. The trading day just started and this is truly concerning. As soon as I saw what was happening, bearish momentum growing, I wondered, will the last low (7-April) break or hold?
That's the question I will try to answer.
Since we already looked at the candles and chart structure (lower highs), I looked at the RSI to try and find some clues. Sure, the RSI is already bearish and became really weak 5-June. This is a positive signal because we are looking for signs of a reversal.
Once the RSI becomes weak it immediately starts to turn and the change happens first on the RSI and later the price. This is how you end up with a bullish or bearish divergence on the chart.
For the 7-April low to break, the RSI would have to go into extreme levels, ultra-weak/oversold, but this isn't likely, which means that there is a good chance that the 7-April low will hold.
A support zone is already being tested now which is the 0.618-0.786 Fib. retracement in relation to the April-May wave. While this is a weak support because it is based on the short-term, it is still a support zone and lots of bearish ammunition will be consumed here.
The 7-April low was a peak in September 2024 and also a bigger range from July 2024 (resistance turned support). In October 2024 this level was broken and tested one last time as support before the last bullish wave Dogecoin produced leading to a multi-year high.
In November 2024 again this level was tested on a wick and held nicely.
All in all, this means that we are likely to end with a higher low because this is a very strong support zone. I made it red on the chart.
If the action does move lower, it should only do so briefly on a candle wick. If you are lucky enough to be around when this takes place, you can go all-in at this point and you will be sitting on a great position for the next bullish wave.
Namaste.
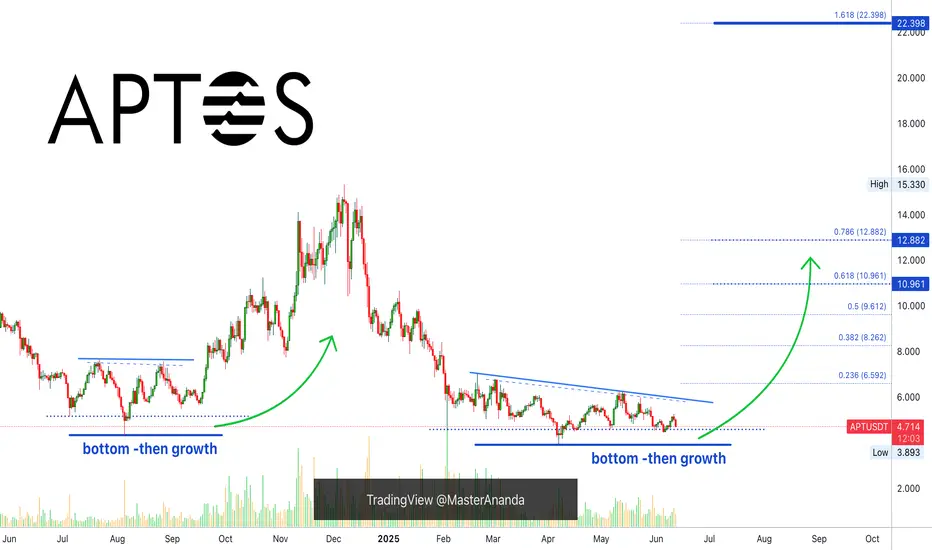
Aptos, Good & Bad (Leveraged Trading vs Spot)This is both good and bad at the same time.
The bad part, or rather sad part, is the fact that there hasn't been any decent bullish action recently. This pair did not grow by any significant amount after its 7-April low.
Ok, what about the good part?
The good part is that prices are low. This pair is "yet to move."
Low prices means a great buy opportunity for what we know comes next.
I know, I know... You might not believe me or your morale might be done but we already had a preview with many pairs growing between 100 and 300%. In less than two months. That's the preview. But the market is big and not the entire market can advance in a single wave. That's why I keep on harping "choose wisely," because sometimes we can end up with the pairs that are not moving in the current wave. They will move, trust, but some will move now and others later down the road.
Ok, good and bad.
The bad part is not that bad but it can be said that it is bad that prices are low. But this is actually good. If prices were high, there would be no buying opportunity, we would have to ignore, dismiss this pair. Since prices are trading low-near support, we can accumulate; buy and hold focused on the long-term.
I mentioned tons of times leveraged trading but all these chart setup can be traded spot. In fact, any setup that is good for leverage is even better for spot because the risk is none.
With spot trading we simply hold. What's the problem? You expected 1,000% growth in 2 months? If that's the case, it simply takes longer and we wait. See? No loss, the worst case scenario is a long-term wait. That's spot trading, buy and hold and you will win in the end.
Leveraged trading is more complex but you know, risk vs reward. You put on lots of risk, huge risk but wow, the rewards potential is awesome. We only approach this tool when we learn the market, when we know what we are doing and we have no need for money; only when money is already plentiful and available.
If you have a need to earn now, "make money fast," and so on; avoid leveraged trading at all costs because it is very likely that you will lose everything rather than achieve success. But, on the other hand, if you are living the good life, you communicate with your wife and you have heart, you are grateful for the food you eat, for the simple stuff, for your house, your friends, your bed; then you can use leveraged trading. Because you will be able to know when to close a position and say "thank you!" rather than double-down on a losing trade.
In short, we need a stable life and mind to use this tool with any success. If our lives and minds are not stable, it is better to start slow. If you cannot make money slow, you will not be able to make money fast. If you cannot appreciate $100, you won't be able to accept $1,000 for a single trade.
So, thanks a lot for your continued support.
I hope you are enjoying the content. It is always my pleasure to write for you, day after day after day.
Remember, it is not about getting it right or getting it wrong, it is all about a mental, emotional and spiritual connection. I am sharing what I learn just so that you can avoid the pain of a major loss, something that I know just too well because I've been there before. I've lost everything countless times and yet, I continue to fight, prosper and grow.
Namaste.
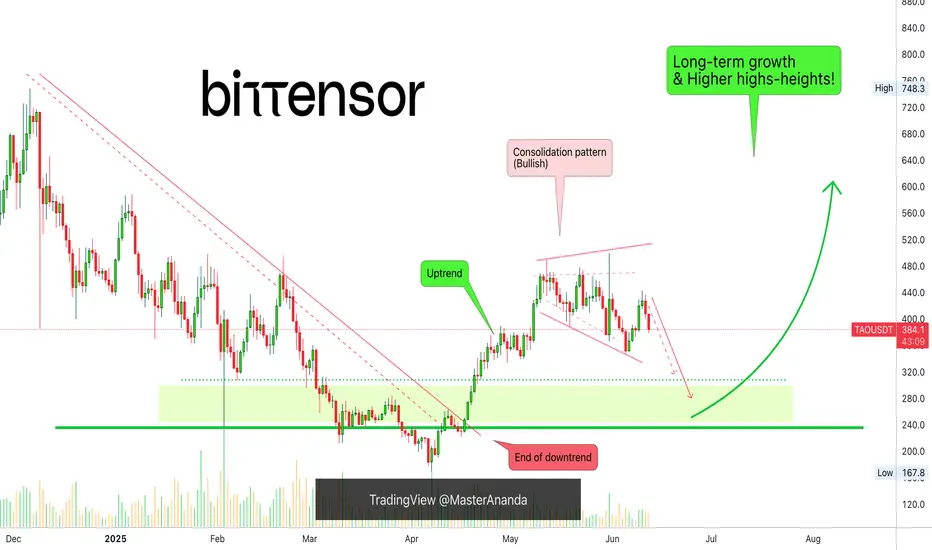
Bittensor Won't Go Much Lower (Long-Term Growth Explained)I am not concerned when looking at TAO (Bittensor) because I know that it won't go much lower and I also know, based on the chart, that it won't be bearish for much longer... And this is all great news.
Good... Good, good, good.
Good afternoon my fellow reader, I am happy to receive once more your undivided attention. It is my pleasure to receive your support.
Please, allow a minute of your time for me to read this chart.
It is the same pattern all over again, when the market is set to grow, it grows; but, long-term growth means months of prices moving higher and the market is never in a hurry to make you rich. So, it will grow but it takes time and time we have, time we want more, time we need but also we waste lots of time in things that are not productive, so let's use this time to plan for what will be coming next.
The moment is now, true. TAOUSDT and Crypto are bearish now and that's ok. You know why this is great news? Because being bearish now means that soon this phase will end. The market can only be bearish for so long. When it is bullish, at some point it turns bearish but, when it is bearish then again it moves back up.
TAOUSDT is already very close to strong support and this support will be the end of the bearish wave. Give or take one week and this will mark the start of the next bullish phase. Three months of sustained growth, another retrace and the more growth, on and on and on.
So, prepare now to be able to profit from the incoming bullish wave. The market will continue to fluctuate but with a strong bullish bias, and that is all that matters. We want to see our market grow because we will grow together with the market. If you are reading this, you are part of this market and that's very wise because Crypto is young.
Joining a new financial market in its early days... The opportunity of a lifetime and it was made for you to take.
Thanks a lot for your continued support.
It is truly appreciated.
Namaste.
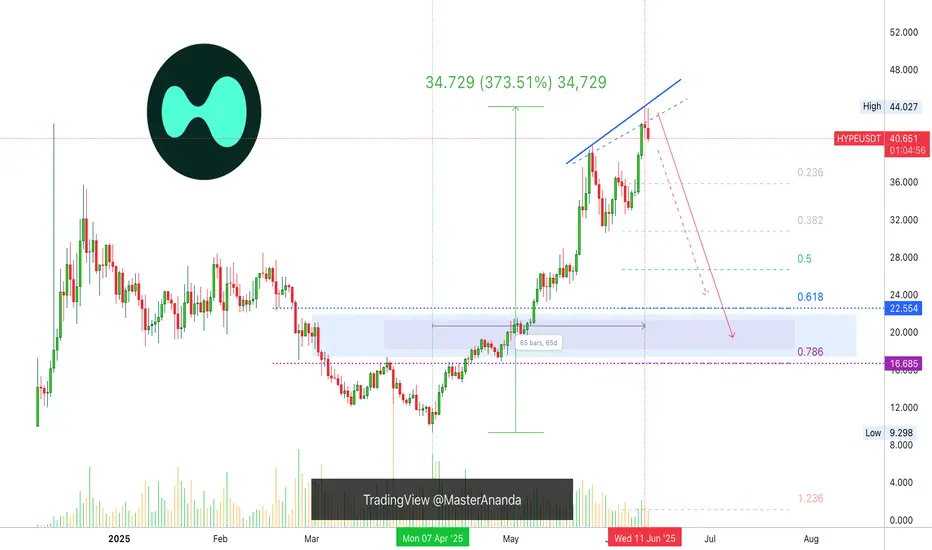
Hyperliquid Correction Exposed, $16.6-$22.5 Range To Be TestedAfter a strong rise there is always a strong correction and I will call this normal market behavior.
Hyperliquid entered the TOP20 altcoins by market capitalization and now sits at #11. Amazing feat.
In a matter of 65 days, between 7-April and 11-June, HYPEUSDT grew a very nice 373%.
A correction can take prices back below the 0.618-0.786 Fib. retracement support range. Which means between $16.7 and $22.5.
As usual, after the bearish wave is over, we can expect a new wave of growth. This one should unravel fast.
Thank you for reading and for your continued support.
Additional details can be found on the chart.
Namaste.
Cardano, What To Expect!The action is turning bearish after a very weak bounce from "higher low" on the chart. There is a sequence of local lower highs on ADAUSDT daily. What to expect?
Expect a test of the "higher low" zone as support and this zone breaking. The next level that will come into question is the "main support" but this one isn't likely to be tested.
Picture the action going lower towards support and ending right in between 'higher low' and 'main support'. This is the main scenario.
This scenario will keep the broader bullish structure intact and at the same time would end as a major market flush. As many weak hands as possible are removed and yet the bulls will remain in control.
Make no mistake, whatever happens in the short-term, Cardano will continue to grow. This is only a temporary event. Patience is key.
Thanks a lot for your continued support.
Namaste.
Ethereum Set To Continue Lower, How Long?The drop is now confirmed and yet, it is still early...
Good afternoon my fellow traders, all is good when we consider the chart, Ethereum's price and the bigger picture, nothing changes. But we are witnessing a retrace. This retrace will end in a higher low and I am thinking of time now, duration.
Initially I was thinking about the Fed meeting and this event being the catalyst for change, but the Cryptocurrency market is following its own cycle and for it to be super bullish later this year, all bearish action, all weak hands, needs to be removed now, today.
So the bearish action can fluctuate between just a few days, 3-5 days, to 1-2 weeks. That's my analysis based on past history, chart data and experience.
The retrace might not last that long though, market conditions continue to improve and Ethereum might not produce a lower low compared to Bitcoin. Bitcoin is trading pretty high and a correction can develop any day. Since Ethereum is already low compared to its ATH, there is less room for prices to move lower, makes sense?
The downside is always limited, SHORTing is riskier than going LONG. It is wise to wait for a new entry before buying more. Experienced traders are recommended to SHORT. This chart setup will change in a matter of days, and then the market will turn bullish again, long-term.
Thank you for reading.
Namaste.