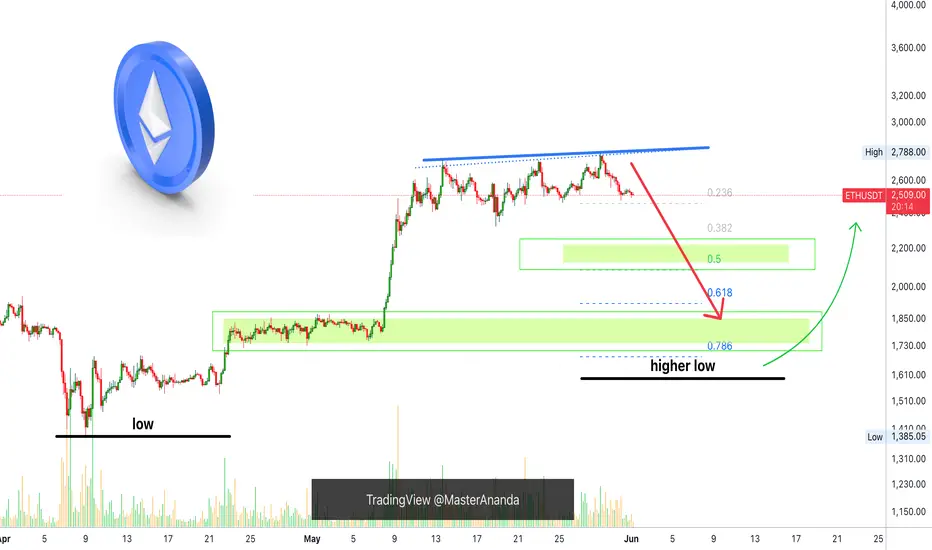
Ethereum: $2,000 Entry LONG Opportunity: Advanced Trading TipsBe careful when SHORTing here. The downside is limited but the upside is unlimited. Ideally, we trade with the trend. With the bottom being set 7-April, it would be wiser to wait for the higher low and go LONG. Now, bears are bears and bears are going to SHORT and that's ok. Just don't do it if you lack experience because it is harder than a LONG trade.
So here is the chart. The exact support level I cannot say but a bearish continuation looks high probability.
A $500 drop equals 20%. If you are doing 5X, this caps your profits potential to 100%. This isn't bad considering that it can happen within days. Experts only.
On the other hand, 3-10 days should be the maximum but of course, it can extend—these are just rough estimates.
This is how it is done from the bullish side, my side.
We wait patiently for the market to complete its retrace. We know it is a retrace because it is short-lived and because it ends in a higher low compared to the last major low.
We wait patiently for the drop and for clear reversal signals to show up on the chart. Once we have clear reversal signals, we go LONG. Very simple.
If you bought the LONG from the $1,570 level, then of course, nothing needs to be done. Sell a bit at each resistance, buy more at support. You can reduce your position even now. Remember, no need to get the exact top nor exact bottom. So you can sell some now, take profits; great. Then buy some more when prices are low. Your buy price can be $1800, $2000, $2100, it doesn't make much difference. What matters is selling high and buying low.
The first step is to get the great entry. Done. We did this back in April. The second step is to play the market as the bull market unravels. See how much time there always is to take action. Plenty of time to buy we had, plenty of time to sell.
For this to be profitable and successful we have to plan beforehand.
Here I am giving you live step by step instructions and this can also be done. But the truth is, people went LONG at resistance with high leverage and ended up losing everything, because we tend to trade based on an impulse. No, no, no.
Instead, detach, wait for the perfect moment and go LONG/SHORT.
Which one you prefer, bull?
Then wait for support and go LONG. Do not trade against your preferred bias.
Are you a bear?
Wait for resistance SHORT the retrace or wait for the correction. But this is many times harder of course because the downside is limited.
I hope you find this information useful and if you do...
Good luck.
Namaste.
Altcoins
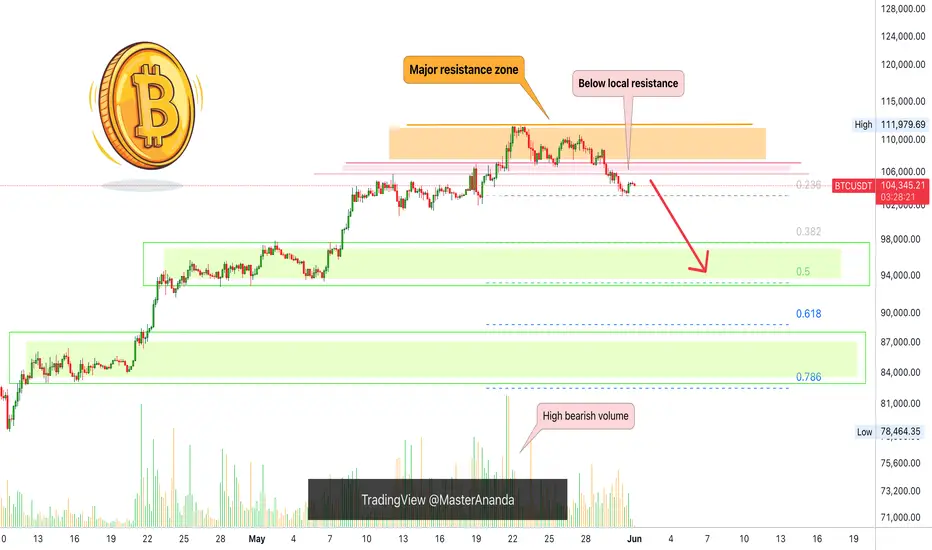
Bitcoin Mixed: Below Resistance, Above Support (Altcoins Update)I hope you are having a good Saturday and weekend my dear friend, I have a quick update on Bitcoin and the Altcoins market today. Good news and bad news.
Let's start with the good news.
The Altcoins are producing a higher low and bullish. This means that we will continue to see growth as expected. The market went through a shakeout, nothing more.
On the Bitcoin side, we have the bad news which is not that bad.
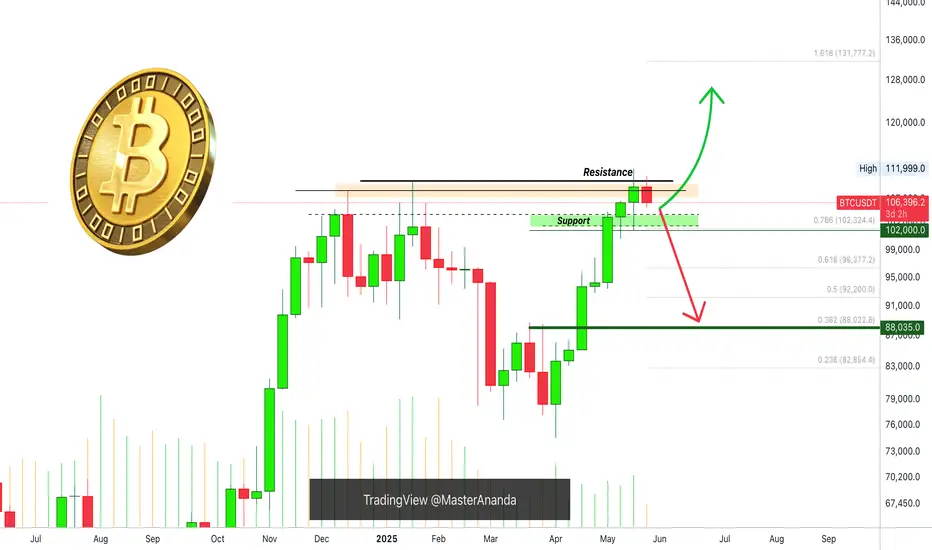
The action is happening above support (grey dashed line on the chart) but below local resistance. The market just went through a major shakeout. I shall explain.
People got greedy and ended up putting too much leverage on their positions, when this happens, the market needs to balance things out because it cannot grow in this way long-term. And thus the shakeout. 1 billion dollars worth of LONGs were liquidated.
The good news is that once this process is over, the market can resume with its usual cycle but...
The situation is tricky now but I can tell you exactly what will happen. Bitcoin will consolidate before additional growth. While Bitcoin consolidates, the Altcoins will move up. Plan and simple.
What happens next with Bitcoin, down or up?
As long as Bitcoin trades above $100,000-$102,000 weekly/monthly the chart and market bias is considered ultra-bullish . This means that Bitcoin is ultra-bullish right now.
If the action moves and closes weekly below 100K, nothing happens. A simple retrace that ends in a higher low followed by additional growth.
The market is bullish now and will continue bullish.
The Altcoins are a good buy and this recent flush gives an opportunity for those that missed early prices.
Market conditions remain the same. We are bullish and set to grow long-term.
We are 100% bullish on Bitcoin and the Altcoins market.
Namaste.
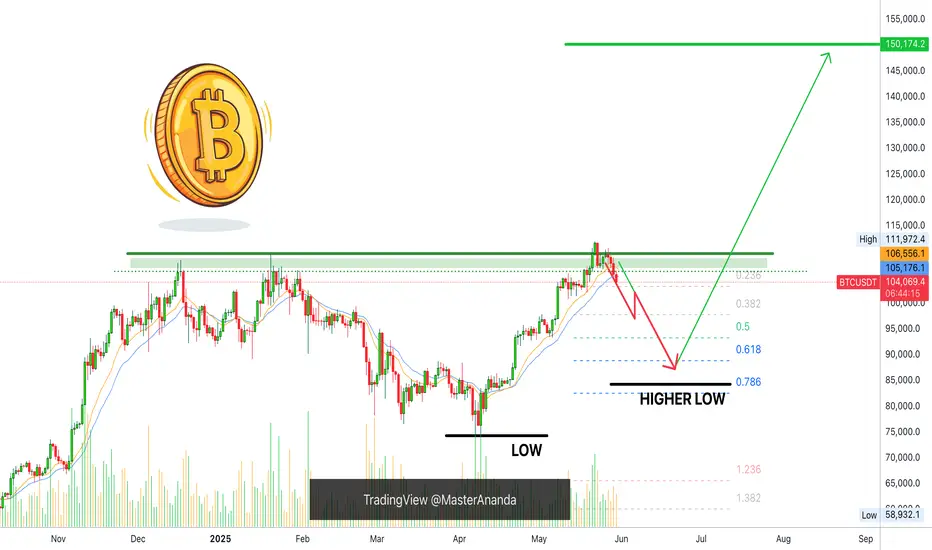
Bitcoin Bullish, Will Not Hit $200,000 This Cycle, $137,000 NextBitcoin is still bullish. A higher low is a bullish development. If Bitcoin stops bleeding at around a price of $88,888.88 this would be a strong, perfect, higher low compared to 7-April and it would match perfectly a classic correction because this price sits at the Fibonacci golden ratio.
Good afternoon my fellow Cryptocurrency trader, timing is important and we got perfect timing on this retrace. How far down will it go?
It is still too early to say but we know that below $74,500 isn't possible because that's the last low. $78,000 is possible but not necessary so we are betting that the lowest ever will be above $80,000. Remember, Bitcoin will never ever trade below $80,000 in its history. Sorry, but these prices are gone, nobody can buy this low again.
There is good news though. You can still buy when the next low is established.
It is impossible to predict the exact price when Bitcoin will stop dropping, but it is possible to see a support level being developed. So when the next support is in, we can cover (close the SHORT) and go LONG again.
Pretty simple. Buy when prices are low, sell when prices are high.
A new all-time high is pretty high and thus we sell (sold).
When the next support level is established, we buy again.
Thanks a lot for your continued support.
Each Altcoin needs to be considered individually because some will grow while others move down. We are more advanced now in this bull market cycle. You can visit my profile for more.
Namaste.
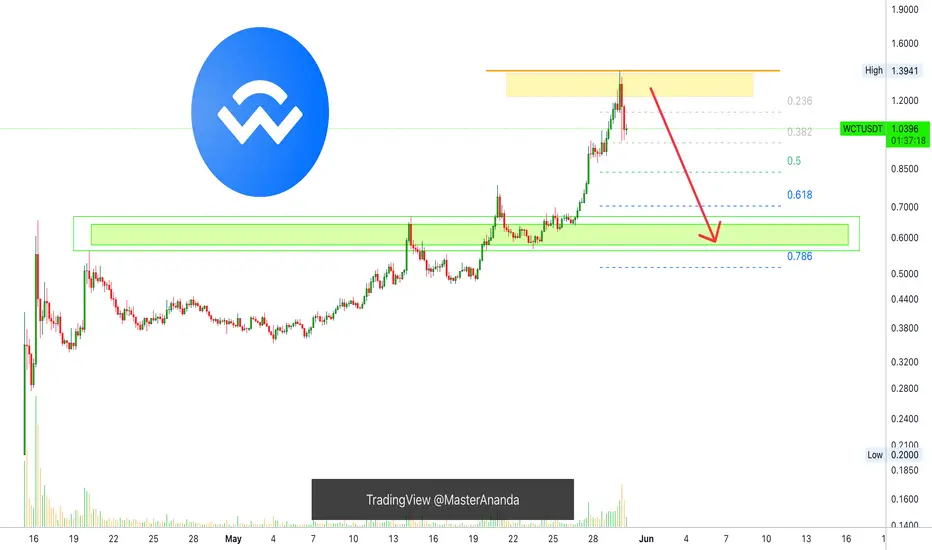
WallectConnect Grows Beyond 595%, Correction Time?The market always seeks balance. A strong bullish wave is balanced out by a retrace or correction. Here this type of scenario is already developing.
WallectConnect (WCTUSDT) grew strongly since April 15, as did much of the market but found a peak recently.
Total growth amounts to 597% from the market bottom. From the first support, some ~400% which is awesome. After the retrace/correction, you can expect additional growth.
The volume today as the all-time high was hit became the highest since April 16. Bearish volume that is. The highest bearish volume bar came right after the all-time high. This is a warning signal.
Do not rush to buy, wait for the establishment of support. Once support is found, you can go LONG. When the chart is bearish, now, the doors open to SHORT.
Remember to do your own research, numbers and planning.
Market conditions can always change.
When prices are high, do use a stop-loss if you decide to buy and hold.
(Only when buying (trading) at bottom prices the stop-loss is not recommended for spot.)
Namaste.
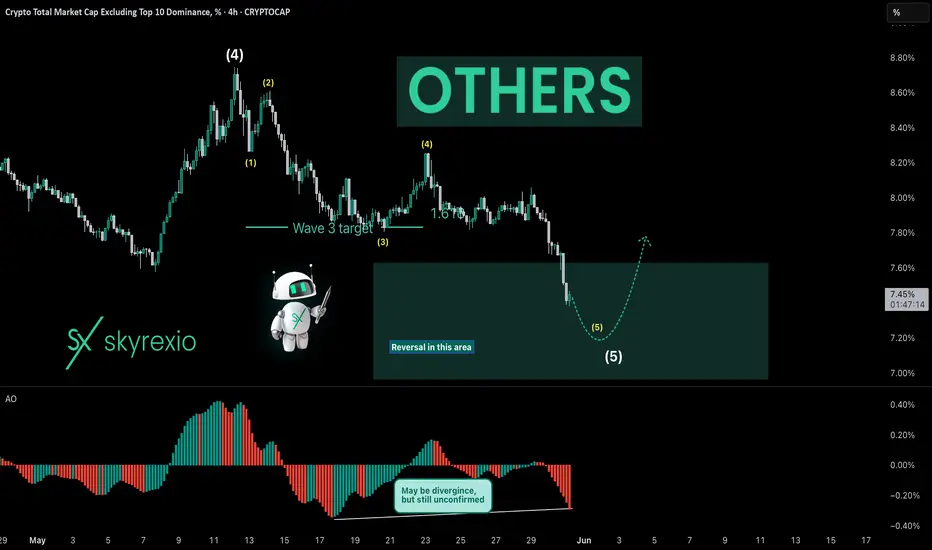
Actions Nightmare Is About To Be FinishedHello, Skyrexians!
Recently I shared this article about CRYPTOCAP:OTHERS.D where I pointed out that this chart is about to print another one lower low. Now it's happening, but this is wave 5 and now it's time to look for the altcoins bear market bottom.
Here we have 4h time frame and the internal structure of the final wave 5. Our main reversal signal can be divergence on Awesome Oscillator, and now it can happen if this drop will be decelerated. Price is inside the large green box - reversal zone. If we will see 3 rising columns on the histogram it's going to be the reveal signal with the yellow Elliott waves structure. This structure can be changed if price continues going down now without pullbacks. In this case I will recalculate waves and may be it will reach 7%. Also it shall match with BTC dominance which also has some space to go up. It shall at least retest the high at 65.5% (potential shortened wave 5).
Best regards,
Ivan Skyrexio
___________________________________________________________
Please, boost this article and subscribe our page if you like analysis!
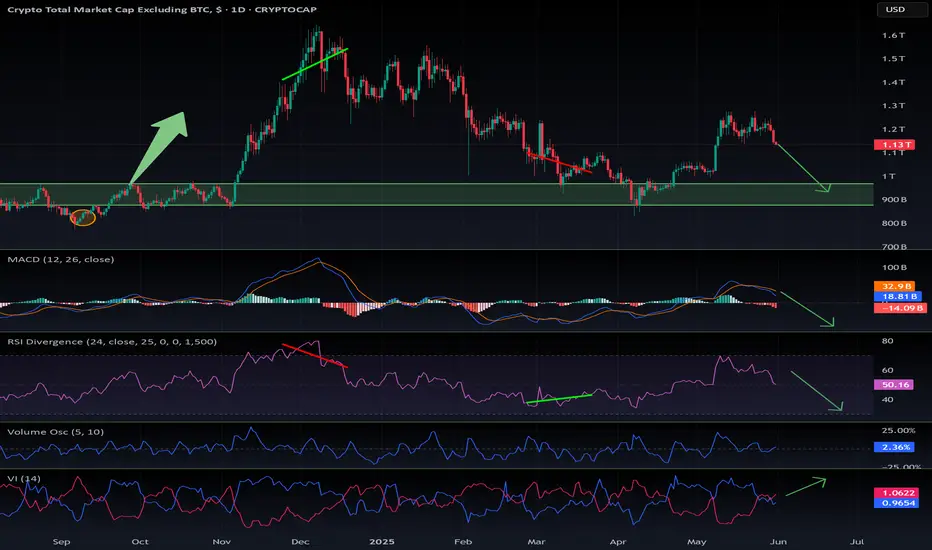
Altseason is cancelled for now. But Should resume soon.If you're interested in altcoins, be sure to check out my ideas. I’m closely tracking CRYPTOCAP:BTC.D and CRYPTOCAP:OTHERS , and you’ll find plenty of valuable insights in those analyses.
So, what’s going on? My CRYPTOCAP:OTHERS prediction played out — May was bullish. But was it the real altseason? Not quite. The true altseason typically begins at the end of the Bitcoin cycle, and we’re not there yet.
Right now, we’re seeing price action reminiscent of December 2024. Bitcoin maximalists are aggressively buying BTC during a time it should be correcting, which is inflating BTC dominance and crushing any momentum for an altseason. They appear to be using altcoins as exit liquidity to pump BTC, especially as retail investors hesitate to buy Bitcoin above $100K.
What’s next?
The daily MACD suggests we’re entering a correction phase that could last around two weeks. A drop toward $1.2T is likely, as there's a major order block between the current level and that target. However, the real support lies below $900B — my "green box" — which I view as the ideal buy zone.
Historically, entries in this green box have offered 2x–3x returns on high-volatility altcoins from the top 100, especially in sectors like memes, DeFi, and AI.
I expect altcoins to correct into that zone in the coming weeks — keep an eye on it.
DYOR (Do Your Own Research).
#Crypto #Altcoins #Bitcoin #BTC #BTCdominance #Altseason #CryptoMarket #CryptoTrading #MACD #TechnicalAnalysis #DeFi #MemeCoins #AIcoins #AltcoinSeason #DYOR
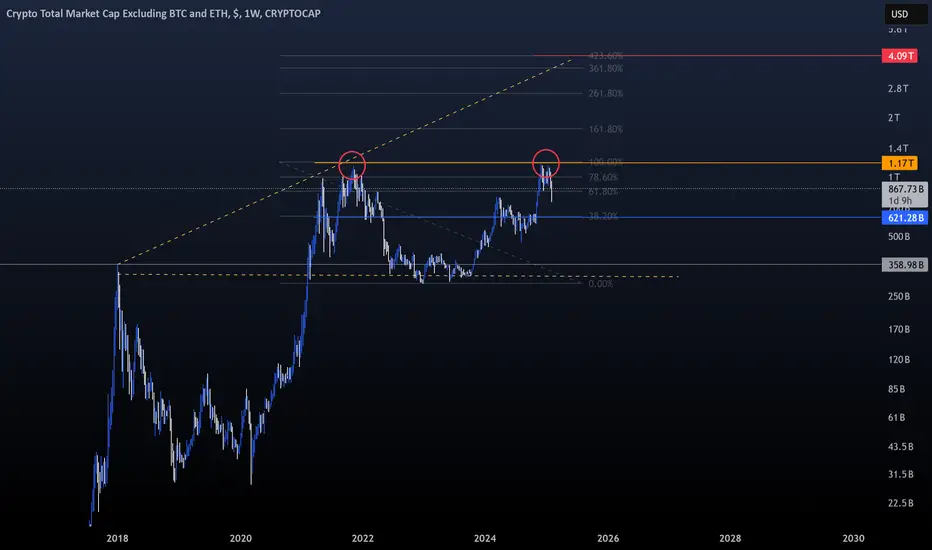
Market3I haven’t been posting much lately simply because there’s nothing particularly interesting to say, the market has been a bit dull.
2025 should be a strong year for altcoins, as they’ve been consistently suppressed. With BTC dominance reaching 64%, which is quite significant, all attention remains on Bitcoin.
On this chart, you can see that $1.17 trillion acted as a rejection level for the crypto market (excluding BTC and ETH). Time will tell, but I anticipate a $4 trillion altcoin bull market before the end of 2025.
Remember, Fibonacci plays a crucial role in long-term market predictions.
Invest wisely and at the right time.
Happy Tr4Ding !
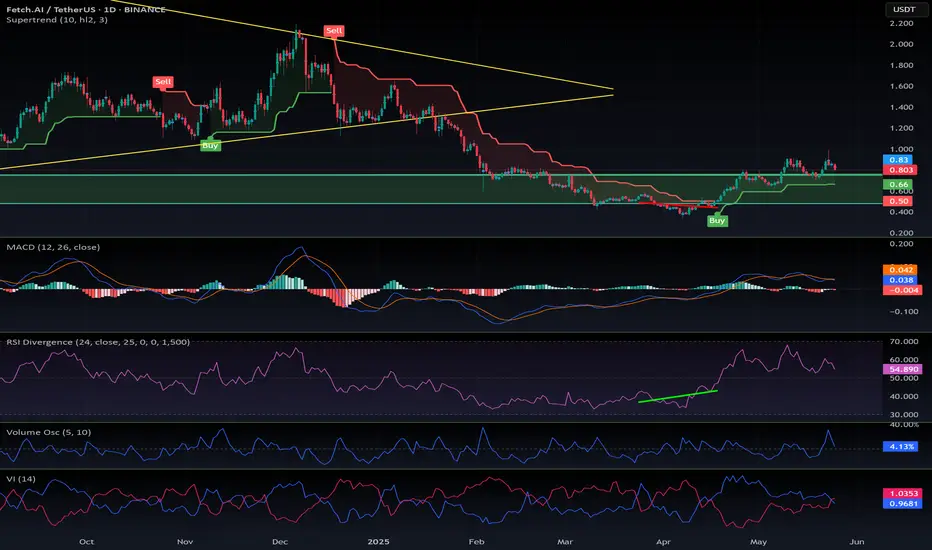
$FET is about to re-enter my buy green zone. Quick update on this coin:
The consolidation appears to have found its bottom, and the bullish divergence has played out as expected.
We’re currently seeing a slight cooldown on the daily timeframe, which is healthy after the recent move.
If NYSE:FET enters my green buy zone, it could offer a strong long entry opportunity.
As always, make sure to DYOR, especially during these uncertain times for altcoins.
#FET #CryptoUpdate #Altcoins #TechnicalAnalysis #BullishDivergence #CryptoTrading #BuyZone #CryptoMarket
$BTC.D Dominance forecast: update May 2025📉 BTC Dominance (%BTC.D) Update – At Resistance, Altseason in the Balance
Back on April 5th, I published a forecast highlighting the critical 65% resistance level on BTC Dominance. That analysis still holds: BTC.D reached 65% and got rejected, pulling back to 62% as of now.
⚔️ What’s Happening?
Bitcoin dominance is compressing, and we're approaching a make-or-break moment:
🔹 Resistance confirmed at 65%
🔹 We bounced down to 62% — not up
🔹 Market is hesitating, and the next move will shape the short-term direction for alts
🔍 The Bigger Picture
Bitcoin pumped hard recently, mostly due to:
MACD reversal on the weekly
Oversold conditions now turning bullish
Renewed institutional interest in risk-on assets
But let’s be clear:
🚫 We’re not in a full altseason yet.
What we’re seeing is cautious altcoin rotation, not a blow-off alt rally.
📊 Tech Indicators
MACD: Overheated
RSI: Still has room to move up
So technically, BTC.D could still break out above 65% — but it hasn’t yet.
⚠️ What to Watch:
If BTC.D breaks out above 65%, expect:
➡️ Altcoin bloodbath
➡️ BTC.D could head toward 70%, crushing the mini-altseason
But if BTC.D continues to drop from here?
➡️ Altseason starts to heat up
🔮 Outlook
A true altseason might not arrive until September/October. For now, the market is stuck in a range of uncertainty.
Keep your eyes on:
BTC.D reaction at 62%–65%
TradFi stress (bond markets, macro fears)
Bitcoin strength and ETH/BTC ratio
🧠 Take profits when you can. Protect your capital.
📌 Follow me for future updates—and don’t forget to DYOR.
📎 Original forecast:

Dogecoin Bearish (BD) but Bullish (BU)You see, Dogecoin is bearish but this bearish is only short-term. This retrace can last a few days more and then the market will turn and start growing again. In the worst case scenario, the drop can extend and last one or two weeks, that's it. Nothing more.
So, what does it matter if it goes down short-term when it will grow in the long haul.
See the pattern on the chart and the rising trendline at the bottom. This is the main support. The bullish structure will remain intact, the market is adapting because obviously, too much leverage can never work.
Once the over-leverage is removed from the market, we resume growing and this resumption is just around the corner. Next week or the week after, it doesn't matter, we are going higher.
Namaste.

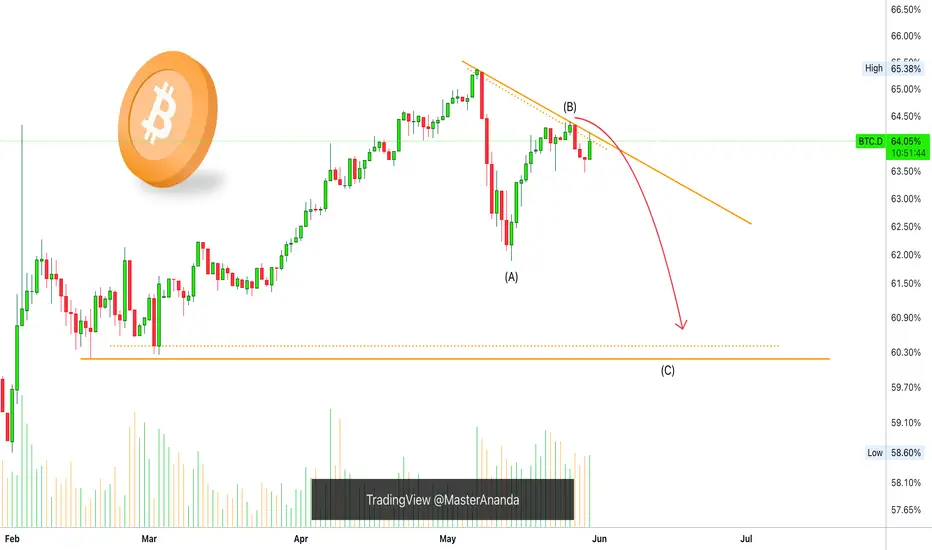
Bullish Altcoins: Bitcoin Dominance In Correction ModeHere BTC.D is still moving within a classic ABC correction. The peak happened 7-May. After 14-May there was a bounce but this bounce ended in a lower high. The correction is not over.
As this index moves lower, the Altcoins market will grow.
When Bitcoin turns sideways, retraces or consolidates, it is an opportunity for the smaller Altcoins to move forward. This is the scenario we are entering right now.
» Bitcoin sideways. Altcoins bullish. Long-term growth.
The 2025 bull market is only starting now. Prepare for growth until late 2025 or beyond (early 2026).
Namaste.
XRP's Correction Might Not Be OverIt looks like XRPUSDT can recover any minute now but the correction might not be over.
Good morning my fellow Cryptocurrency trader, what an unpredictable market we have today.
The action has been bearish since 12-May and bearish momentum continues to grow. It seems the bearish action is stopping now but XRP has not reached support. While a recovery can happen any day, the signals are bearish and we have three consecutive days the action being red, plus more than two weeks seeing lower prices.
We are bullish long-term but short-term anything can happen.
Bearish volume is very, very low which means that the down-move has no strength. How much lower can it go? Always a higher low because XRP will continue to grow long-term.
The correction might not be over.
Namaste.

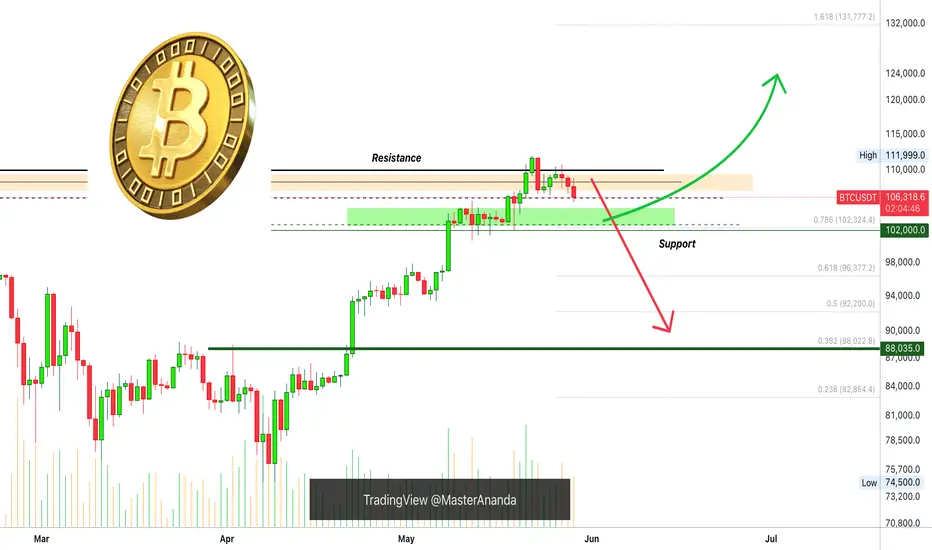
Bitcoin Strong-Bullish Above 102000, Remember The Bigger PictureWe've defined $102,000 as the strongest support level ever based on the long-term. This number was extracted using the 2021-2022 bear market. It is mapped which a red dotted line on the chart.
On this chart you can see how this level worked as resistance in December 2024 and January 2025, later to become the strongest support ever now, in May 2025. Bitcoin is 100% bullish as it trades above $102,000.
» I should say super-bullish, hyper-bullish, ultra-bullish, etc.
Right now Bitcoin is safe and sound when considering the bigger picture.
The Altcoins market is also safe and we can continue to accumulate; Buy and hold.
If you have any questions do not hesitate to leave a comment.
Please keep in mind that market conditions can always change. In a day without notice.
Thanks a lot for your continued support, it is truly appreciated.
Namaste.

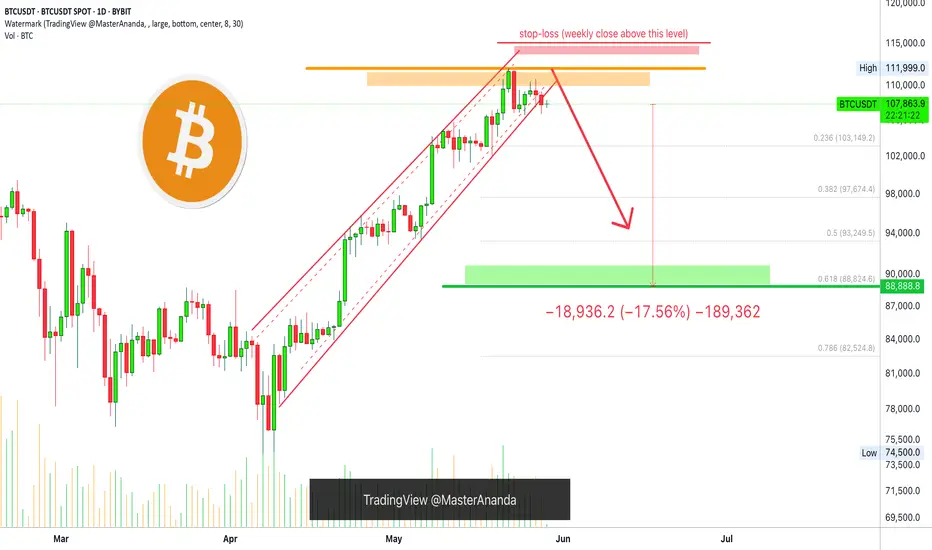
SHORT Bitcoin 10X Lev. Full PREMIUM Trade-Numbers (PP: 175.6%)For experts only. This is not for beginners.
Leveraged trading is ultra-high risk and it is even harder when it comes to shorting.
This is not medical advice. This is not spiritual advice.
This is definitely not financial advice. This is just a chart and some numbers.
How you decide to use these numbers is completely up to you.
I am wishing you tons of luck and success; profits 100%.
This is a strong chart setup. It looks great.
_____
SHORT BTCUSDT
Leverage: 10X
Entry levels:
1) $111,111
2) $109,255
3) $108,000
4) $107,000
Targets:
1) $103,149
2) $101,012
3) $98,790
4) $94.239
5) $89,999
11) $88,888
Stop-loss:
Close weekly above $115,000
Potential profits: 175%
Capital allocation: 4%
_____
Thank you for reading.
If you enjoy the content make sure to follow.
(Leave a comment with your toughts.)
Namaste.
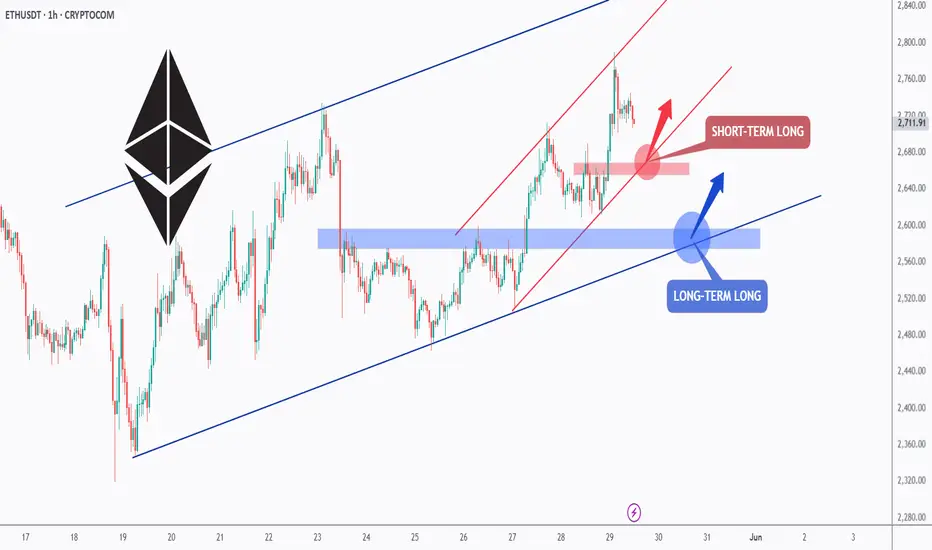
ETH - Long Anyway, Short-term and Long-term!Hello TradingView Family / Fellow Traders. This is Richard, also known as theSignalyst.
📈ETH has been overall bullish trading within the rising blue channel from a long-term perspective and within the rising red channel from a short-term perspective.
Moreover, the red and blue zones are strong support and structure!
🏹 Thus, the highlighted blue and red circles are strong areas to look for buy setups as it is the intersection of the lower zone(s) and trendline(s).
📚 As per my trading style:
As #ETH approaches one of the circles, I will be looking for bullish reversal setups (like a double bottom pattern, trendline break , and so on...)
📚 Always follow your trading plan regarding entry, risk management, and trade management.
Good luck!
All Strategies Are Good; If Managed Properly!
~Rich
Bitcoin Weekly, Why $20,000 Is Not Necessary!After closing 7 consecutive weeks green, Bitcoin turned red for the first time. Is this situation bullish or bearish? Will Bitcoin test $20,000 as support before hitting $200,000? Boost & follow to continue reading below.
The fact that Bitcoin found resistance is a non-event. After a very strong rise with 50% growth, it is normal to see a retrace or correction, it is as normal as it gets. Think back to August 2024. Bitcoin crashed and started to recover. The recovery didn't produce one long single up-wave, after some bullish action there was a retrace, this retrace ended in a higher low followed by additional growth. Exactly what I told you would happen if a drop develops. Yes, prices move lower but always end in a higher low. The higher low means that the bullish structure remains intact. An intact bullish structure means that market conditions do not change. This is only negative for those that bought at the top, short-term traders and over-leveraged traders, and those without a plan.
The rest of the market is sound and safe and will continue to profit long-term. Now, how far down will Bitcoin go? Will support be found around $100,000, $90,000, $80,000 or $76,000?
Remember, even if Bitcoin hits $76,000 on a flash crash this is still a higher low compared to $74,500 and thus bullish. We are bullish long-term. So, regardless of the short-term, noise, Bitcoin will continue to grow.
Prepare for the crash.
Buy and hold.
Namaste.
Bearish Bitcoin Confirmed —$20,000 Is Not Possible, Much Higher!After a lower high, Bitcoin is now on three days red. There is nothing bullish about this chart setup.
Think of it this way: Would you trust me to buy Bitcoin when it was trading below 80K? Now, Bitcoin moves from a low point of $74,500 to a high of $112,000 in less than two months. Isn't it normal for the market to look for some relief, a retrace or correction?
Please, do not be offended by me sharing a simple chart, reading a chart. It is very normal and I always mention that the market never moves straight down, nor straight up. Bitcoin doesn't need to crash, but after a rise of 50%, I wouldn't be surprising to see the development of a higher low.
If you are going crazy right now, maybe you didn't do your homework but it is definitely not my fault. The market moves up and down, up and down... It was going up, now, down we go.
Adapt to market conditions rather than fight.
If you are fighting, then you are not prepared.
If you have to write insults in the comments section, then it means you are not doing your homework.
It is your money. Be smart.
Don't be stupid.
You can do this.
P.S. If you can easily see the market fluctuating and this type of post doesn't create a mental breakdown, then all is good. You are great and you will continue to enjoy huge profits in this 2025 bull market.
Prepare for the crash.
Namaste.
"PEPE 1H Analysis - Breakout Incoming? 📊 *PEPE/USDT – 1H Technical Analysis*
An ascending triangle pattern is developing on the 1-hour timeframe, which often indicates potential bullish momentum.
🟢 Price is approaching a key resistance near *0.00001516*.
🟡 A clean breakout above this level with strong volume may open the door for further upside.
🔴 Watch for *confirmation* before considering any move.
🔍 This chart is purely for educational and analytical purposes.
No financial advice. Do your own research before making any trading decisions.
#PEPE #PEPEUSDT #Crypto #TechnicalAnalysis #TradingView #Altcoins

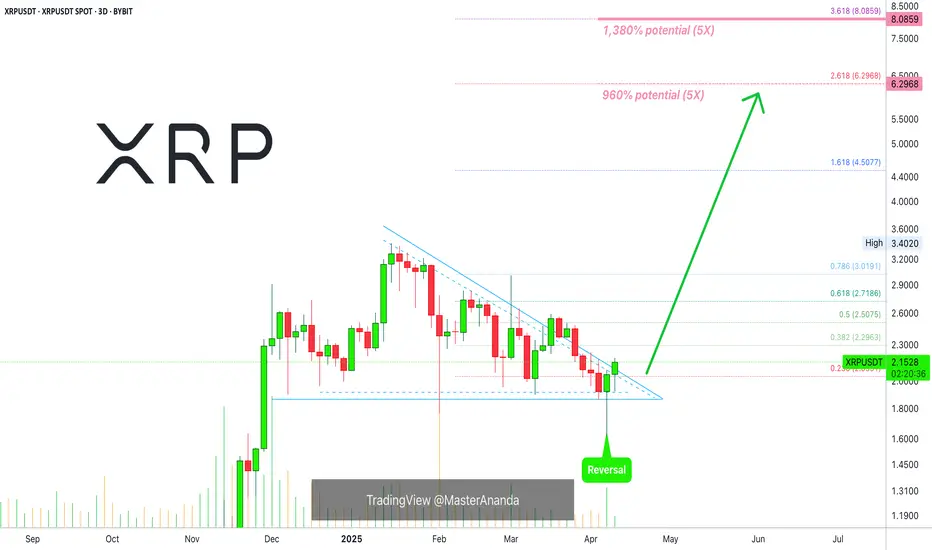
XRP 5X Lev. Full PREMIUM Trade-Numbers (PP: 1380%)Good afternoon my fellow Cryptocurrency trader, this is a great weekend and a wonderful day.
The bullish bias for XRP has been confirmed more than enough. It is time. The time is right and the time is ripe to go LONG.
I am publishing to give you full trade-numbers for you to enjoy.
This is a high probability chart setup.
I am wishing you success and great profits. Crypto is going up.
We are doing mid-leverage on this pair. We are going with 5X because the action is already moving. Earlier, we would go higher, but we like to keep risk moderate.
Full trade-numbers below:
_____
LONG XRPUSDT
Leverage: 5X
Current price: $2.15
Entry levels:
1) $2.18
2) $2.12
3) $2.05
4) $1.98
Targets:
1) $2.50
2) $3.02
3) $4.51
4) $6.29
5) $8.08
Stop-loss:
Close weekly below $1.95
Potential profits: 1380%
Capital allocation: 5%
_____
I am wishing you great profits and tons of success.
This is for advanced traders.
You decide how to secure profits, how to adapt to market conditions and how to trade.
You also decide your own level of risk. If you win, all the profits are yours.
If you lose, that's ok, the market offers endless opportunities and life goes on.
It is not about winning them all. It is about winning and growing.
Thanks a lot for your continued support.
Namaste.
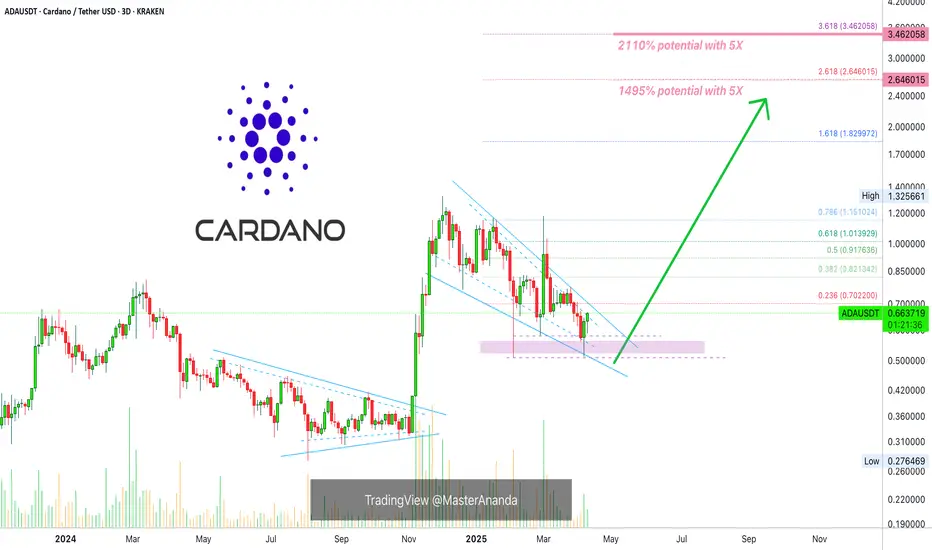
Cardano 5X Lev. Full PREMIUM Trade-Numbers (PP: 2110%)I want to share a trade setup that looks really good. It has relatively low risk with a very high potential for reward. The low risk is not based on the amount of leverage but the chart itself.
Notice the low 3-Feb., there is a higher low 7-Apr.
If you can open a position that is safe above the 3-Feb. low, then this would a low risk position and can work for the long-term.
The falling wedge pattern and the two green candles are also great. The previous session and the current active session.
Since we already looked at Cardano in detail, let's focus on the full trade-numbers for this chart setup. Most of the targets should hit within months.
_____
LONG ADAUSDT
Lev: 5X
Current price: $0.6637
Entry levels:
1) $0.6800
2) $0.6300
3) $0.6000
4) $0.5710
Targets:
1) $0.7000
2) $0.8213
3) $1.0130
5) $1.1508
9) $1.8300
12) $2.6500
13) $3.4620
Stop-loss:
Close weekly below $0.5600
Potential profits: 2110%
Capital allocation: 5%
_____
This chart setup can also be approached with 3X since it is already moving.
The amount of leverage you use will depend on your own risk tolerance.
Leveraged trading is high risk. High potential for rewards but also very high risk. This is a game not for kids. This is for adults. Mistakes can result in a major loss. Good decisions can result in big gains.
If you enjoy the content, consider hitting follow and leaving a comment.
Boost also to show your support.
Thank you for reading.
You are appreciated.
Your support is appreciated.
I am here working for you for the long-term.
Namaste.
XRP 5X Lev. Full PREMIUM Trade-Numbers —New Entry (PP: 815%)When the market is over-leveraged, when there are too many people out of control, you can feel a kind of tension; anxiety in the air... Sure enough, the market starts to shake and all these over-leveraged hands are removed. Once removed, the market becomes calm... Can you feel the calm? It is as if the gamblers are now gone.
Good morning my fellow Cryptocurrency trader, we have many charts, my leveraged trades, all green. We have second entries for BTC, ETH and ADA but none for XRP.
So, if you missed the first one, here is another one... It is risky, but the show must go on.
We are set to experience a very strong wave of growth. Getting in before the breakout can be live changing, just keep in mind that nothing is certain, leveraged trading is high risk. High risk vs a high potential for reward.
The signals here are not strong, but I believe we have very good timing, and if the timing is good, the price must also be.
_____
LONG XRPUSDT
Leverage: 5X
Entry levels:
1) $2.45
2) $2.35
3) $2.30
4) $2.26
5) $2.07
Targets:
1) $3.05
2) $3.40
3) $3.82
4) $4.08
5) $4.50
6) $5.18
7) $5.67
8) $6.29
Stop-loss:
Close weekly below $2.05
Potential profits: 815%
Capital allocation: 3%
_____
When the market calms down, it means that no more gamblers are around. When no more gamblers are around, the growth process can continue.
This is an unconventional signal, but you can't deny the change. One day, everybody is going wild, the next day, only the usual suspects remain.
When the market grows and moves to resistance, everybody wants to go LONG. When prices are low, people tend to detach and ignore. It is the other way around, sell at resistance and buy at support.
Time to go LONG.
Namaste.

Pepe 5X Lev. Full PREMIUM Trade-Numbers (PP: 1670%)The market always offers a second chance. The full trade-numbers below have targets up to 0.00003381 for a maximum profits potential for 1670%. The chart goes higher and reaches 2235% (0.00004264) and 3715% at 0.00006575.
How far up it goes and how fast is for the market to decide.
These trade setups are good if we can catch the bullish breakout, once the breakout is in, the rest is an easy wait.
I know some people that are happy to secure their trades after 200-300%, some even at 100%. Others wait long-term because these are awesome chart setups and can reach much higher. In past cycles we've done trades with more than 10X easily. This is one of those.
The question is, will it hit or will it fall?
The market always offers a second chance and a second chance is upon us, now.
Full trade-numbers below:
_____
LONG PEPEUSDT
Leverage: 5X
Entry levels:
1) 0.00000810
2) 0.00000715
3) 0.00000690
4) 0.00000630
Targets:
3) 0.00000867
4) 0.00001071
5) 0.00001222
6) 0.00001408
7) 0.00001681
8) 0.00001953
9) 0.00002342
10) 0.00002836
11) 0.00003381
Stop-loss:
Close weekly below 0.00000625
Potential profits: 1670%
Capital allocation: 5%
_____
Why Pepe and not some other Altcoin?
I shared trade-numbers for you for pairs as varied as Bitcoin and Ethereum, Notcoin and Dogs, Solana and Filecoin, Pepe, EOS, XRP, Cardano and Compound, to name a few. The truth is that I pick what in the moment looks good.
Market conditions can always change, but at the time of writing the chart looks great.
Notice that the action is 100% full red, that's the time to buy as I always remind and say; Buy when prices are low or trading near support; buy when the market is red.
The market is red now and that's the time to buy before a reversal happens. You will see, our time to sell comes when the market turns green.
Many average players will do it in reverse, right now they are selling and they will buy at the top of the bullish wave. I know, it is tempting, it is the market impulse but we have to learn to control our emotions if want success in this game.
There is risk involved. Leveraged trading is for experts only.
Thanks a lot for your continued support.
Namaste.

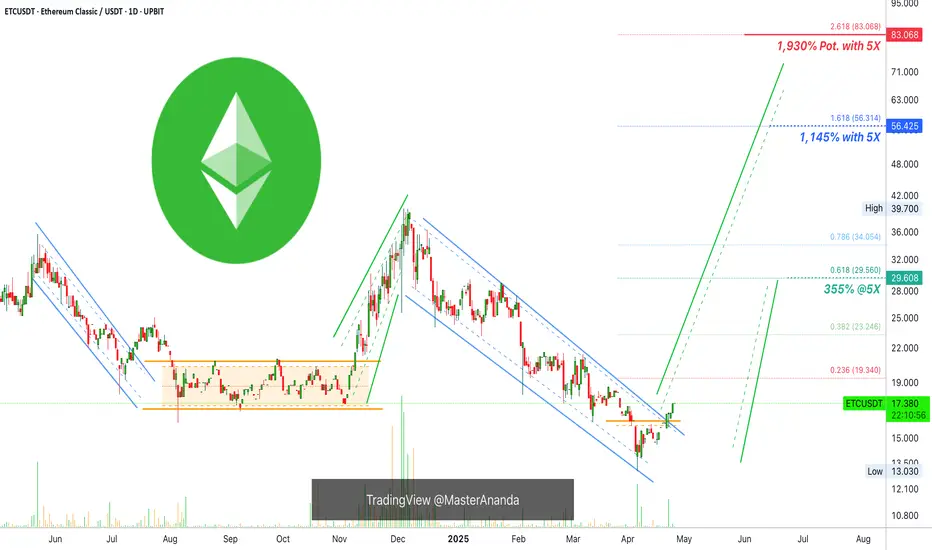
Ethereum Classic 5X Lev. Full PREMIUM Trade-Numbers (PP: 1930%)Good afternoon my fellow trader, I have another one for you.
This is a high probability trade setup.
This is a high probability trade and is easy to take.
Two main guess to approach this set of numbers:
1) Buy and hold and wait until 500% up and take profits. 500% profits not a rise of 500%.
2) Wait until the final target patiently and collect the full bounty for this trade.
There are many other ways to approach these numbers and this is up to you. But the time is right now... It will be months before the charts produce conditions like ones available today, similar and years before something like this is repeated. This opportunity does not present itself often.
Full trade-numbers below:
_____
LONG ETCUSDT
Leverage: 5X
Entry levels:
1) $18.0
2) $17.0
3) $16.0
4) $15.0
Targets:
1) $19.1
2) $23.1
3) $26.3
4) $29.5
5) $34.1
6) $39.9
7) $46.4
8) $50.3
9) $56.8
10) $67.2
11) $74.6
12) $84.1
Stop-loss:
Close monthly below $14.5
Potential profits: 1930%
Capital allocation: 4%
_____
In several months, not many but just 2 full months maybe we will have the first high. This high will be followed by a correction and once this correction is in we will have similar conditions to now but not as good because bottom prices won't be available for more than a few hours or days at max.
To repeat the same situation we have now across all Altcoins, it will take years, when the next bear market hits bottom. And then it will repeat again before the next bull market around 2029 or 2028. So this is a solid opportunity for you to take.
Leveraged trading is for those with experience already with some form of trading. After you trade for a while, you can engage this tool and not produce many loses while learning. If you start with leverage right away, you might end up quitting in disgust with tons of losses. So make sure to be smart when approaching this tool as there is the risk of becoming an addict and major losses.
If you have a messed up mind and life and need money, stay away.
If you have a good life, you feel grateful about the air you breathe and you can see the stars, the moon and appreciate a simple breeze, you can make huge money with this system.
If you lie to people and to yourself the market will take everything away. If you are honest with yourself and can accept your mistakes, it doesn't matter what you do you will be successful in the end. It is all a mental game.
What's on your mind?
Depending on your thoughts, you produce your results.
Think positive, love yourself and love life, and you already won.
Being ungrateful, hating and with a bad mood always for this or that, blaming others, the market will take everything from you. It will only give you space to breathe once you see yourself and accept your mistakes.
You are responsible for your own actions.
This is not financial advice.
You are appreciated and thank you for reading.
Namaste.