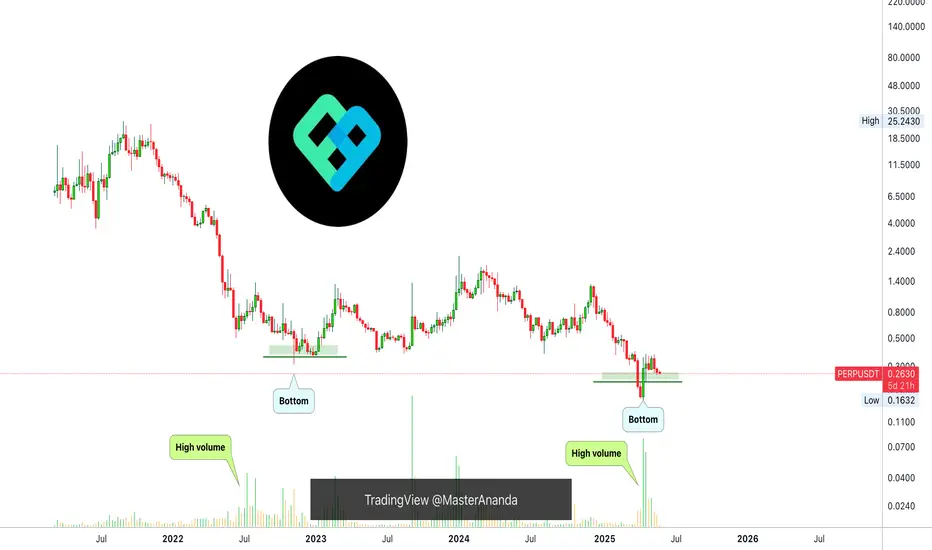
Perpetual Protocol Not Dead Yet (TAC-S7)Doesn't look good. If you follow, you know that I mention the mid-March low and the 3-Feb. low. A bullish reversal signal we've been tracking moves around these levels. When a pair recovers above one of these, or both, after the 7-April crash we take it as bullish.
PERPUSDT looks bad because it is still trading below both lows, March and Feb. There is a positive signal though, there is really high volume in early April, and this is really high.
This can signal that the low is in and the current retrace will end as a higher low. Needless to say, this would be followed by a wave of growth.
Another interpretation can be around one final drop for this pair, say it gets delisted from a major exchange, this causes one more flush, huge flush, and only after this flush we can experience growth. This is just a possibility. The chart is weak and does not have many signals that support a recovery but, the market is one. What one does, the rest follows. And the volume is in.
PERPUSDT doesn't look good, but everything can change in a matter of weeks, 2-3 weeks.
We can revisit again and see what the chart says. Still, if you are confident in this project, there is room to accumulate. If you have many options and have to choose, many, many pairs look better than this. While this isn't a sure miss, it is better to go with those with lower risk. Some have lower risk or stronger bullish signals which means that these can move sooner or with a higher level of certainty.
Namaste.
Altcoins
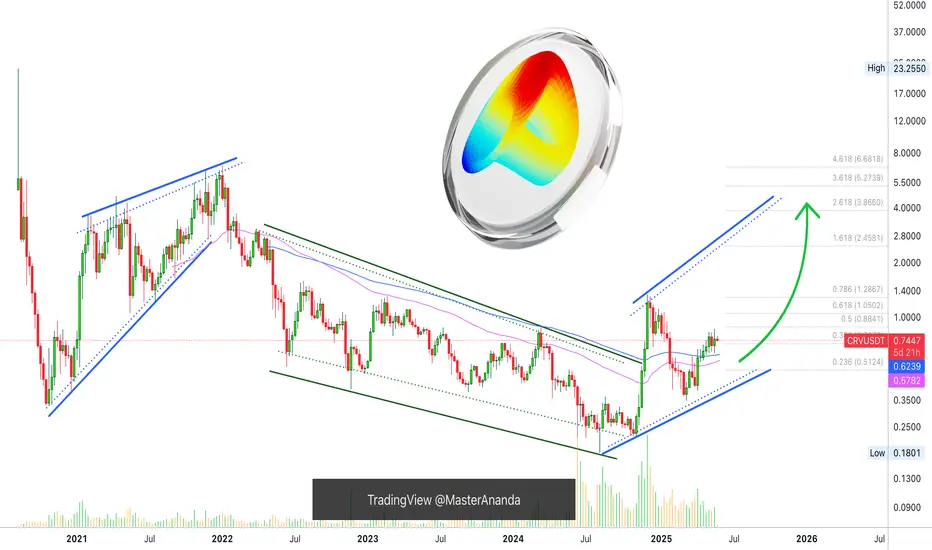
Curve Enters Bullish Trend (TAC-S7)Curve started dropping in Jan. 2022. The chart doesn't look great at a first glance but there is some positive news.
The downtrend that started in Jan. 2022 ended in August 2024. This date marked the all-time low. After August, there was a higher low in November (2024) and then again a strong higher low in March 2025. That's the good news. The good news is that the market switched from lower lows to higher lows. So, what was then a downtrend can now turn into an uptrend, the next advance and higher high will make it so.
Long-term weekly time frame CRVUSDT is trading above EMA55 and EMA89. Boom. These levels were first conquered in late 2024 then the drop and recovery above this year signals that the bulls are now in control.
So everything is clear in a way, all that is missing is the next bullish wave. This is what we are expecting and this is what is certain to happen next.
As soon as Curve-Tether moves up, producing a high higher than December 2024, this will confirm the change of trend. The first time an uptrend shows on the chart since 2021.
Namaste.
Top 10 Altcoins Yet To Move, Strong Growth Potential —CommentI am making a list of TOP 10 Altcoins that are yet to move. These are not the ones with the highest growth potential nor anything like it but a selection of pairs that are yet to move strongly thus low risk vs a high potential for reward.
Let me give you some examples and then I will share the instructions below.
» PEPEUSDT grew some 200% already. This is awesome but it wouldn't be in the TOP 10 yet to move because it already grew strongly. It has plenty of room left available for additional growth but the higher it trades, the higher the risk.
» ETCUSDT grew less than 70%. This one is still trading low so it has huge potential for growth, it can be part of the TOP 10 Altcoins yet to move.
Let me give you another example:
» DOGSUSDT grew 150% already. It is currently trading below the last high of course but this one wouldn't make it in the list. We already jumped in early so we look for other pairs.
» AVAXUSDT grew a maximum of ~80% and is now trading only 55% higher compared to its 7-April low. This can be in the set of the TOP 10 Altcoins yet to move. Makes sense?
Like this, I will make a list.
If you are interested, leave a comment with "Share the TOP 10 Altcoins Yet Move" and if there is enough interactions I will do this post for you.
I can take a while because I will go through hundreds of pairs. Depending on how much interest there is, I can do another TOP10 and another TOP10, 3 sessions total, because there just too many Altcoins that are looking great and yet to move.
Sounds good?
Leave your comment below and let me know.
Namaste.
CETUS Hack Giving Opportunities Within SUICRYPTOCAP:SUI SUI is one of the fastest growing L1 chains. Previously extreme intra SUI dominance within swapping volume by KUCOIN:CETUSUSDT CETUS. This hack is a direct threat to the confidence of not just the application but the chain itself just like Ethereum was exposed during the MakerDAO hack.
Volume market wants to know their funds are secure to certain degree and predictable. Volume flow is more than fine with centralisation, esp with low barriers. Should the deposits be mostly secured and exploit fixed then it can bring confidence roaring back not just to CETUS but more importantly, SUI.
CETUS dominance within SUI is falling to rising applications. My favourite is Bluefin with its low barriers to account creation like google login. KUCOIN:BLUEUSDT BLUE has rising dominance within SUI volume market.

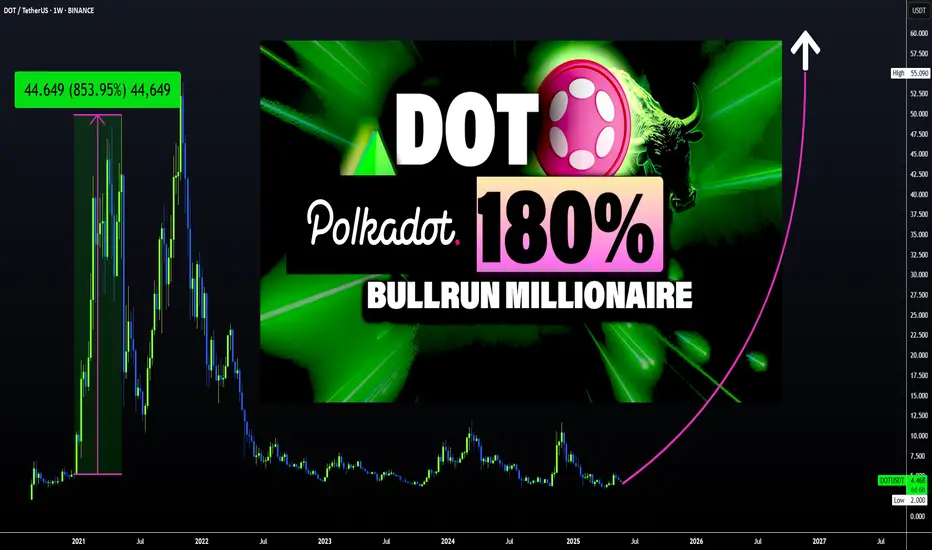
DOT has HUGE UPSIDE Potential | PolkadotPolkadot could be a late bloomer this season, but there's still much room for growth on this altcoin.
Taking a look at DOT from a macro timeframe, we clearly see the bearish cycle after the ATH, and then a bottom out when we start to see the price making higher lows.
This undoubtedly shows us that Polkadot IS CURRENTLY bullish - even though we're not seeing the big increases just yet. After a retest here in the pointed out area, it's likely DOT can run. DOT and other alts will likely retrace as ETH gears up and starts increasing, before they get their turn to run:
It should be noted that DOT is trading over 1000% away from its previous ATH. And even though that may be a stretch, I'd be happy with a 100%!
Don't miss the SOLANA update with a trade setup 🎁 :
____________________
BINANCE:DOTUSDT
Another reversal coming (Altcoins Market)A reversal at the blue box zone has already occurred. Now, we’re looking at a potential minor reversal, pay close attention between Tuesday and Wednesday. Why does this matter? Because the fastest and safest way to make money is to buy low and sell high.
I usually exit when it becomes highly overbought or reacts to key support and resistance (SnR) zones. Currently, I’m not holding any major positions, except for a few memecoins.
Once the price reaches the red box area, I’ll be loading up. This time, I’m choosing CRYPTOCAP:BNB and $APT.
Don’t ask me why, I just am.
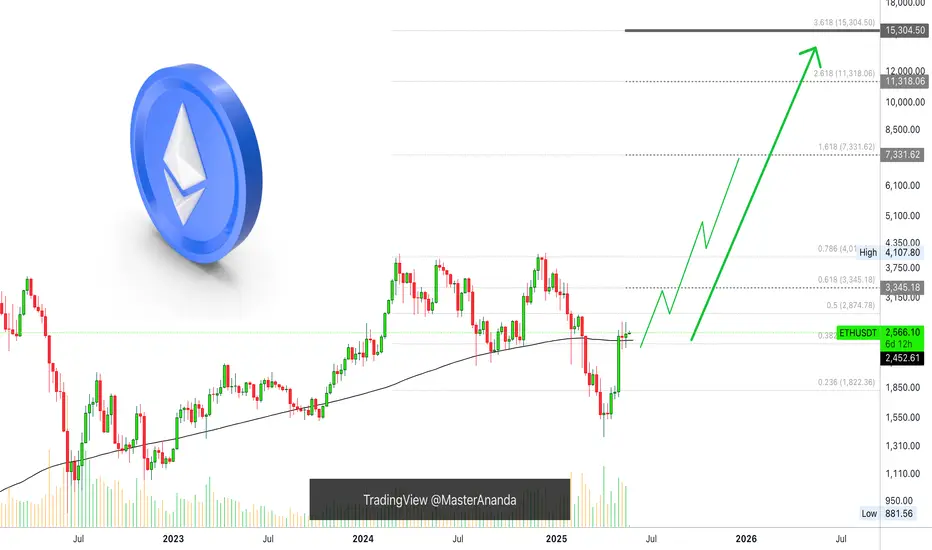
Ethereum Breaks Above MA200, Long-Term Bullish Cycle ConfirmedThe 5-May week marked not only a major advance and recovery above the August/September 2024 low prices, but it also signals a recovery for Ethereum above MA200 long-term, weekly timeframe.
This simple signal confirms that the bulls are in. But there is more.
After breaking above this level, Ethereum closed two additional weeks green above it, both times wicking lower but recovering. So this level has been conquered, retested and continues to hold. This means that we have at least 6 months of bullish action confirmed based on the chart, technical analysis.
There are also some great signals based on the long-term.
» RSI: The weekly RSI has a strong reading (bullish) and produced a major higher low compared to June 2022. This signal matches what happened at the end of the previous bearish cycle.
» MACD: The weekly MACD also produced a long-term higher low compared to July 2022 coupled with a bullish cross. This indicator is trending full-upwards and leaves no room for doubt. Ethereum is set to grow long-term. Let me show you the MACD...
What would you do if you knew, with a high level of certainty, that Ethereum will trade at $7,000 or higher this same year? How would you take action? How best to profit from this knowledge/information?
Namaste.
26/05/25 Weekly OutlookLast weeks high: $111,965.73
Last weeks low: $101,994.78
Midpoint: $106,980.26
New BTC ATHs! Well done to those who capitalized on the move and continue to believe in this Bitcoin.
For the last two weekly outlooks I have talked about the pattern of consolidation for 1 week --> expansion the next. Last week We got our expansion week right on queue and this time around BTC made a new ATH hitting just shy of $112,000.
Should the pattern continue this week will be a week of consolidation/chop, however this week is different now that we're at ATH levels. My gut says a pullback is coming after such an aggressive move up with almost no pullbacks at all.
Should BTCs price drop below the Midpoint I think there will be a big struggle to continue this rally in the short term. Initially target would be weekly low and main HTF target would be $97,000 IMO. That would be a healthy pullback to continue the rally.
For the bulls you don't want momentum to stop in the short term, flipping $110,450 and weekly high would put BTC back into price discovery, once any asset is in price discovery it's very difficult to tell where the sell pressure will come from and so shorting becomes very risky.

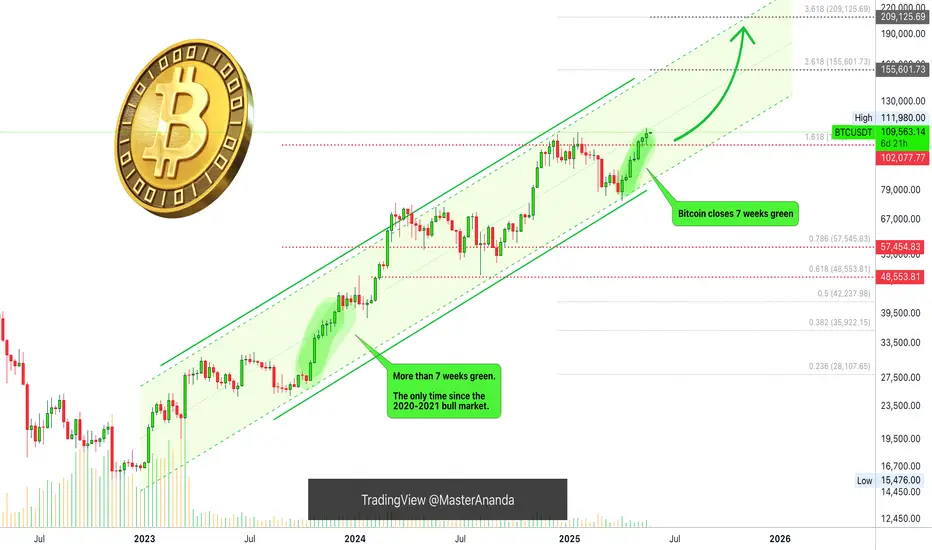
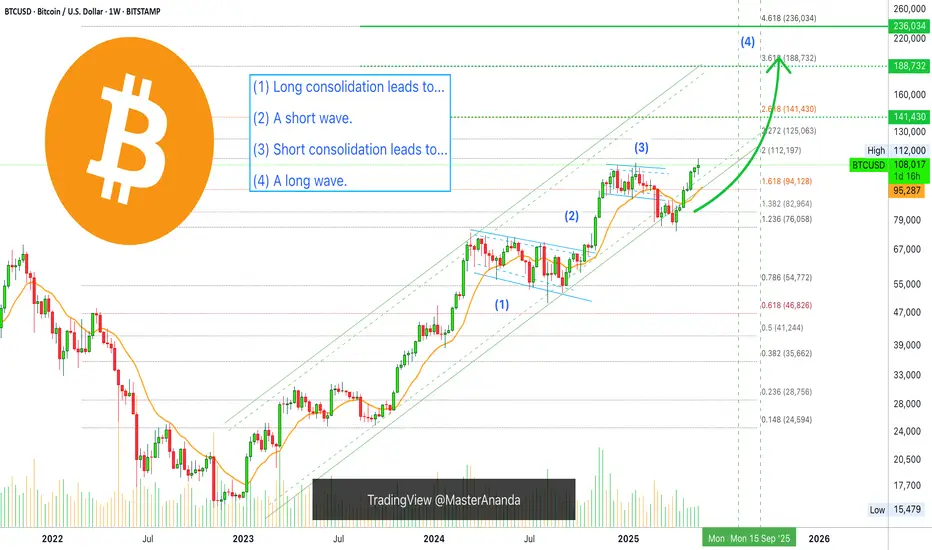
Next Step $155,600, Bitcoin Closes 7th Week Green +AltcoinsThe next target and major All-Time High has been confirmed as $155,601.73 for Bitcoin and this isn't likely to be the end of the bull market. This target is now confirmed after Bitcoin wicked lower on the weekly timeframe to test support but ended up closing green, the 7th consecutive week Bitcoin closes green.
This is a major, major bullish signal. It means one thing only, the demand for Bitcoin is just too strong. So strong, that nobody is willing to sell, at least not for longer than a few hours or a few days.
Sold at 100K? Good! Buy back in but higher.
Sold at 105K? Bad! Bitcoin continues rising.
Bought below $80,000? Congratulations, you are a genius and you are holding a great position, you have months and months of bullish action yet ahead of you.
Bought below $90,000? You are still good, you are wise, you are great. You have to congratulate yourself and know that all the gains you receive you deserve. You bought when the time was right, you bought regardless of what the others said.
Bought at $95,000 or lower? There was higher risk because resistance was strong right in front, 100K-110K, and yet, you took action, now you will be rewarded for being brave. The market will bless you with tons of profits and continued success.
Missed the Bitcoin bus? There is absolutely no need to worry, at all, because the Altcoins market is still trading near its bottom and is soon to grow; What one does, the rest follows.
The Altcoins market will follow Bitcoin. The Altcoins will move to strong highs, new heights and new All-Time Highs.
It is not too late... Crypto (Bitcoin & The Altcoins) is going up!
Namaste.
Sideways Still in Play for ETH After RejectionIf you find this information inspiring/helpful, please consider a boost and follow! Any questions or comments, please leave a comment!
Recap
Ethereum just tapped into a key Area of Interest and got rejected. The move confirmed short-term resistance while keeping the broader wave structure intact. Although no clear breakdown has followed, the rejection signals that the asset is still mid-cycle.
The expectation now is for a sideways consolidation. This aligns with a developing wave 4, but the price action ahead will determine how this structure unfolds.
Wave Structure
At present, the count favors a completed wave 3 followed by a wave 4 that is still forming. The rejection at the AOI fits the narrative of a corrective structure underway. Whether that plays out as a triangle or a flat will depend on how the next legs print.
Key markers are in place:
AOI was respected
No breakdown of the prior key support level
Above the 0.382 to 0.5 retracement zone remains in focus as a reaction area
Should price expand beyond typical retrace/time boundaries, the degree of the count may need to be adjusted. A more complex correction or a deeper reset could shift the current interpretation from a wave 4 into something more substantial.
Outlook
• Rejection confirms resistance
• Expecting sideways movement to continue
• Watching the 0.382 to 0.5 zone for key price behavior
• Price action will determine the next wave structure
• If momentum expands rapidly, degree reassessment is on the table
Ethereum’s current posture suggests a market in digestion mode. Whether this leads to a launch into wave 5 or deeper corrective behavior, the next prints will be critical. No confirmation of bullish continuation yet.
More updates soon as the next leg develops.
Trade safe, trade smart, trade clarity.

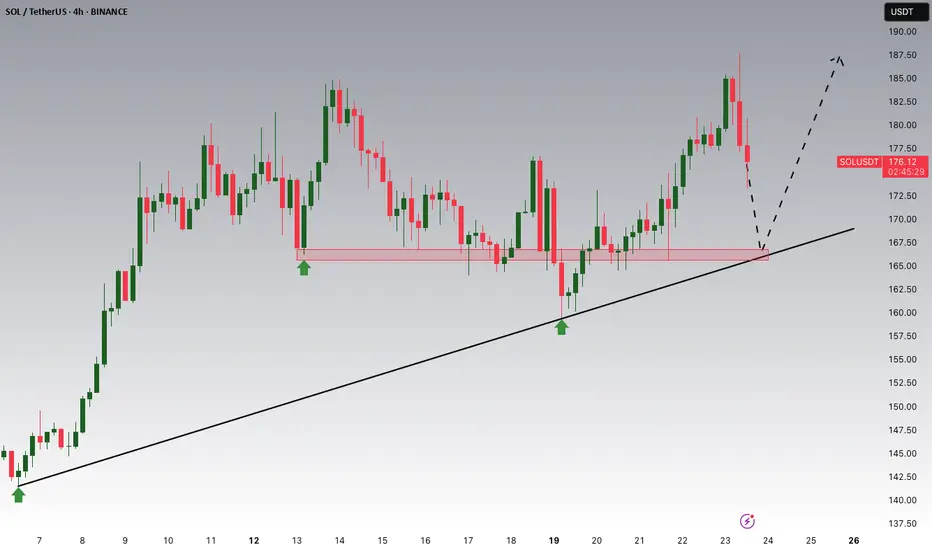
Solana Potential UpsidesHey Traders, in today's trading session we are monitoring SOL/USDT for a buying opportunity around 166 zone, SOL/USDT is trading in an uptrend and currently is in a correction phase in which it is approaching the trend at 166 support and resistance area.
Trade safe, Joe.
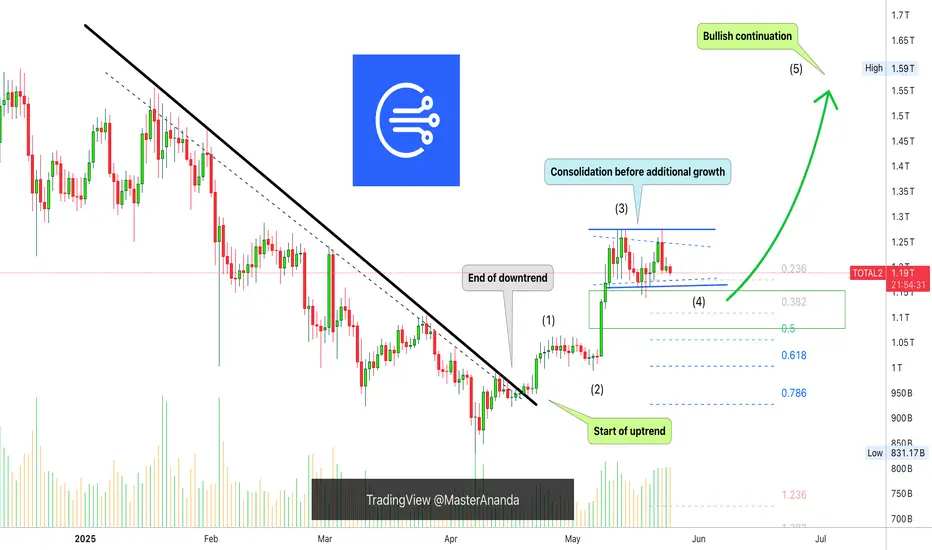
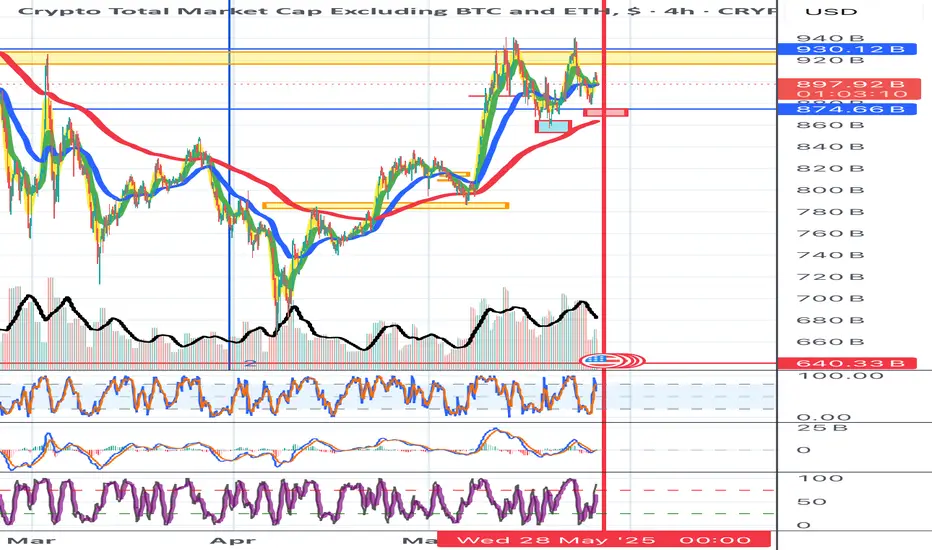
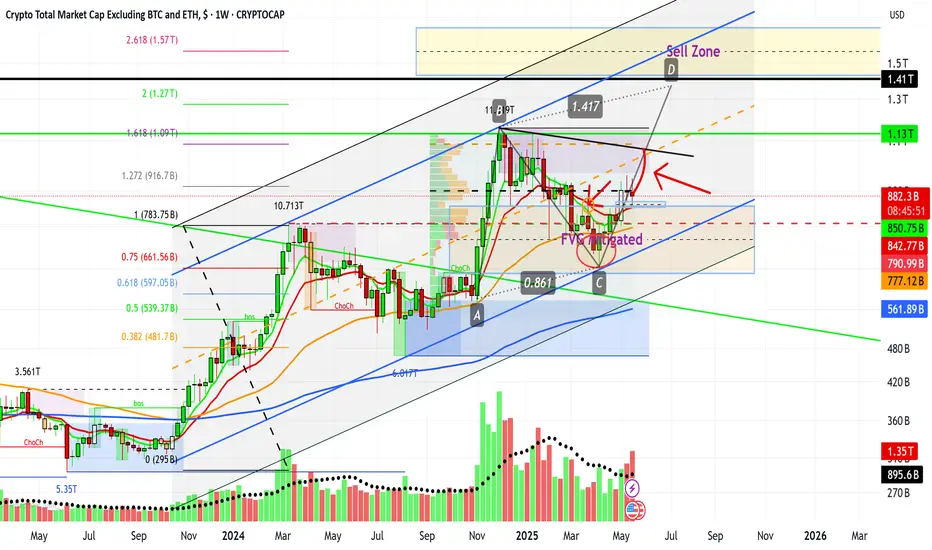
Total3 Crypto Market CapWe know very well that Trump, at the moment, is able to move markets overnight. We also know well that such a market is difficult to navigate.
Nevertheless, we do have chart indications, as in this case:
- volatility, money inflow and others are in the middle.
- on the weekly, Total3 has bounced from the underlying structure, which may signify strength.
- the candle resting on the weekly FVG will be closed later.
- the indicators look good but not too good. Based on some altcoins (weekly), I see hope there.
- gray and delicate situation.
- best strategy: scalp, small profits, buy the dip and hold. Little or no leverage. Don't get hurt.
I will update to keep you posted on developments.
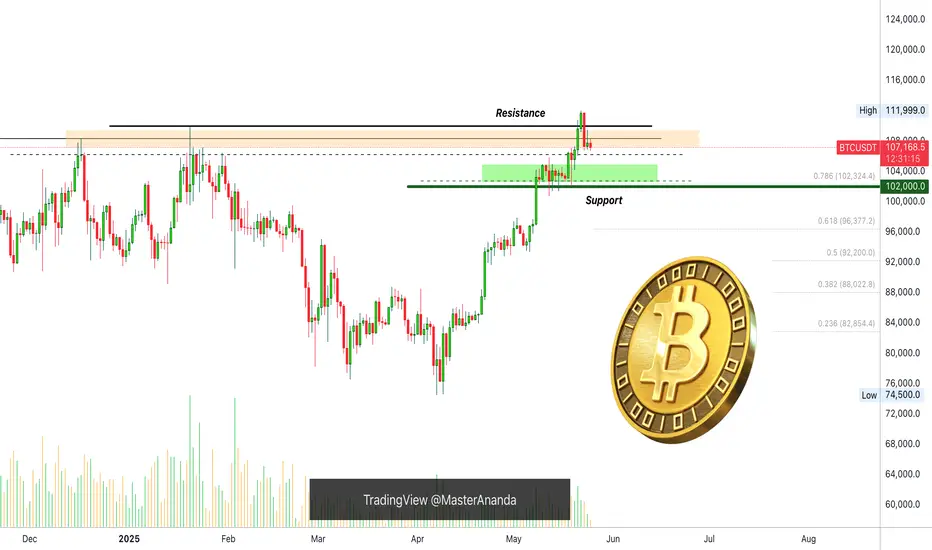
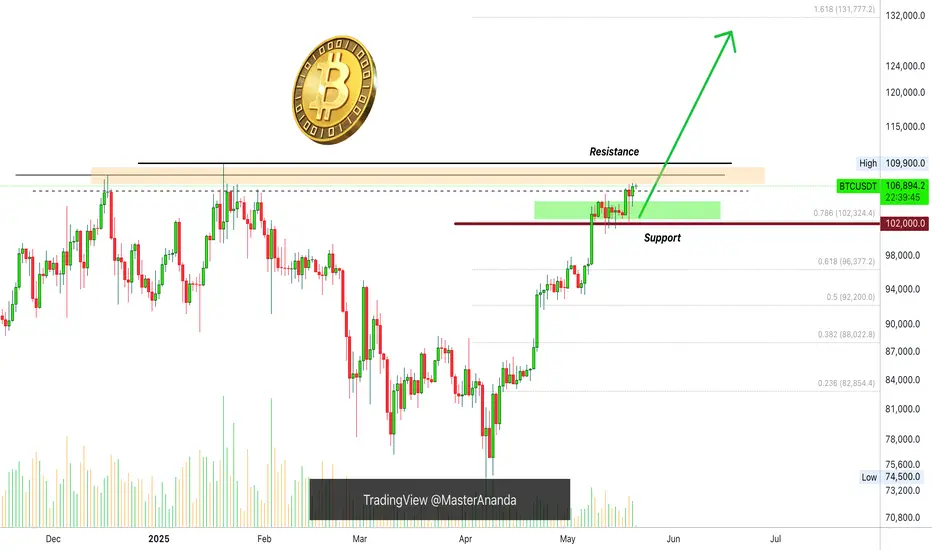
Bitcoin Double-Top & $60K Correction ExplainedPeople are showing Bitcoin producing a double-top or shy higher high and then crashing down to new lows. This is a strong fallacy. Here we can see Bitcoin trading above $102,000 for 12 days before moving higher, this creates a support zone. (Green on the chart.) Bitcoin can easily consolidate above this level before moving higher. All the action in mid-December 2024 and late January 2025 also makes this zone a very strong support zone.
Before Bitcoin trades at $60K or $70K for example, it needs to break below $100,000. For Bitcoin to break below $100,000, it first needs to challenge $102,000 which is a super strong long-term support.
For Bitcoin to move below $102,000, it needs to break below $105,000. What Bitcoin is doing now, is simply consolidating the last advance, preparing for additional growth.
Notice that there is no huge bear volume candle after the new ATH. Also notice that the red candle happened the day after the ATH and not the same day. Bitcoin is not set to crash. Bitcoin will continue growing.
Remember, the FED will lower interest rates next month and this will be the boom (catalyst) that will push the Cryptocurrency market to the stars.
Namaste.
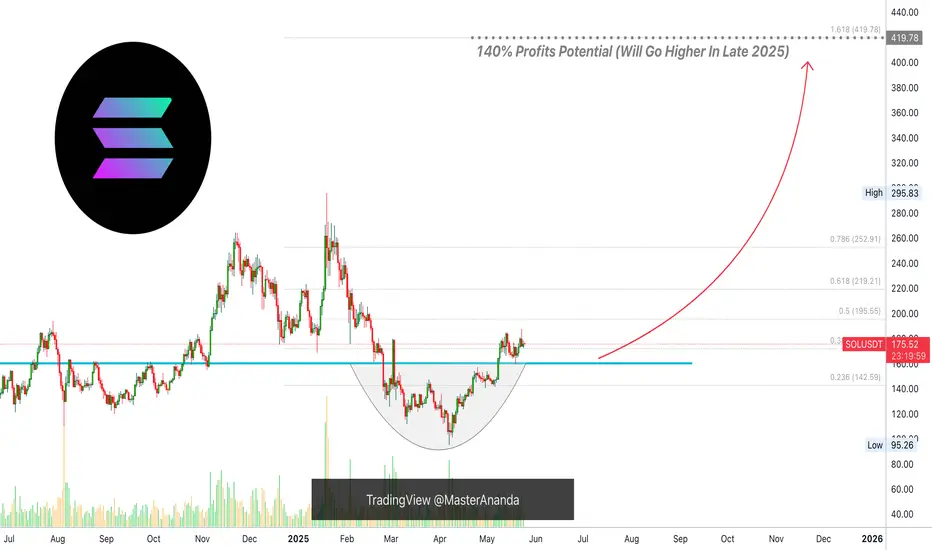
Solana, Consider The Bigger Picture —$420 Isn't The Final TargetThe day before yesterday, based on session close, 23-May, marks a strong rejection from resistance, a mild resistance I should say but, this doesn't change much or anything when it comes to the bigger picture and what we expect in the coming weeks and months.
Good evening my fellow Cryptocurrency trader, I know it is Saturday night but still, it is fun to work.
When in doubt, zoom out... What happens if there is no doubt?
Well, when there is no doubt, rest easy and buy more. Hold easy and profits will come.
Notice the blue line on the chart. This line marks the low from 19-May. While we had a rejection 23-May there is absolutely no bearish action on this chart. The following day, yesterday, was neutral and we will see what the market does today.
The action is happening pretty high compared to the 19-May low. This low is the main support zone and also the baseline of our rounded bottom. $160. You can say that Solana is truly bullish above this level. If it moves below, nothing happens because this isn't likely to happen but if it happens it simply means a market shakeout or bear-trap is taking place. Why? Because we are bullish now, the bullish bias has been confirmed and we will see growth long-term.
Are you aware that interest rates, by the FED (USA), will be lowered next month? This will be used as the catalyst for the Cryptocurrency market to produce astounding growth. When this event happens, you should be fully invested, "buy like is the end of the world" remember?
That's the situation in which we are now. Prices are still low.
Prices are not low as in trading at $100 or $110. But you will consider them super low when Solana starts trading at $300 or higher.
Here is the thing, when the rise happens it will be so sudden and so strong, that you will be wondering, "why didn't I buy when prices were low?" "Master Ananda told me so many times, so many charts..."
It is not too late. Cryptocurrency is set to grow. Long-term.
Thanks a lot for your continued support.
Namaste.
Bitcoin Hits New High Thanks Mars & Saturn: Bearish Or Bullish?Based on new data that is available just now, the daily action and the Altcoins market is Bitcoin considered to be bullish or bearish coming from TA?
Bitcoin just produced a new ATH based on candle close, 20-May, higher than 18-May at $106,855. Resistance continues to be challenged, the more challenge the weaker it becomes.
Market conditions are bullish of course, we have now the same situation as in late April and in late April we were witnessing a bullish continuation and prices moved up. Remember late May? That's the time when everything Crypto goes bullish and bullish it is already just hyper-bullish not yet.
A new All-Time High is bullish enough I guess but Bitcoin will continue growing we have very good dates 22 and 24 May. And then the rest of the month for additional growth. This is only the start.
But, will Bitcoin continue straight up or is there room for a retrace?
That's being a bit too greedy but ok, let's study the chart an answer. There is room for a small retrace but this type of retrace is low probability, why? Many people would be waiting for such a move and since this is easy to see and expect the market movers tend to move in a way that people cannot predict, which means straight up. Most people would think that straight up is too much, there must be some relief and so, instead of betting up they bet down short-term but this never works because all the bears are thinking the same. The whales are smart and know how to play. Once the "go" button is on, it is on and Bitcoin grows non-stop until the next major resistance zone.
I identified for you the most strong support level ultra long-term, based on numbers from 2022-2021 and that's $102,000. This level cannot fail weekly/monthly timeframes.
Now, my idea is that Bitcoin will continue growing straight up. There is just no time for retrace, Bitcoin is being magnetized by an incredible force. Bitcoin is being guided by Mars and Saturn and both of these planets are saying up!
Namaste.
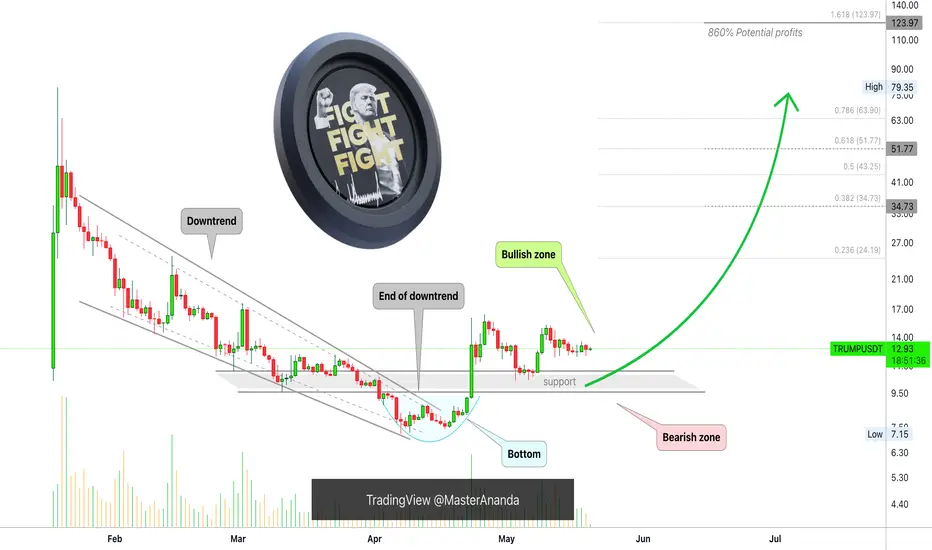
Official TRUMP Dinner PUMP?Many Altcoins, specially memecoins, in the past few weeks were growing strongly, is OFFICIAL TRUMP being suppressed?
Let's speculate a little bit.
If you were Trump. No, if I were Trump, Master Trump or Alan Trump, and I have this upcoming event on 22-May. Would I want declining prices or a super-pump right at the same time the event is happening?
If I am a very powerful man and know the power of the media, would I want the memecoin that goes by my name to be super-pumping the same night, at the exact same time as the event goes on? Wouldn't this bring that much more attention if prices were to blow up?
What's your take? What do you think will happen?
The chart looks good for TRUMPUSDT, there is no reason why prices shouldn't be going up. Other pairs are similar, many very similar, but many others continued to grow.
Last week and the week before, it was all memecoins in the top performers. This week, somehow, this market behavior was shutdown and we now only have real projects at the top of the list, which is pretty good actually and refreshing.
Overall, these memecoins can cause real harm to the market. The exchanges can fix this by not listing and delisting but that's not the topic today.
TRUMPUSDT looks good, chart-wise, based on TA. It can grow easily and the action is happening within the "bullish zone."
Another one, the biggest candle since March is a bullish candle. And this is also the biggest candle after the All-Time Low. So the bulls have the upper-hand period. So TRUMPUSDT can grow.
But what about the dinner pump?
You think they are waiting and will buy heavily on the day of the event? Maybe a 100% jump?
I am curious as to what your opinion is, and I'll tell you mine... IT IS GOING UP!
Dinner or no dinner...
Thanks a lot for your continued support.
Namaste.
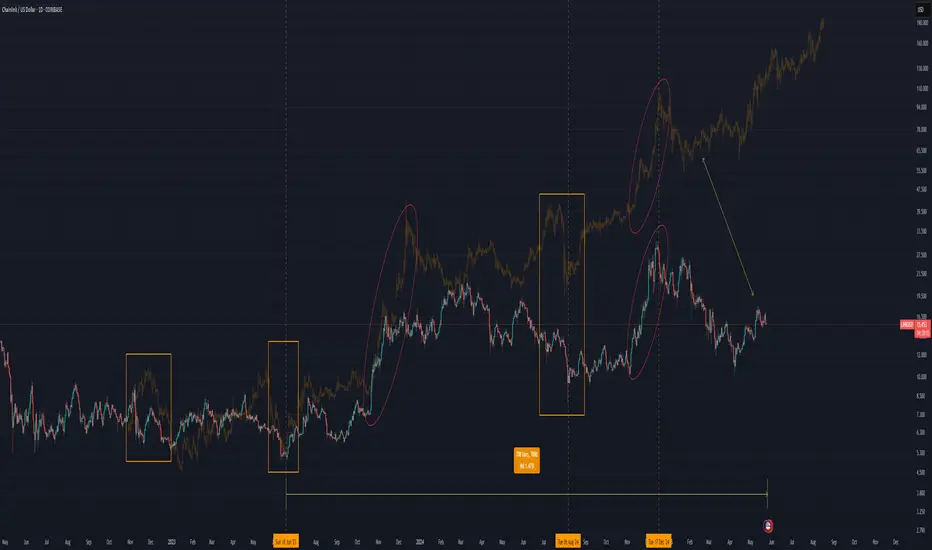
The Greatest Chainlink Bar Pattern in History: The Crystal Ball For over 700 days now, following this Chainlink bar pattern has been the most profitable bar pattern I have ever found since I began this journey — it’s literally been a map of the future.
But for the first time, there has been a massive deviation. Let me explain.
We must go back to August 2020.
According to the bar pattern, we’ve just completed the same move from August 2020 — but the big difference here is that this time, it’s taken over 100 days to complete, while in 2020 it took just 30 days.
So far this cycle, it's the biggest deviation yet. Which has me thinking: what if this cycle breaks the four-year cycle and we extend beyond the 1,064-day cycle that's supposed to complete in October 2025?
Without this recent deviation, Chainlink would have completed the cycle bar pattern in August 2025.
My Chainlink Time Fib has a hit on this time period — August 2025. Something could happen around this time. This Time Fib has had major calls before, although it has also failed in the past.
The new deviated timeline for the cycle top:
This is what it would look like if the deviated bar pattern was shifted. Could this be a major clue showing us the future again? Are we catching a glimpse of what’s to come?
According to this new timeline, Chainlink rallies slowly until October 2025 — which lines up with Bitcoin’s cycle completion date. Bitcoin has never passed 1,064 days in a bull market. The last two cycles took exactly that long. So it’s interesting that price appears to grind upward to that date and then roll over.
It continues to roll over and apparently has a major retest of the lows:
This shows a retest of $10 in December 2025 — forming what could be the biggest bear trap in history — before a massive rally in 2026 leading to a March 2027 top.
I’ll be watching Chainlink like a hawk this year. So far, it has led the way for me and made this cycle pretty easy to read. Is it possible that the major run happens in 2026?
Stay safe, marines. 🫡
MantraDAO Easy 810% Target —Sell High, Buy Low!Just as selling and profit taking happens naturally when prices trade high near a new All-Time High, buying also happens naturally at support.
OMUSDT was trading at a new All-Time High in February 2025 and smart traders and holders took profits. This taking profits results in a long-term higher low and a new buy-opportunity.
Always remember, never buy when prices are high up or after a strong bullish wave. Why? Because whales tend to sell when prices are high. Only buy when prices are low.
OMUSDT is trading pretty low right now compared to February 2025. We had 96% correction, but the correction bottom is still a very strong higher low compared to the start of the bullish cycle and wave. After the correction is over, which in this case is early May, we will have a new growth wave.
Easy target can be seen on the chart as 810%.
It can go higher and this is a new All-Time High. We are going with the easy target for this one. An easy trade.
Namaste.

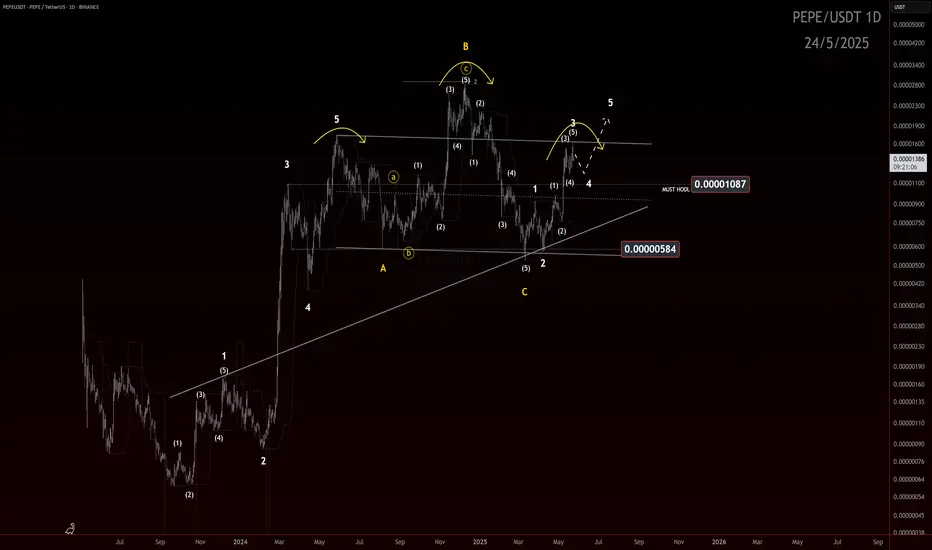
Impulse or Illusion? Key Level to Watch If you find this information inspiring/helpful, please consider a boost and follow! Any questions or comments, please leave a comment!
Recap
Since the price surge off the March 11 low, structure appears to be developing into a potential 5-wave impulse. However, with only three legs printed so far, it remains premature to confirm the full impulse structure.
Structure Assessment
The move resembles a possible ABC zigzag, but the center leg (possible wave 3) is showing strong impulsive characteristics — momentum, follow-through, and vertical lift. That raises the probability of it being an unfolding wave 3, rather than just a C wave.
What’s missing? A clear wave 4.
Until a fourth wave correction is established, and followed by a decisive wave 5, the bullish impulsive count remains tentative.
Outlook
📌 Key level: 0.00001087
The hold of this level will make the look of the structure ideal.
A break below 0.00001087 would dip into unacceptable territory for a developing wave 4 and opens the door to a bearish reassessment — and if the PA enters the price territory of the wave 1 cause a conclusive invalidation of the potential impulse.
✅ If price holds the level and a shallow wave 4 consolidates, we can then watch for signs of wave 5 to confirm the impulse and unlock bullish continuation potential.
Watch this level. Structure will confirm or collapse soon. More updates to follow.
Trade safe, trade smart, trade clarity.
Bitcoin Closes Red! Is The Bull Market Over?The end of the bull market and the start of a strong bearish cycle is now confirmed? That's the question that I received from one of my new followers based on much news all across the Cryptocurrency market.
How far down is Bitcoin going in this long-term, very strong, hard and surely-highly confirmed marketwide ultra-bearish correction? None.
I have news good for you, there is no correction, Bitcoin closed one day red. Yesterday's candle produced a 4.4% drop right after Bitcoin hit $112,000, a new All-Time High.
The truth is that Bitcoin just hit a new All-Time High and this reinforces the bullish bias for this Cryptocurrency market, it bolster the Altcoins market; Everything is set to continue growing.
What does $500,000,000 in liquidations, a new ATH and a 4% drop have in common?
Over-leveraged traders.
These are the only losers right now. In order to be liquidated after such a very small move it means that you were trading with more than 15X. That's it. The rest of the market is solid, everything else is strong and there is no need to fear; remember, retraces and corrections and an opportunity to buy-in, rebuy and reload.
Just wanted to tell you that all is well, the rise is not over, this is just a minor pause. Look back to late April, early May, mid-May and so on, the market can and does produces red days, it never moves straight down but neither straight up.
A new bear market now? FALSE.
Bitcoin will continue growing long-term. The Altcoins are on the same train.
A retrace can last a few days just as it can last a few weeks.
A correction can last a few weeks just as it can last a few months.
A bull market can go on for years, and we are in bull market territory now, so be ready and prepared for additional growth. Bitcoin is going up!
Rest easy and hold strong.
Continue to buy and accumulate the Altcoins.
This is not the end, it is only the start.
Namaste.
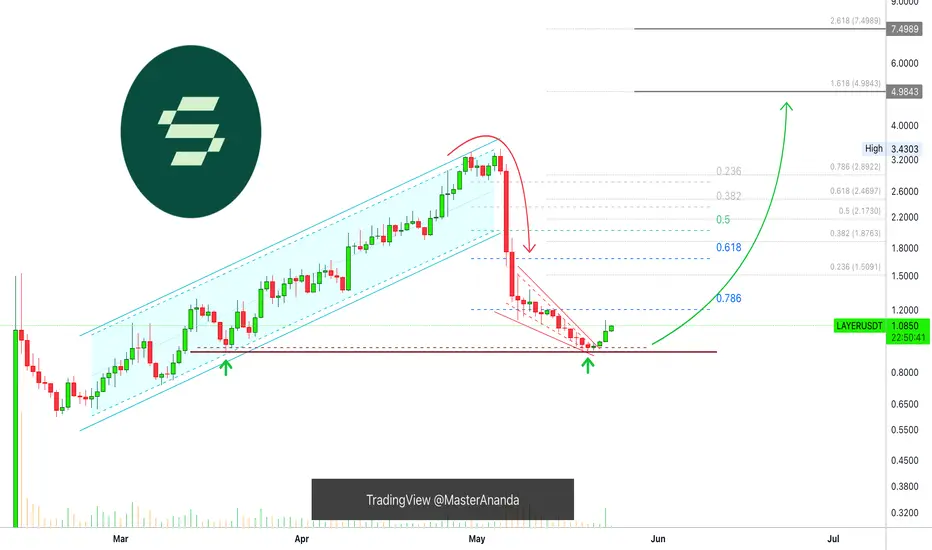
Got Correction? Solayer Buy Opportunity (PP: ~600%)A correction is not the end. Remember, when prices drop in a bull market this truly becomes a buy opportunity...
Good evening my fellow Cryptocurrency trader, I hope you are having a very nice day.
Here LAYERUSDT went through a strong correction, a fast correction but that does not matter, it is actually good news because prices are back to baseline and low prices means a new opportunity to trade.
Prices are back to the level visited in mid-March and the correction was more than 70% strong. What does this means? This means that the correction is over and there is room for a new wave of growth.
We have a volume breakout and support is found at a higher low.
Keeping it simple, Solayer is ready to grow.
Namaste.
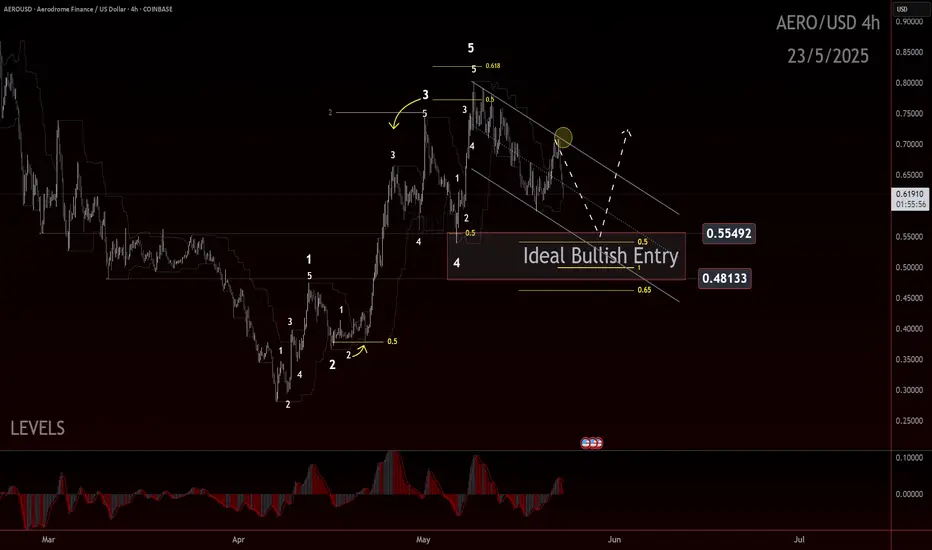
AERO: Coming in to Refuel… or Crash Land!? AERO: Coming in to Refuel… or Crash Land!?
📅 Date: May 23, 2025
🧠 Framework: Elliott Wave with Fibonacci structure
🔍 Context: 4H timeframe
🔁 Recap of the Move
AERO rallied off the 0.3465–0.3475 double bottom in what appears to be a clean 5-wave impulsive sequence. The price action respected both structural and Fibonacci guidelines:
Wave 2 and Wave 4 both pulled back to 0.5 retracements.
Wave 3 extended and subdivided with strong momentum, a common characteristic
Wave 5 completed between 0.5 and 0.618 of Wave 3 from the Wave 4 low — a textbook termination zone
Subdivisions within Wave 5 were also visible, including a smaller internal Wave 3 and 5, reinforcing the case for a completed motive wave.
⚠️ Current Price Behavior
Post-impulse, the market is showing signs of correction. This pullback could mark the beginning of a deeper retracement, or it may be the early stages of a new larger-degree impulse if the uptrend continues.
📏 Levels to Watch
Retracement zone: 0.54–0.49 (50–61.8% of the full move)
Upside resumption: Requires a strong bounce from the retrace zone and break of the Wave 5 high
🔮 Outlook
Two scenarios remain on the table:
Bullish: This is a Wave 2 retracement in a larger degree move. If support holds, a strong Wave 3 may follow.
Bearish/Neutral: The 5-wave or 3-wave structure is fully complete, and a deeper correction could be in play.
Confirmation will come through structure, not assumption. Keep watching how price behaves around the key retrace levels.
📣 Trade safe, trade clarity. More updates coming as structure evolves.
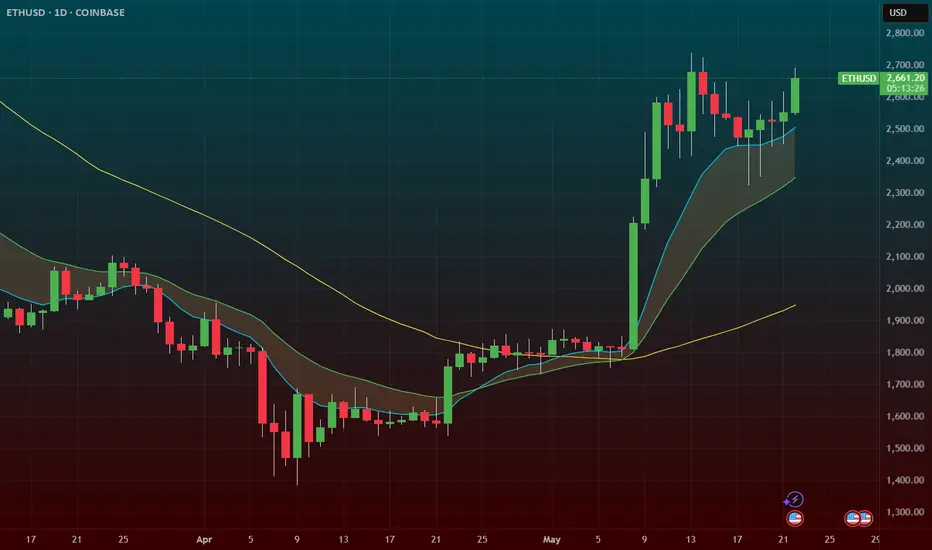
ETH (ethereum) – Massive Flag Pattern After 100% RunCRYPTOCAP:ETH – Bullish Flag After Monster Run
Ethereum ( CRYPTOCAP:ETH ) has nearly doubled since April, and now it’s cooling off — but in the best way possible: a bullish flag consolidation.
🔹 After a nearly 100% move, ETH has been consolidating tightly for two weeks — textbook flag behavior.
🔹 The trend remains strong, and this type of structure often leads to another leg higher.
🔹 Volume has tapered off during the flag — exactly what you want to see before a breakout.
Setup Overview:
Pattern: Large bull flag
Support/Risk: Defined risk to the $2500 zone
Measured Move Target: Breakout could push to $3100–$3500 based on the prior leg
Why I like this setup:
Healthy consolidation after a parabolic run
Risk/reward is favorable with structure and measured target
Potential breakout fuel from the ETH ETF narrative + BTC dominance rotation