XRP Failed Advance?The corrections are red yes?
An advance is green.
Consolidation is blue. In this case we have bullish consolidation.
Is this a failed advance?
No. So far the chart is saying that current price action is simply an extension of the consolidation phase. That is, XRPUSDT continues with a bullish consolidation. Sideways while growing slowly.
Four days red and no major retrace. Four days red is literally the maximum since August 2024.
This is an interesting signal. Since August 2024, XRPUSDT has never closed more than four consecutive days red. We can interpret this signal in several ways.
A red close today would lead to a green day tomorrow.
Today can produce any type of move, can be lower but as soon as the candle closes we can expect a green day next. That is because the market continues to fluctuates and it never stays the same for too long.
The green day doesn't have to be a big green candle but it can be the continuation of the slow bullish consolidation. The good news is that bullish consolidation will lead to a strong bullish advance at some point. The bad news is that it tends to become boring to wait. Prices are not growing super fast but it is growing and this is were most people make mistakes.
Beginners want to see 100% growth daily or else nothing is happening but that is not the case. XRPUSDT has been growing since 7-April and look at this, more than 60% growth in a month. With a good entry at the low this can translate into huge profits and that's how it goes. It can grow slowly but surely for months and then boom, out of nowhere a sudden jump. But still, it is growing daily and that's what is most important if you are holding this coin.
It will keep on growing and that's an easy call.
Namaste.
Altcoins

Bitcoin, Higher Prices Or What? How Likely Are Markets To Crash?You cannot deny that the market can crash any day right? What to expect?
Should I be worried?
Last time I was feeling all good and all was well and then suddenly a flash crash showed up and my position was gone. I lost all of my money because of my stupidity of course, I couldn't blame the market because the market did not put the leverage on my position, it was all me, so what now; will it happen again?
You cannot get liquidated if you have less than 5X leverage on your position when the market goes sideways. The squeezes, shakeouts and swings normally take out positions with 10X or more.
You cannot get liquidated if you are LONG but buy when prices are low, near support.
You can get liquidated if you are buying when prices start to rise without a plan on an impulse. The market is shaking just for you.
You will definitely get liquidated if you are trading continually with 20X. There is an entire set of experts, professionals and programs buying and selling just to distract you and when you get distracted BOOM!, out of nowhere money forever gone, namaste.
» Bitcoin
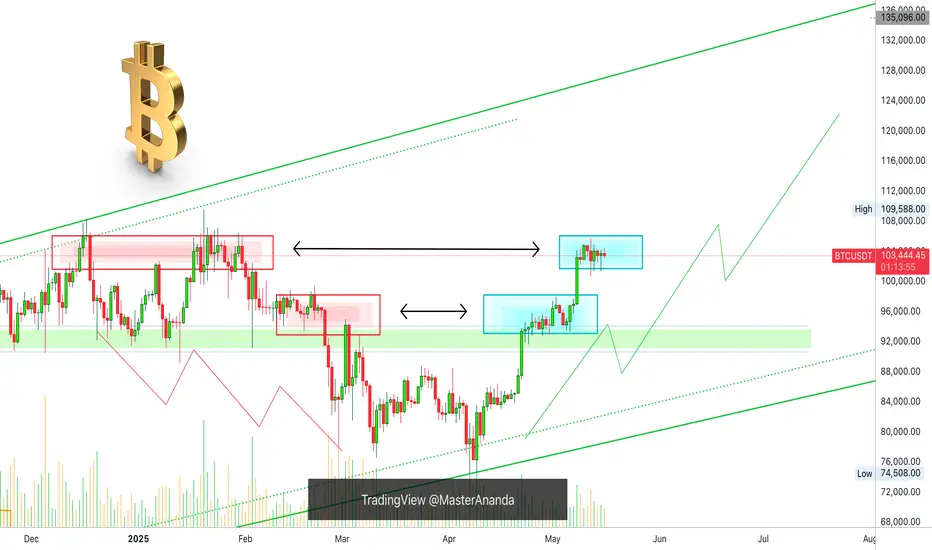
It is the same dynamic all over again, resistance turns support.
I will reveal the technicals for you and you decide what to believe and what to do but my reasoning is supported by data, facts. It is not wishful thinking or random choosing. It is true the market can move in any way but you have to go with the side that has a high probability of success. If you do this often enough, you win in the end.
When the market was going down, every time there was a stop the next move would be a continuation of the main direction, the trend.
When the market is going up, every time there is a stop the next move will be a continuation is simple.
The question is this; is the market rising or falling?
The market has been rising for more than a month. Yes, it is meeting resistance but this resistance has already been challenged several times in the past. Bitcoin moving back to it after a strong correction means the decision point. If we didn't know about the fundamentals, the change in the regulatory landscape and the Altcoins, I don't know, I would say things look mixed at the most, but knowing about all these other factors I can say with confidence that Bitcoin will continue to grow. Don't get me wrong, there can be consolidation for a few more days and even more swings to remove some of those over-leveraged trades; the next major move is up and a new All-Time High.
Thank you for reading.
Namaste.
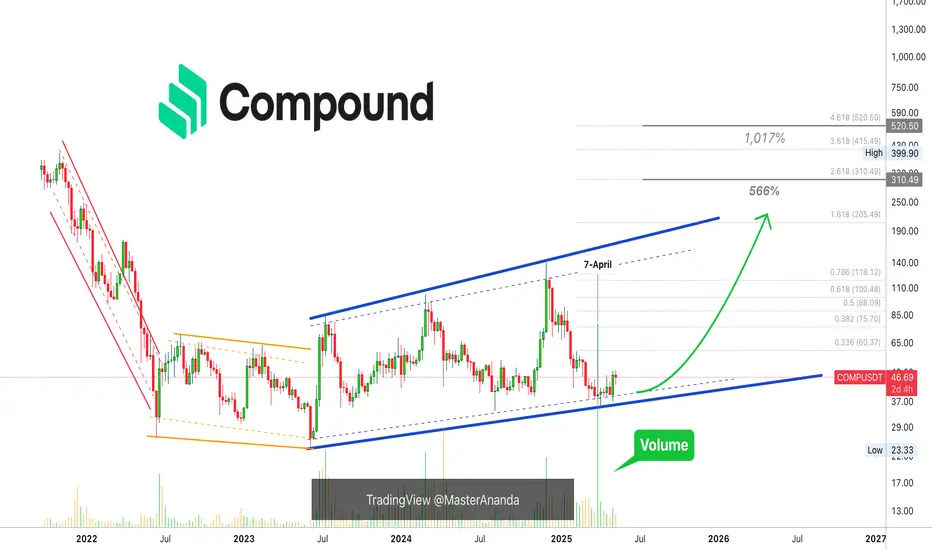
OMG, Which One? Too Many Altcoins To Choose From —CompoundIt goes something like this, and this is easy: One of my friends ask me for a coin that is set to move now. High level of accuracy. Of course, the first thing I think about is all the trades in the past month that already went up, but, ok the show goes on and the market has lots to offer. This pair is the one that I showed him. This one is going up.
Compound here is easy and I will explain the chart for you right away. Quick and simple of course because simple is best.
We have the higher lows since June 2023.
We have higher highs as well. That's as simple as it gets cuz it reveals the bullish bias and bullish trend.
Now, how do we know if it will move right away?
Value. This is valuable... Notice the high volume candle 7-April. This reveals the bullish bias.
You can choose your own target of course, but my point is, this one is the ones that is going up.
There are many pairs to choose from, but some will move in three months, other in three weeks and other in three days. Some will not move at all... Choose wisely.
Thank you for reading.
Namaste.
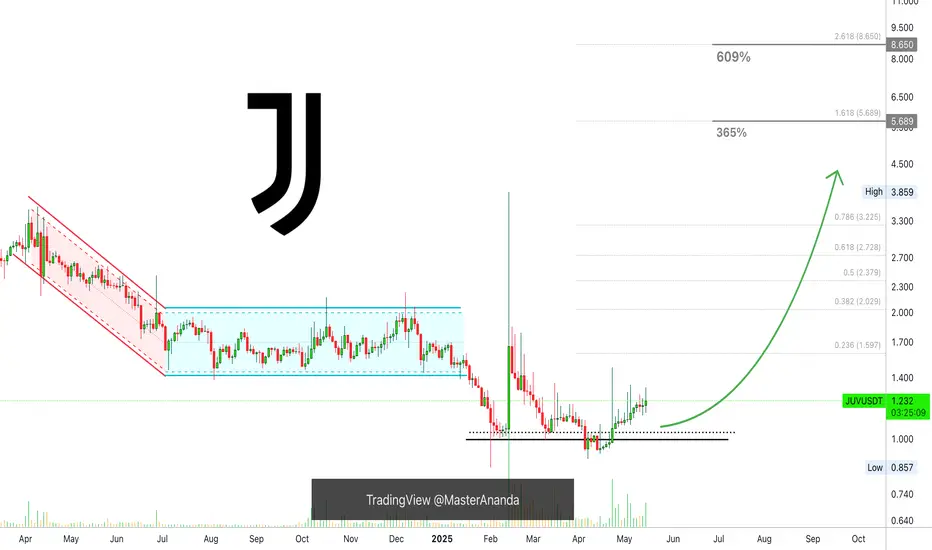
Juventus Fan Token Triple-Up, Easy 365% Or 609% Weeks Or DaysWould you like to see a sudden, fast strong jump? I present to you the Juventus Fan Token, JUVUSDT. This one will do just that in the coming days.
Stop. Pause. Wait a minute. The wait can extend for a few days to a few weeks but that's about it. The maximum is a few weeks but mostly several days for a strong bullish jump.
How I do know? It is easy based on the current chart.
There is a clear bottom sequence, reversal sequence as well as bullish momentum building up.
One of the strongest signals pointing to fast growth is bullish consolidation, when prices rise slowly; slow and steady growth. This is happening here. The same happened with Notcoin before 100% growth and that's just the start. Same for OGUSDT and ATMUSDT, you can search my profile to find those. @MasterAnanda
I love this type of chart because it can triple-up your portfolio, or your capital in a matter of days. Of course, to triple-up your entire capital you would have to make a risky bet/trade but that's ok. You are big, you are an adult and you are smart. You choose how to approach this and other coins.
I give you here a great chart, great prices and absolutely awesome timing, it doesn't get any better namaste.
I will keep it simple because simple is best. You can aim for 365% (profits) or 609%.
That's what I love about Crypto. Easy but big profits.
Take action now.
Enjoy the profits and repeat the process.
Win-win-win-win-win. Over and over, again and again.
This bull market is the opportunity to earn big to play the market long-term, or to retire.
The choice is yours.
Namaste.
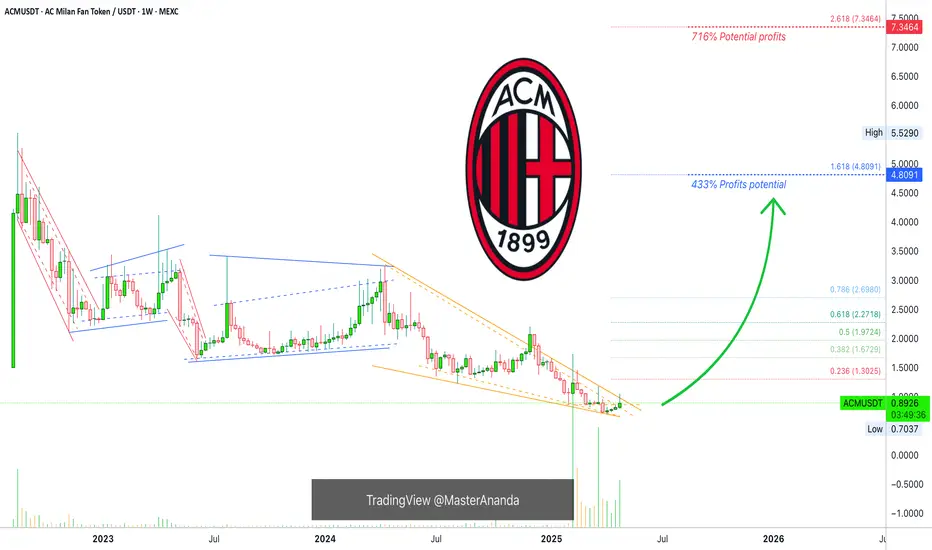
AC Milan Fan Token, Volume SignalHere we have the "volume signal" as well as other signals that I mentioned in the ATM analysis. That is, ACMUSDT is now trading green for four consecutive weeks after a new All-Time Low and the action just recovered above its 3-Feb. low.
Good afternoon my fellow football fan, how are you feeling in this wonderful day?
This is a great chart because prices are low and the best time to buy is when a trading pair (a Cryptocurrency project) is trading low near support.
As soon as the first major low came in February 2025, the session that followed produced the highest buy volume ever. Then again in late March there is really high volume and the last four weeks volume has been good (above-average) and green. Before February 2025, the volume bars are very small, very small... With the exception of August 2022 when the All-Time High was hit followed by the strongest and longest bearish cycle in the history of this coin.
A long-term downtrend or bear market is followed by a long-term uptrend or bull market.
This is a good pair right now.
Strategy: Just buy and hold, never use a stop-loss, never, unless you are a professional trader and have been trading Crypto for 6 years or more. If you have been around for less than six years, you don't need a stop-loss. You can make more money with the strategy of buy and hold. With time you will understand. If you set a stop-loss, the whales and bots will take your money away. You just need to inject money into the market every day, every week, every month or as much as you can afford; let it grow. With time, you will be happy with the results.
Set it and forget it, that is all it takes. You just wait patiently and over time you will see how your balance appreciates. This is a young market, imagine buying Google, Apple or Microsoft when these companies were new and young. You don't want to be selling nor setting stop-loss orders on these stocks, you just wanted to buy to later retire when the inevitable happens. Or you can sell when prices are up. Never sell when prices are down.
If you don't sell at the All-Time High, there is no point in selling at the All-Time Low. Better wait, it will recover.
Thanks a lot for your continued support.
Namaste.
The Next Wave Is The Altseason!Hello, Skyrexians!
Yesterday I found the CRYPTOCAP:OTHERS chart which gave me the hope that my idea with the incoming altseason is valid.
Let's take a look at the weekly chart. Awesome Oscillator shows that the wave 1 has been finished in December 2024. Now this chart is in wave 2. The target area 0.61 Fibonacci has been reached, but here I have 2 possible scenarios. The first one price will grow a little bit and retest recent low and the second one is that wave 2 is finished already and we are in global wave 3. Both these scenarios are about some kind of wave 2 and the growth in wave 3 to 800B is imminent anyway.
Best regards,
Ivan Skyrexio
___________________________________________________________
Please, boost this article and subscribe our page if you like analysis!

Aave Keeps Rising —Makes Sense? Aave bottomed 7-April, and now it keeps rising after just two days red. Aave hitting bottom 7-April means the same with Bitcoin and the rest of the Altcoins which means Bitcoin and the rest of the Altcoins will continue growing as well, makes sense?
Aave peaked in December 2024 same with the rest of the Altcoins market, they are all doing the same. The fact that Aave is bullish now and keeps rising reveals what is to come next, makes sense?
As soon as there is a small retrace people wait for the crash to come, ignoring the fact that we are already in the 2025 bull market and bull market simply means sustained growth. Makes sense?
The Altcoins will continue to reveal what will happen with Bitcoin before it does, it is inevitable, many people in the industry are in the know. When you see Bitcoin stop and you wonder what will happen next, just look around, look at the Altcoins market and the answer will reveal itself, makes sense?
Very easy. Whenever the market drops, see how far down the Altcoins go. If Bitcoin is set to drop you will know it because the Altcoins will start moving down much stronger and much faster than Bitcoin. If Bitcoin finds resistance and is set to move ahead, no retrace, you will have the proof coming from the rest of the market. Some smaller pairs will move ahead.
Thank you for reading.
Namaste.

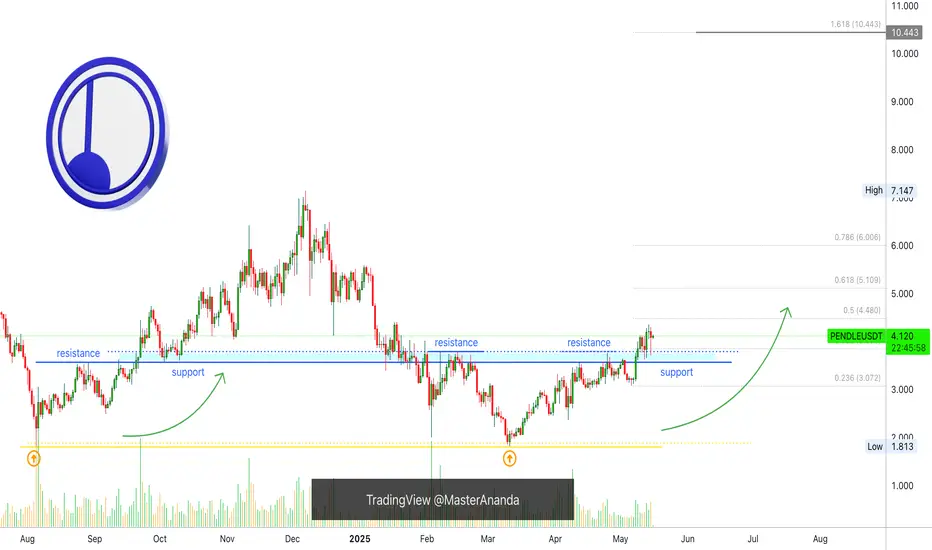
Pendle New ATH, Resistance & Support —Highest Ever Within MonthsWatch the same price range alternate between resistance and support, the blue line/space on the chart.
There is also a long-term double-bottom and the Adam & Eve formation, all together in the same chart.
This paints a picture of a changing cycle. The recovery from the A&E is quite strong. From the 11-March low we have two long months of painful recovery, slow and steady growth. But PendleUSDT now trades above resistance/support.
The chart is self-explanatory, once on the bullish zone, PENDLEUSDT can grow. This is the situation now. Resistance was conquered 9-May. The proceeding days it was tested as support and holds.
We can expect some consolidation above this level and then boom! A strong advance hitting new highs. Pendle is set to hit its highest prices ever in 2025 and then some more. $11 and $16 are the main targets.
Thank you for reading.
Namaste.
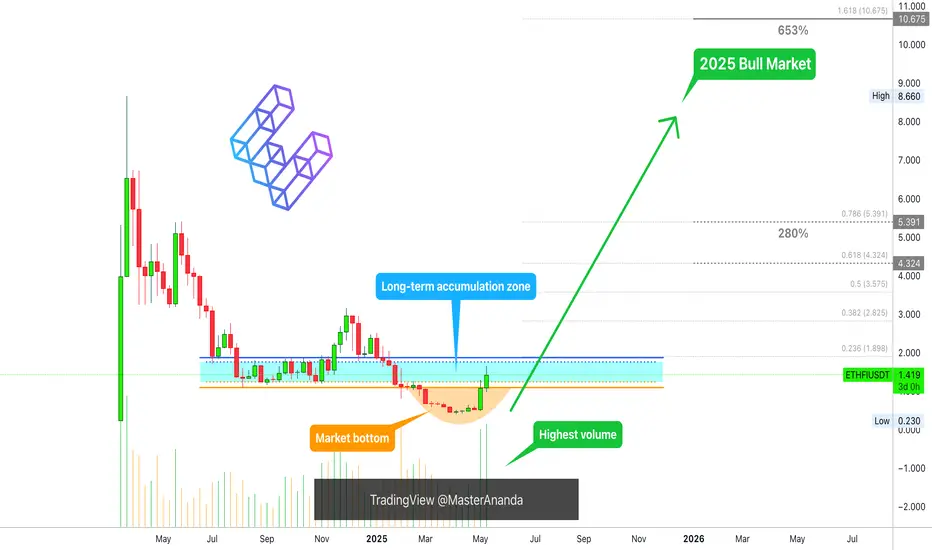
EtherFi Governance Token & The 2025 Bull Market (PP: 1,111%)EtherFi is hot right now just as Ethereum is very hot. The project looks really good with great offerings, great products... Let's consider the chart. If you have a good product with a great chart, that's a combination for a massive 2025 bull market. You are bound to get numbers beyond this chart.
The long-term support and accumulation zone was lost in late February/early March. It was recovered again in May. The bottom was only available for two months. You are one of the lucky few if you decided to buy at bottom prices. Prices that will never become available again.
ETHFI is back above its August 2024 low, thus bullish; now trading with a bullish bias within its long-term accumulation zone. A price zone where we can buy, big, focusing on the long-term. A great chart, huge potential for growth, can't say it often enough.
There is really high volume here, the highest since launch date.
This high volume indicates and confirms that the bottom is in. If prices were to move back lower, trading volume the past two weeks would be much lower. Since prices are set to grow, volume is really high, the whales are loading up.
Not all is lost. It is still early because the last drop was a stop-loss hunt event. Notice the blue space on the chart, this is the standard buy zone. Here, in this range, ETHFIUSDT traded for more than 3 months in 2024.
A bull market can be expected now, a bullish trend.
Nice and easy, buy and hold; the market will take care of the rest.
This post is meant to alert you of a great entry timing and prices.
This is for spot traders. An easy buy. —Focused on the long-term.
Thank you for reading.
Namaste.
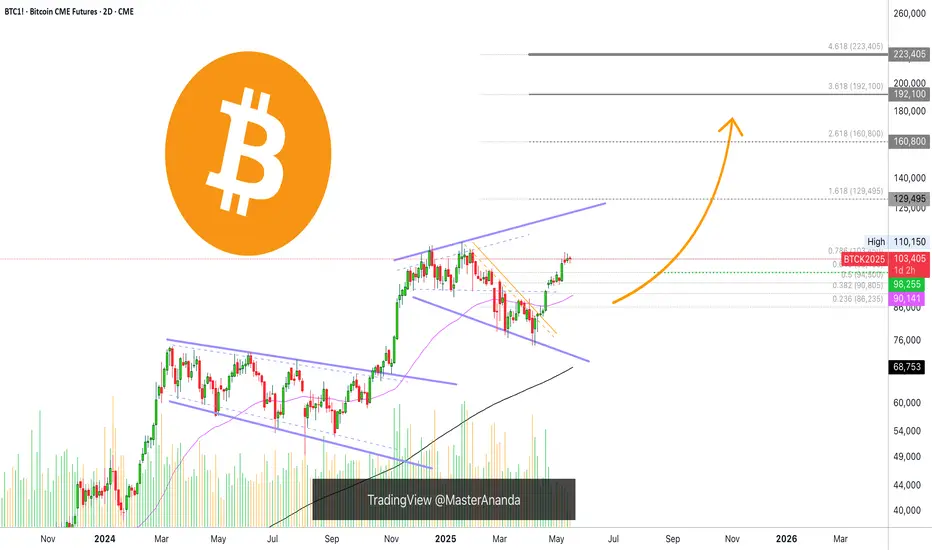
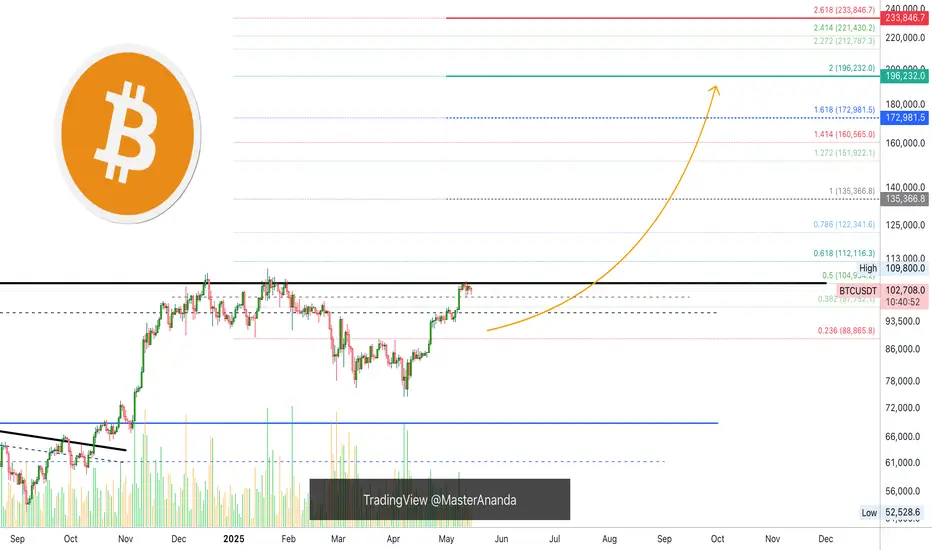
Bitcoin: $150,000, $180,000, $200,000 Or $220,000This is a question that nobody has been able to answer in the past 6 months: Will Bitcoin peak at $220,000 or $150,000?
Will the next All-Time High happen at $150-$160,000 or $180,000?
It is hard to say right now isn't it? But, consider this, if a new All-Time High will be hit within a few short weeks, or days, then there is plenty of room for Bitcoin to reach levels toward 200K. So maybe 150-160,000 is an easy target, it can go higher...
Now, it is true that we can guess and speculate about $250,000 or $220,000 or more, but there is no doubt that the next move is a rise, a strong rise, a continuation of the bullish move that started just a month ago. Five consecutive weeks closing green. As bullish as it gets.
Are you a SHORT trader?
You are about to be liquidated. There is till time, close your position now because Bitcoin is going up!
This is a friendly reminder.
Load up on the Altcoins.
Thanks a lot for your continued support.
Namaste.
1 Billion USD+ SHORTs Liquidation —Bitcoin BullishGood morning my fellow Cryptocurrency trader, I hope you are having a wonderful day.
We all know that life is not a game of checkers, it is more like fifth dimensional chess. It can be easy once we master how to play but it is actually hard to learn the game. The same goes for trading Cryptocurrencies, it is not an easy game.
Billions of dollars are about to be liquidated from SHORT traders. The All-Time High liquidation. This is a friendly reminder.
» If you are bullish, congratulations. You are good and you will do great.
» If you are bearish, there is still time, you don't have to lose knowing beforehand what will happen next.
The whales and market manipulators are setting up a trap right now, but they can never fool you because you know best.
What do you know?
» You know Bitcoin to be bullish because it is easily trading above 100K.
» You know Bitcoin is rising because it has been moving up since the 7-April low.
» You know a continuation will soon follow because we have signals coming from the Altcoins, the Stock market and Gold. Everything is pointing up.
I know you are smart and thank you for coming back and reading again. In only a matter of days, billions of dollars worth of SHORTs will be liquidated. Make sure not to be caught on the wrong side of the fence.
» Bitcoin is going up.
Namaste.
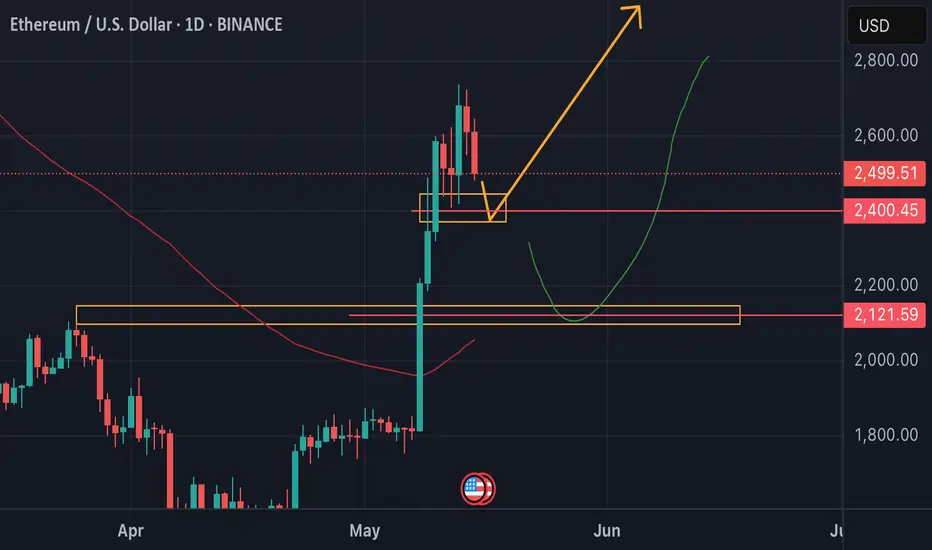
ETH ANALYSE We have two key levels to watch on ETH:
- Either the price reacts upwards on the $2401 level in H4,
- Or it falls further and reacts at the $2,121 Daily level.
Either way, the fall should not last too long.
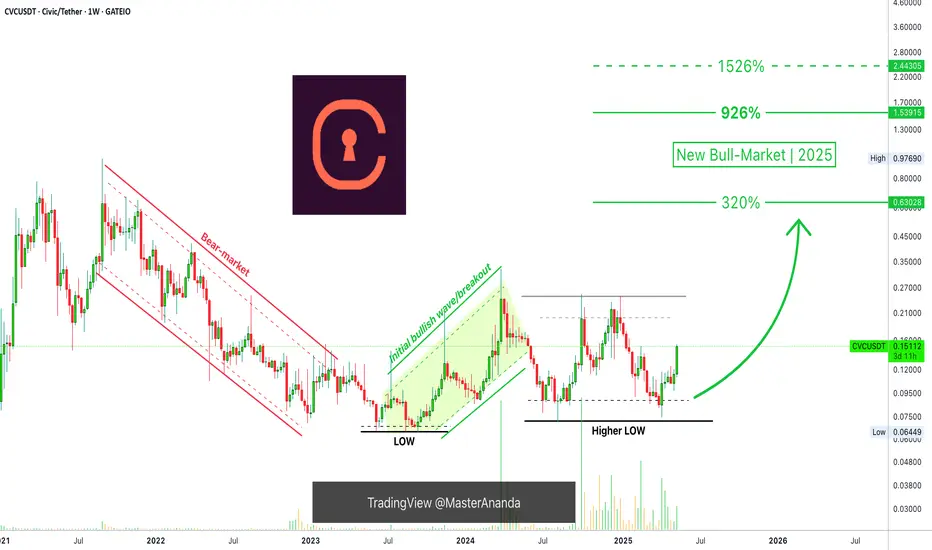
Civic Bull Market Bullish Wave On (PP: 926% - 1526%)Civic's bull market bullish wave is on after a very nice long-term double-bottom pattern.
Back in August 2024, CVCUSDT produced a major low coupled with a reversal candlestick pattern. Back in April 2025, last month, CVCUSDT did the same, a higher low and technical double-bottom and now it is moving with maximum strength. This weekly session is one of the strongest sessions/candles in years. After a higher low, this means that the 2025 bullish wave and cycle is fully on.
The long-term double-bottom, between August 2024 and April 2025, is also a long-term higher low vs June and August 2023, this means that this pair has been growing long-term from its base. This is a strong bullish signal that reveals a new All-Time High happening in 2025. This can turn into something awesome.
An easy target here is mapped at $0.63 for a nice 320% profits potential. Remember, this is only because the bullish action is already ongoing. If we take the total potential from the market low, this same target would be equal to more than 747%, and it is an easy target.
The next target and new All-Time High sits at $1.54, with total profits potential reaching 926%. The same, from the bottom up, the April low, this same target will yield a huge 1,952%. That would be the total 2025 bull market bullish wave, but guess what? It can go higher...
Thanks a lot for your continued support.
Namaste.
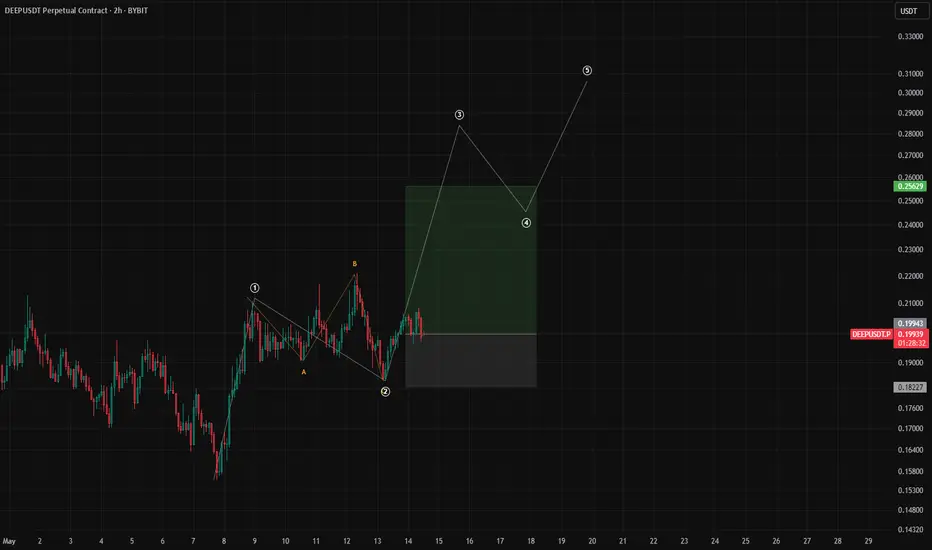
DEEP 2H AnalysisHey traders! 👋
I’m watching a potential Wave 3 impulsive move forming on DEEP/USDT that could present a strong bullish opportunity. Let’s break it down 👇
🔹 Structure Overview:
We’ve completed a five-wave impulse upward (Wave 1 ✅), followed by an irregular corrective Wave 2 (ABC correction). This setup opens the door for a classic Elliott Wave 3, which tends to be the strongest leg in the sequence.
🟩 Entry Zone: 0.195 – 0.205
🎯 TP: 0.256
🛑 SL: 0.182
⚖️ Risk/Reward Ratio: 1:3
📌 Remember:
Take care of your risk and money management. Always size your positions according to your plan.
💬 What do you think? Does this count look solid to you, or are you seeing a different wave scenario? Drop your thoughts below ⬇️
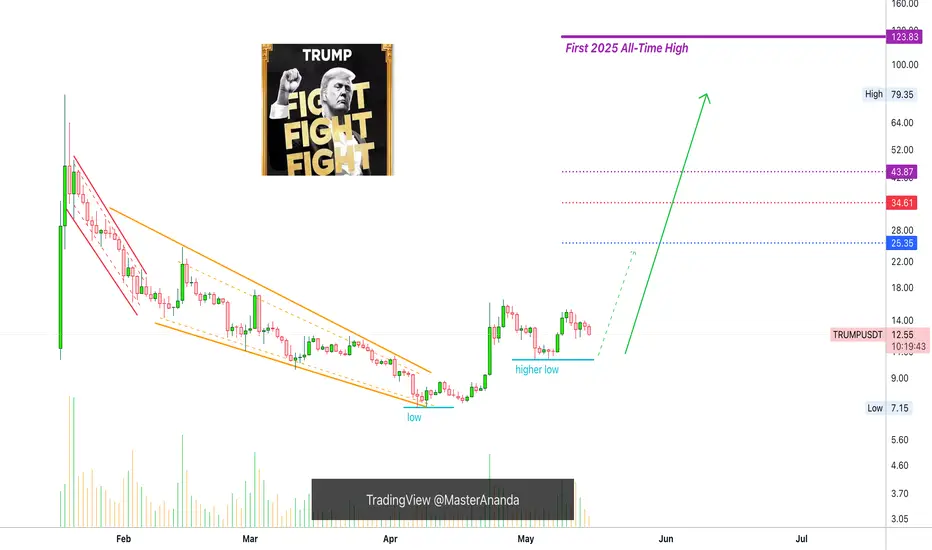
OFFICIAL Trump: Should I Sell Everything Now?Notice how interesting this is, while TRUMPUSDT peaked 26-April, the "higher low" on the chart remains untested, that is, this trading pair is consolidating while staying sideways.
While there was a lower high 10-May compared to 26-April, there is no strong retrace. TRUMPUSDT is trading high up.
This is not the time to sell, no. This is the time to buy, buy strong and hold because not only OFFICIAL TRUMP but everything Crypto will grow.
The longer the consolidation (sideways) period, the stronger the bullish wave that follows. In fact, it is good that TRUMPUSDT is sideways now and working to gain strength. This means that the project is preparing for a massive bullish wave. This wave will happen next in a matter of time, can be a week from now... Prices will be moving higher for certain, patience is called for.
Namaste.
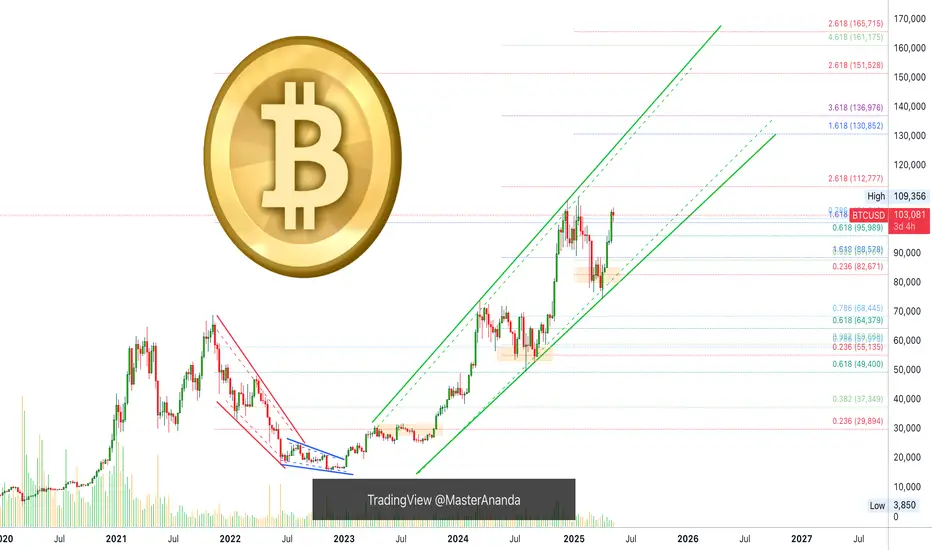
Correction Imminent? Will Bitcoin Drop Or Continue Rising?As we can see here, Bitcoin is challenging resistance very close to the All-Time High. This is a price range. The highest Bitcoin was able to hit was $105,850, right below $106,000. Will Bitcoin drop now, even if short-term, or continue moving higher?
» Bitcoin will continue higher and produce a minimum of retrace.
Bitcoin is very likely staying above $100,000 and after some consolidation continue higher to hit a new All-Time High.
While Bitcoin moved above $100,000 on the 8th of May, there isn't any bearish pressure nor bearish momentum. The bears have no strength.
If there is selling happening, the bulls are more than ready and happy to buy everything up. Anyone and everyone selling now will simply lose their coins and miss a huge opportunity because Bitcoin is already growing and will continue to grow. It is normal to see some consolidation after a strong resistance level is hit. This resistance stands around $105K. Once this level breaks, we will see additional growth.
Bitcoin is bullish.
The market is bullish.
Any retraces are just an opportunity to buy-up, rebuy and reload. Do not sell your coins, hold strong. Hold easy or even buy more because Bitcoin is going up!
It can start growing right away, within hours or it can take a maximum of few days but the next major move is up. When Bitcoin starts going, it never looks back. The market will continue growing. Rest easy and buy more Altcoins.
Namaste.
COINBASE and ALTS going hand in hand! Massive break-out expectedCoinbase (COIN) and the Crypto Total Market Cap (excluding top 10) are going hand in hand in this Cycle as their patterns since the November 08 2021 High have been virtually identical.
Right now we are on a strong rebound which was initiated on both after breaching below the 1W MA200 (orange trend-line). That is basically a Double Bottom, aiming at a break-out above their respective Resistance levels, which is expected to be massive.
Notice how even their 1W RSI patterns are similar, both Falling Wedges. Also their Bull Cycles both started on an Inverse Head and Shoulders pattern, so there is every reason to expect that the two will continue hand in had until their very peaks of the Cycles.
-------------------------------------------------------------------------------
** Please LIKE 👍, FOLLOW ✅, SHARE 🙌 and COMMENT ✍ if you enjoy this idea! Also share your ideas and charts in the comments section below! This is best way to keep it relevant, support us, keep the content here free and allow the idea to reach as many people as possible. **
-------------------------------------------------------------------------------
💸💸💸💸💸💸
👇 👇 👇 👇 👇 👇

Dogecoin Long-Term, Weekly TimeframeRepeating patterns are great because you can easily predict the future by studying them.
Good...
Dogecoin produced a peak in March 2024 and starts a decent. This descent creates a sequence of lows marked 1,2,3 on the chart. This ends up as a rounded bottom. As soon as the action recovers above the baseline of the rounded bottom, there is some consolidation and then massive growth. The highest prices in several years. The situation is very similar today.
Dogecoin produced a peak in December 2024 and then starts a descent. This descent creates the bottom pattern shown on the chart. The market is already bullish as all the bearish action since February has been removed. DOGEUSDT moves now as if it were February 2025. March and April where the months that produced the final market shakeout (flush) before the 2025 bull market cycle and wave.
Right now we can see some consolidation based on the weekly timeframe, very short, followed by additional growth. The biggest wave since 2021. Something awesome.
Are you ready?
I hope you are...
Namaste.

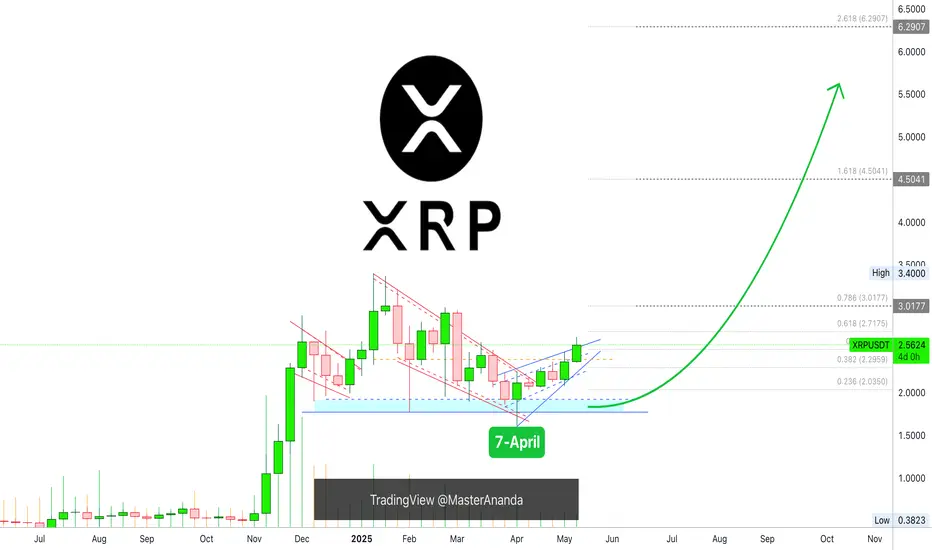
XRP WeeklyHere there is just one thing to consider, how the market is doing. How the market is doing now and what is doing now reveals what comes next.
XRP went bullish in late 2024. It reached a new level in November 2024 and then stopped growing. It did not start a bearish impulse nor bear market but simply stopped growing.
This pause is the market consolidating, building up strength before additional growth. Pretty simple right? I think we can all easily agree.
Up and down. Up in December, up in January and then down until April.
Come 7-April, the action has been bullish. Prices have been rising ever since, week after week. What is happening now reveals what will happen next.
The market went from a peak to sideways, to slow and steady growth. Building up strength before the next major bullish jump. XRPUSDT is going up. It will grow, mark my words.
Namaste.
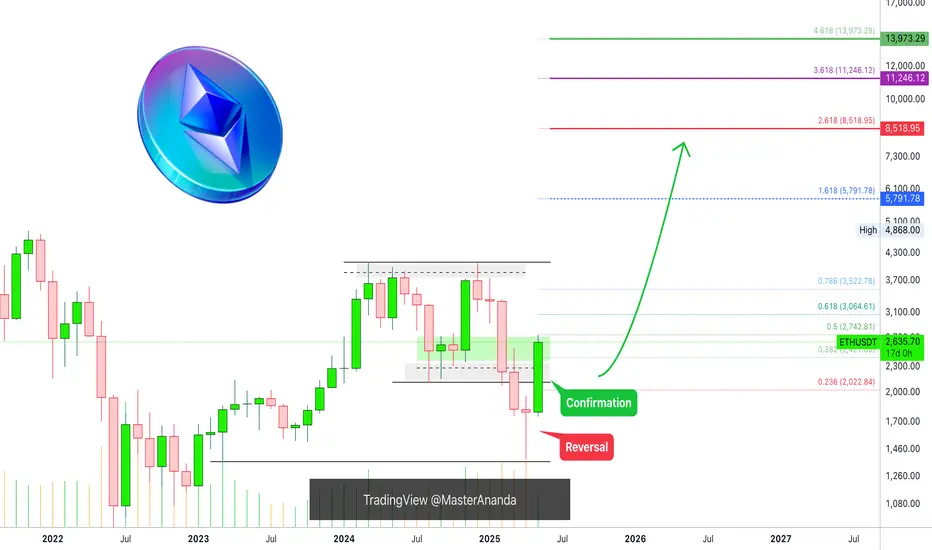
Ethereum Monthly: Bull-Bear Market & Transition Until 2029Ethereum closed five months red, something seen only once in the past in 2018 in a bear market. Needless to say, after such a strong bearish period the market produced an equally strong bull market.
Back in 2018 Ethereum went beyond five months red but this is the only time ever in its history, then now in 2025 this is the longest stretch of continued bearish action. This is good because we know that the market will produce a bull market that is many times stronger, just to balance things out.
These five red months resulted in a long-term higher low.
The bottom was hit at $1,385 in April, last month. This month we already have a full green candle going mid-way through February. All the loses incurred in April and March have been recovered.
The low last month hit levels not seen since March 2023. In March 2023 ETHUSDT was rising but produced first some bearish action; the month closed green. After more than eight months of consolidation it produced a major advance and the highest prices since the 2021 All-Time High.
This time it will be different. Ethereum will be rising steadily, month after month. Rather than sideways-neutral, up-up.
In 2024 there was a double top. March 2024 and December 2024.
In 2025 we will have one top, a blow-off top. So there will be only one chance to sell when prices are really high up.
It will grow steadily month after month as bullish momentum builds up. After several months, we will have a bull run reaching mania levels, euphoria, excitement and a very strong new All-Time High. After this phase is over, the classic bear market in 2026.
The bear market will produce a multi-year low price, then a period of consolidation, sideways-neutral, and then back again bullish, a major bull market in 2029. There will be growth in the transition years, 2027 and 2028. You can equate these with 2023 and 2024.
2022 was the last bear market.
2026 will be the next bear market.
2021 was the last bull market.
2025 is the next bull market.
2023-2024 were the transition years.
2027-2028 will be transition years.
Thank you for reading.
Namaste.
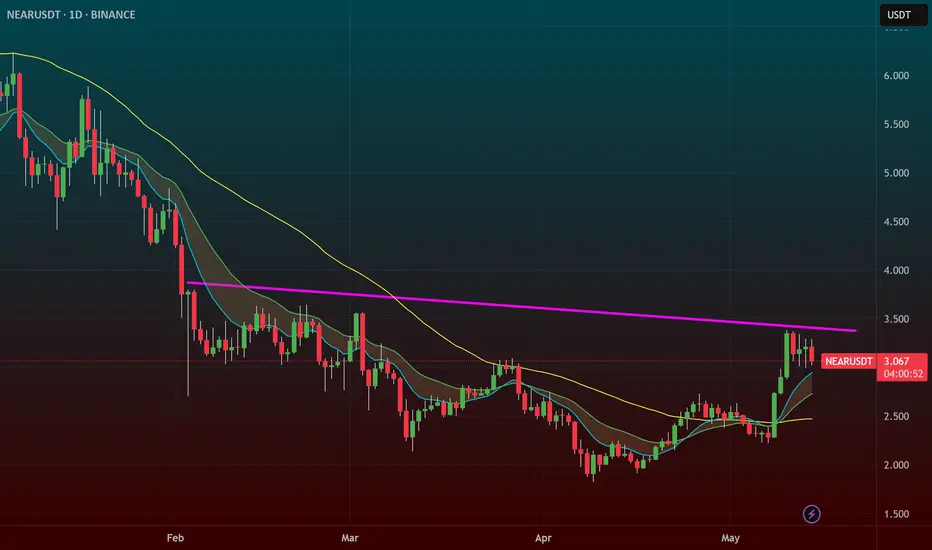
NEAR – Base Breakout Setup at $3.37: Is Altcoin Season Here?NEAR Protocol ( CRYPTOCAP:NEAR ) is setting up for a potential breakout, and it’s not just a technical play — the market narrative is shifting:
🔹 Base Breakout at $3.37
Price is pressing against the $3.37 resistance, a clear base breakout level.
Volume is increasing, signaling accumulation.
Strong support just below at $3.20 keeps risk tight.
🔹 Altcoin Season Potential
Bitcoin dominance is starting to decline — a classic early sign of an altcoin run.
Ethereum ( CRYPTOCAP:ETH ) has already gone on a massive run — could NEAR and other altcoins be next?
In previous cycles, declining BTC dominance often triggers massive runs in altcoins.
🔹 My Trading Plan:
1️⃣ Initial Entry: Starter position at $3.37 breakout, adding on strength.
2️⃣ Anticipatory Entry: Dips into $3.20 support with a tight stop below.
3️⃣ Stop Loss: Below $3.20 for any initial position — keeping risk defined.
🔹 Why This Setup is Compelling:
Clear base breakout with altcoin narrative tailwinds.
Bitcoin dominance declining is a key macro signal.
Ethereum’s strength adds confidence to the altcoin trade.
FARTCOIN Bearish Head and Shoulders – Testing Blue Support🚨 $FARTCOIN Bearish Head and Shoulders – Testing Blue Support 📉
$FARTCOIN has formed a bearish head and shoulders pattern and is now testing the blue support. There’s potential for a breakout, so we need to watch closely for any signs of further movement! 📊
Let’s monitor this closely! 💼💸

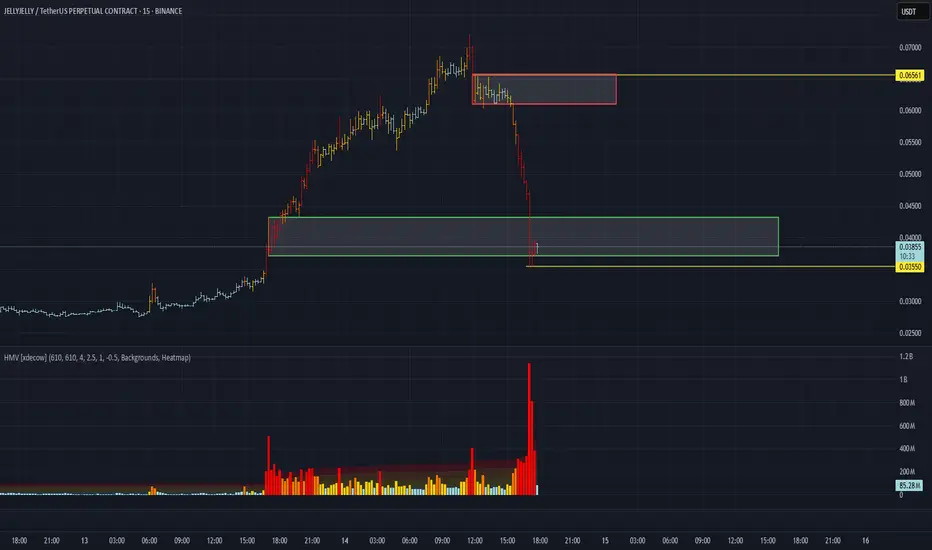
JELLYJELLY/USDT Analysis. Bounce After Liquidations
After today’s sharp sell-off, this coin has entered a support zone. At the moment, volume has surged significantly. Based on big trades, cluster search, and delta data, we observed a large number of short liquidations. We are considering a long with potential targets at $0.05 and $0.06.
This publication is not financial advice.