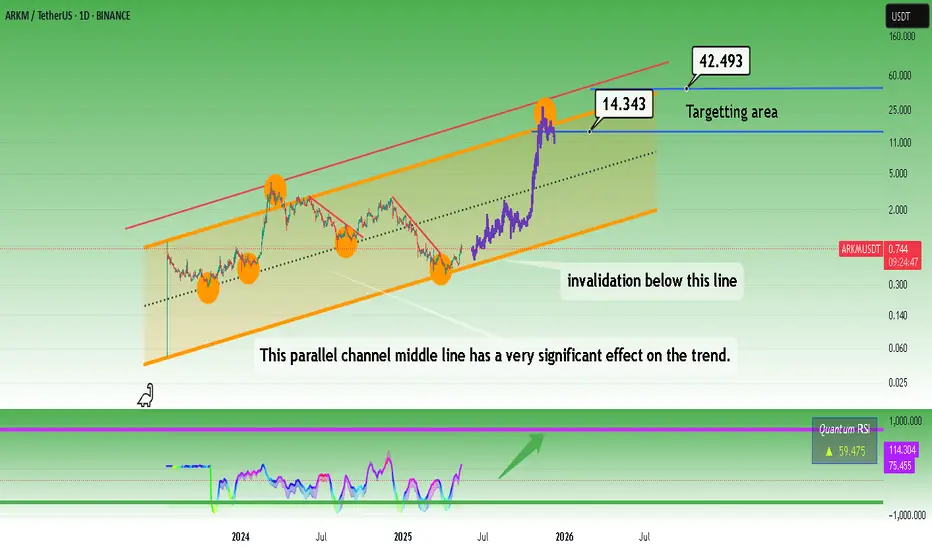
Arkm possible bull market targets.Possible bull market targets and invalidation level. It is obvious that prices have been moving within this channel so far.
* The purpose of my graphic drawings is purely educational.
* What i write here is not an investment advice. Please do your own research before investing in any asset.
* Never take my personal opinions as investment advice, you may lose your money.
Altcoins
$TOTAL2: Altcoin bull market until April 2026Signal flashing here, very promising outlook for altcoins...
Follow me for more insights on how to maximize profits in the coming bullish cycle that is forming now, check out my signature for more info.
Best of luck!
Cheers,
Ivan Labrie.

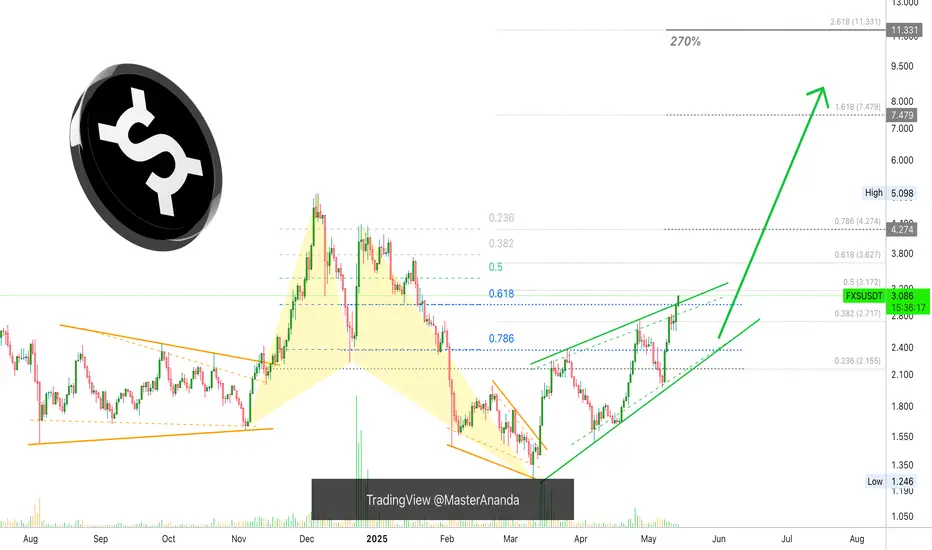
Frax Share On The Way Up (PP: 270%)The low here happened 11-March rather than 7-April, 7-April was a higher low. The action is strongly bullish and the rising channel has been broken, the upper boundary. From this we can deduct that the next higher high will be a really strong one.
Frax Share is on the way up.
The $11.33 target with 270% potential on the chart gives 809% potential when taken from the 11-March low. This is the projected size of this first 2025 bull market advance. Of course it can happen that the peak reaches $7.47.
The first peak can be $7.47 or $11.33 doesn't matter. After the higher high is in, we are likely to experience a retrace or correction followed by additional growth. This "additional growth" will result in something really huge. It will be awesome.
Prepare now, many Altcoins are still trading at bottom prices.
Plan before buying. When will you sell if prices start to rise after you bought?
How much will you sell?
If you don't sell everything, what will you do with the remaining tokens?
If you sell everything, what will you do with the free capital? Use a portion to enter a new trade while securing some profits? Go all in a new trade or split between multiple pairs?
Plan for all scenarios.
Create your own scenarios. This way you can win big.
Namaste.
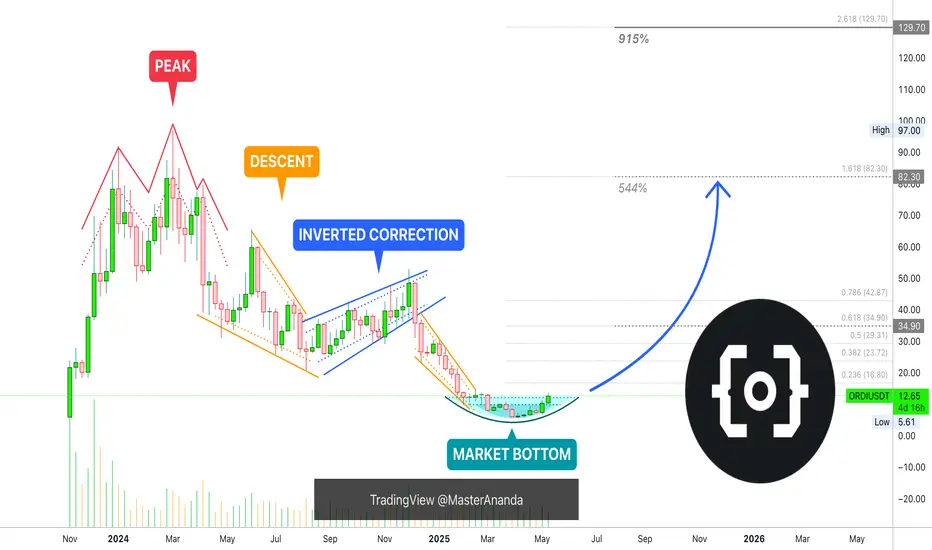
Ordinals Market Bottom, New 10X Bullish Wave In The MakingHere we have a true and perfect bottom. A rounded bottom.
The bottom is perfect because of the chart structure. First, there is a bullish wave, some bullish action. This is followed by a descent with a classic period of rest in-between the start and the end of the bearish move. After the down-wave is over, a perfect rounded bottom forms with a new All-Time Low. After the ATL, ORDIUSDT turns bullish. Classic sequence.
Here it is easy to appreciate how low Ordinals is trading compared to previous market phases, truly bottomed out. It is still trading below mid-November 2023. The only candle that is being matched right now is the first trading session in early November 2023 on the way up.
The same range was also active in February this year but this was part of the final descent.
The bottom leads to a recovery and the recovery will transform into a full blown bull market, growth long-term.
The targets on the chart are easy targets, it is likely that the new All-Time High in 2025 will end up being something higher than what is shown on this chart. Even if it doesn't go beyond, the second target amounts to more than 10X. Huge potential for growth.
Namaste.
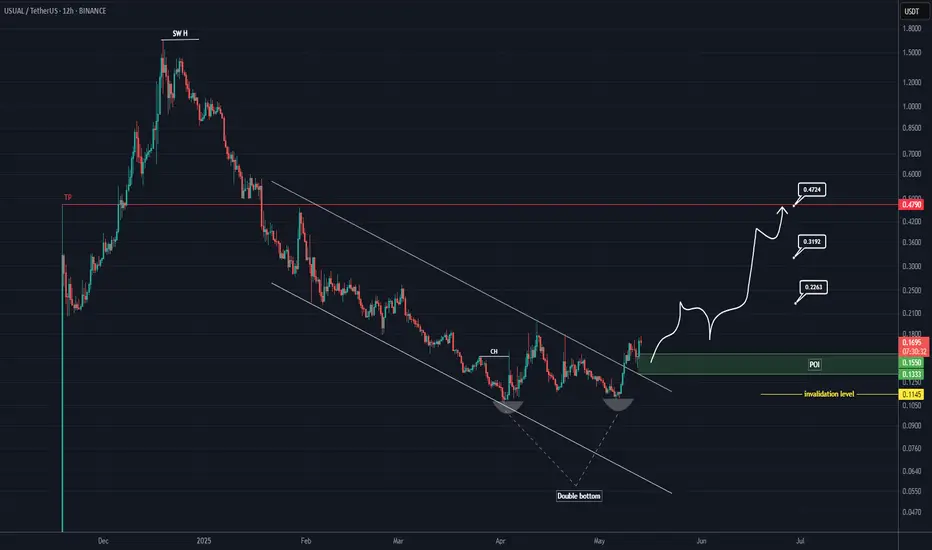
USUAL Looks Bullish (12H)A double bottom pattern has formed on the chart, leading to a breakout from the price channel.
A support zone has been established, and a bullish CH has appeared on the chart.
Considering the breakout and the bullish structure, we can set up a buy position on this coin.
Targets are marked on the chart, and reaching the third target is also possible.
The invalidation of this setup will occur if a daily candle closes below the invalidation level.
For risk management, please don't forget stop loss and capital management
When we reach the first target, save some profit and then change the stop to entry
Comment if you have any questions
Thank You
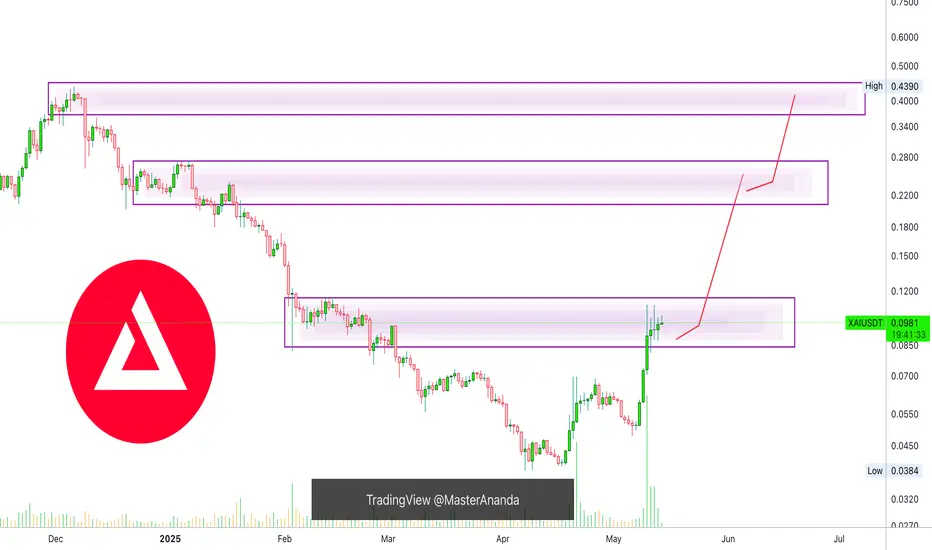
Xai Bullish ContinuationThere is continuation written all over this chart. Remember that Bitcoin situation when it stopped in the 94-98,000 resistance zone? The level that worked as support on the way down, later worked as resistance on the way up. The situation here is the same.
As XAIUSDT was moving down, it found support in the current price range and this same range is now working as resistance on the way up. Just as it broke on the way down, it will break on the way up. a Bullish continuation.
Namaste.
Magic Bullish Flag, Bullish Continuation = Multi-Year HighIt can crash just as it can move up. When I am saying it is going up this is only my belief.
When I looked at this chart I immediately thought that there will be a bullish breakout next because of the small rounded bottom and the bull flag, but, here is another scenario that can happen:
Then after I started to draw this scenario above seemed less likely.
» After a strong rise the retrace was very small.
» The support zone in blue matches the 17-March peak candle wick and close. It has been tested and it holds.
» There is no bearish volume nor any bearish momentum.
There is simply no need for the market to move lower and there are no signals pointing this way. So instead of down, a bullish breakout (continuation) comes next. Seems pretty obvious, the bull market has already been confirmed.
Thank you for reading.
Namaste.

Vana 1111% Potential? Consolidation Continues (Trading Strategy)Consolidation as in bullish consolidation because prices have been moving up for months, the bottom was hit mid-March.
Good evening my fellow Cryptocurrency trader, I hope you are having everything that you wish to have in this moment in this time in this life.
I hope you are having a beautiful week and a wonderful day.
How are you feeling?
Good, let's just focus on the chart, ok?
The best time is now to trade.
To trade or not to trade. What does it mean to trade?
What is trading all about?
Trading is a money making job but not everybody who is trading is working. Sometimes we are drawn to the market as if by a magnet and we end up playing, or should I say "trading" but there is actual no trading involved.
Trading is an exchange, we are not exchanging anything other than clicks and numbers on a screen. Does it count as trading? Well, clicks and numbers, if these are being exchanged then it is still trading.
We are exchanging virtual currencies so yes, we are trading and we can win.
VANAUSDT. We've been on a mix between investing and trading; get your mind right!
Are you in it long-term or short-term?
It can make all the difference knowing where you stand.
If you say you will decide on the go, here is what always happens: When the time to tell is right, you say "I am holding/trading long-term." If the time to sell is wrong, prices will continue going up you say, "I am securing profits, this is a short-term trade."
For this reason, it is better to plan ahead.
Just plan ahead and, when you secure profits and prices keep on growing, it doesn't matter, you secured a winning trade.
When you secure profits and prices drop, it doesn't matter either, you just did what you said you were going to do before you bought.
Plan before buying.
Thanks a lot for your continued support.
Namaste.

BCH short range high ideaBCH could be forming structural loss lower time frame that could at least give a small pullback into the demand below offering a scalp short opportunity

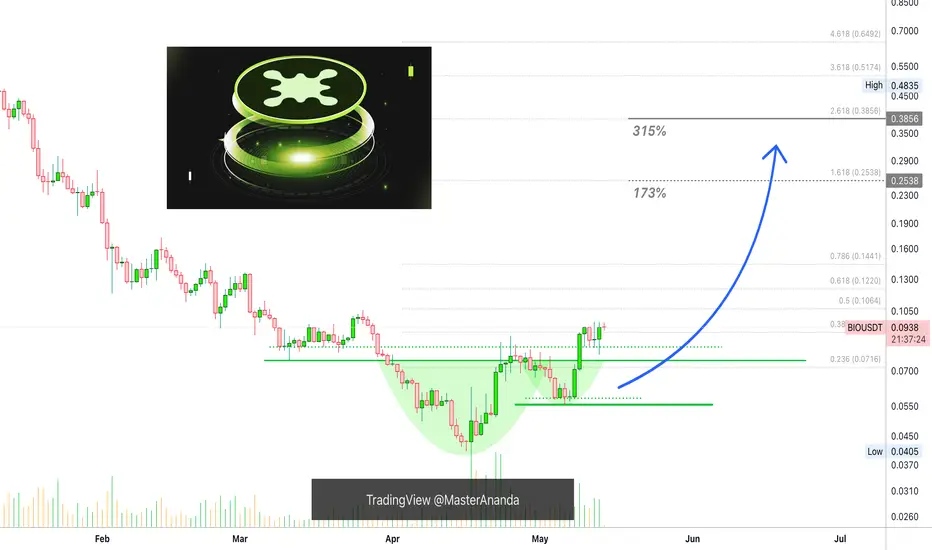
Bio Protocol Short-Term (PP: 315%) —Trading vs InvestingFor some trades, we focus on the short-term. Lately, when the charts are young we are using them for the short-term signals. Rather than ignoring them completely, these tend to be hot and attract a lot of interest from market participants. We should also play.
BIOUSDT produced a bottom pattern here, notice the cup and handle. Enough to open a trade. Something like this: Buy and wait for the market to move in your direction (up). Set up your sell order on target before the target hits, normally after buying. When the target hits, the project in question will have disappeared from your portfolio, but you will see new funds in USDT (or BTC if you are trading a Bitcoin pair).
In short, buy and hold, the market takes care of the rest.
There are two targets on the chart, which one you choose is up to you. You can also choose both or none. By none I mean you keep holding long-term. While this is a short-term chart/trade setup, this does not cancel out the fact that we are entering the 2025 bull market cycle and phase. Which means that there is room for massive growth. By both I mean selling a portion at each target. Whatever you do is up you. I give you great entry prices and great timing. Also the analysis to remove any doubts when it is time to wait.
If prices drop you have two options:
1) Who cares? This option means that you keep on waiting until the market turns. The wait can last 1 day, 3 days just as it can last 1 week or 6 weeks or months. It depends on the broader market cycle.
2) After prices drop a certain pre-defined number, you close the trade; sell at a loss.
These are two options. Some people will buy and hold, others will decide to trade.
If you go with #2, you are trading.
If you go with #1, you are investing.
Thank you for reading.
Namaste.
Neiro: Your Altcoins Choice (S5)I am very curious as to why dogs became so famous within the Cryptocurrency market... It is very interesting. What is the relationship of dogs and this technology? Why dogs and not turtles or dragons? We know the cats went to videos but Crypto gets to enjoy man's best friend.
Neiro is good my dear friend very good just as you. Thanks a lot for your support.
I appreciate the time took out to comment and make this analysis request, I hope you are happy with the results.
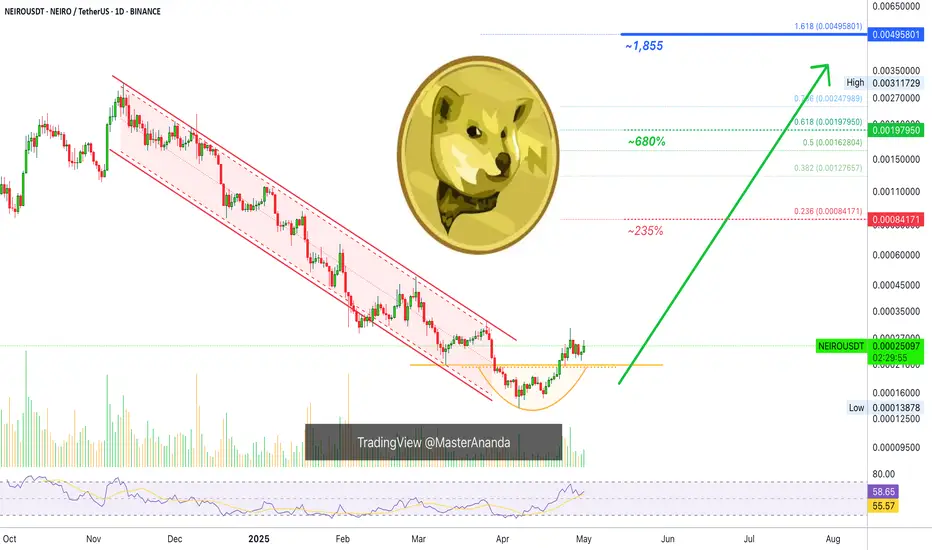
NEIROUSDT is good, this is a solid chart.
This analysis is 100% based on the chart, technical analysis—TA.
The RSI looks pretty good on the bullish zone (above 50).
There is a bottom pattern in the form of a rounded bottom coming after a major downtrend. The action recovered above the 11-March low and the ensuing retrace was minimum which is a signal of strength.
The chart candles, the volume and indicators are telling me that an advance will happen next. The main move will be an up-move. Higher prices for sure. You can find targets mapped on the chart, it will be easy, it is high probability and it will be great.
Strategy? Buy and hold. But make sure to sell when prices are up do not become greedy. Enjoy the profits and move on. Opportunities are endless. You are good because you have good timing. Having good timing means that you are balanced in your life because you are looking at the market just at the right time. To be able to be here at the right time means that you are looking to win. Those that are looking to play will join when it is too late.
Timing is very important when trading because it removes all the complexities that come with joining a move when it is already underway. Buy and hold easy. NEIRO is set to grow in the coming weeks and months.
Thank you for reading.
Namaste.
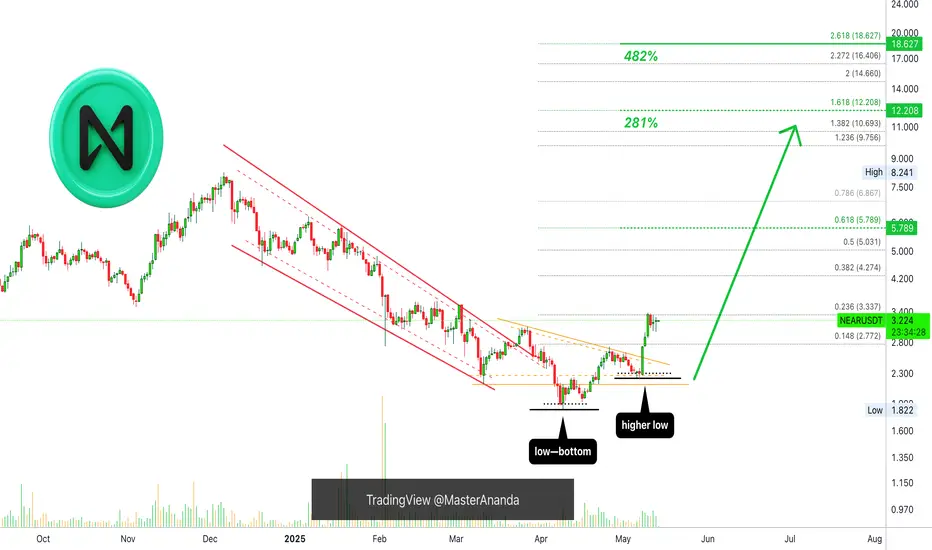
NEAR Protocol Easy Targets Up To 482%We just looked at Cardano and Binance Coin. See how different this chart looks. The large cap. projects have a pattern while the mid-cap. have a completely different one. The bigger cycle affects all the pairs in the same way but the charts are drawn differently, that is, a bear market will produce a decline on all projects at the same time but some will hit new lows while others will remain at support and so on.
So a bull market will produce growth all across but some will grow 10,000% while others only grow 500%. Some will hit new All-Time Highs while others will peak very low compared to their ATH.
Here, NEARUSDT, the bottom is confirmed through the higher low. The low followed by a higher low and then the continuation. The continuation is what seals the deal. We knew beforehand that the bottom was in but from a technical standpoint, the move 8-May and the chart as it is now is what confirms the bottom. With the bottom confirmed, we can look UP!
On the chart, these are all easy targets, even the higher ones.
Namaste.
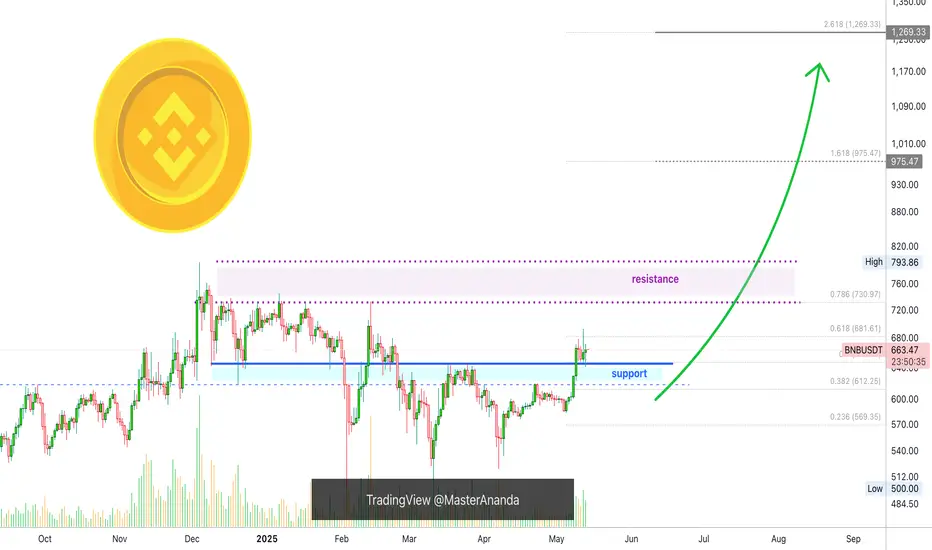
Binance Coin Will Trade At $1,200+, $975 First—New ATH TargetSupport has been confirmed and Binance Coin is now moving in the bullish zone. This is perfect. Now that the bulls have control of the Cryptocurrency market, we no longer have to focus on oscillators, volume, candlestick patterns and the rest, we can simply focus on the targets; things change.
This same approach will be true for all the charts. Instead of reading the signals and sharing "proofs" supporting my bias, we will focus instead on the targets and how far up the pair in question can go. Why? Because the bullish bias has already been confirmed and we are set to grow long-term. The 2025 bull market just as promised.
The first resistance is $730. This is a strong resistance because it rejected growth several times in the past. Many times in December, several times in January and February also. The All-Time High is pretty close as well so here again we will define a range. Between $731 and $794 is the first resistance zone.
BNBUSDT can grapple with this zone for a small while only to win. The win will clear the path for higher prices and open the price discovery phase. After this resistance is broken, the rise will be smooth and nice. Just growth followed by more growth, it will feel great.
The first target will be $975. This is the 1.618 extension in relation to the size of the corrective move. This is a level to watch out for on the way up.
The next target is awesome because the number is so big and because it goes beyond $1,000. The number is $1,269, that's the second—very strong—target.
Depending on how these levels are handled, we can look again and update the chart.
I don't know if this needs to be said, but, just to be certain: Binance Coin is going up .
Namaste.
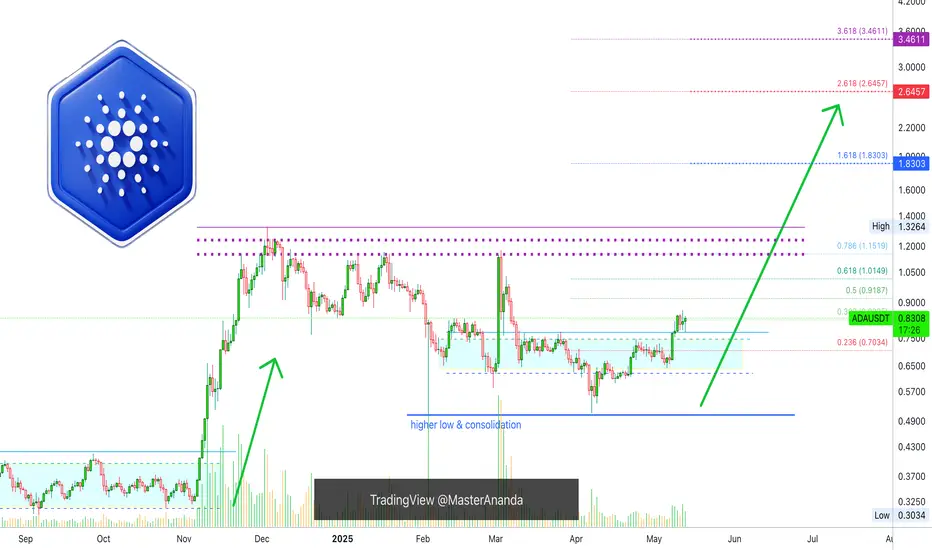
Cardano, Next Target (Weak vs Strong Resistance Levels)So the day started with a bearish tune but now is trading green. Based on the overall market conditions, this little event becomes a very strong bullish signal. This happening confirms the continuation of the bullish trend.
Notice thin blue line on the chart, it was drawn weeks ago but ADAUSDT bounced perfectly off this level. This means that the low is in.
With a continuation happening starting now/today, all that matters are the targets.
Where is Cardano likely to face resistance on the way up?
Which level is a strong resistance vs a weak one?
Consolidation has been happening since early February, which means that we have three months the market gaining strength. This means that Cardano can now perform a very strong move.
$0.91 is very easy and should be ignored. This is a weak resistance and Cardano can move straight up. There can be some days as the market never moves straight up, but no corrections or retraces are expected at this point. The same for $1.01. The next resistance is found at $1.15. This one yes, watch out for it.
The $1.15 resistance matches the rejection in early March as well as twice in January. It is also close to the peak in December. I drew a purple dotted line on the chart.
Since the December peak is so close, let's make the next resistance level a zone or range. Between $1.15 and $1.32. Or you can say $1.15 followed by $1.32. This is the first resistance to watch out for but it should break after a few attempts. It will definitely break because we had several months of consolidation and we are super bullish.
After this range, we have $1.83 and $2.64. Can go higher
These targets should all hit within 1-2 months.
I will leave the rest for another article, just so you have a reason to comeback.
Thanks a lot for your continued support.
Namaste.
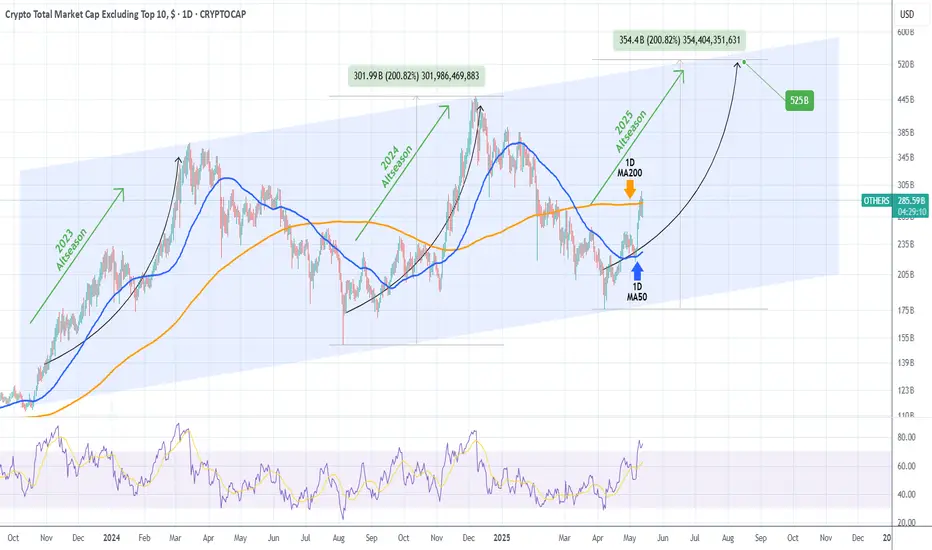
ALTSEASON is here!The Crypto Total Market Cap (excluding the Top 10 coins) broke above the 1D MA200 (orange trend-line) and is consolidating on an overbought 1D RSI (>70.00).
Since October 2023 when this set of conditions emerge, the long-term Channel Up starts a rally (technically its Bullish Leg). This is what in the crypto world is known as 'Altseason',which is when the lower cap coins see enormous gains relative to the top 10.
The last Bullish Leg (2024) rose by +200%. The previous one, even more. If it 'just' repeats the +200% Leg, we are looking at a market cap of $525 Billion.
The time to invest in alts is now!
-------------------------------------------------------------------------------
** Please LIKE 👍, FOLLOW ✅, SHARE 🙌 and COMMENT ✍ if you enjoy this idea! Also share your ideas and charts in the comments section below! This is best way to keep it relevant, support us, keep the content here free and allow the idea to reach as many people as possible. **
-------------------------------------------------------------------------------
💸💸💸💸💸💸
👇 👇 👇 👇 👇 👇
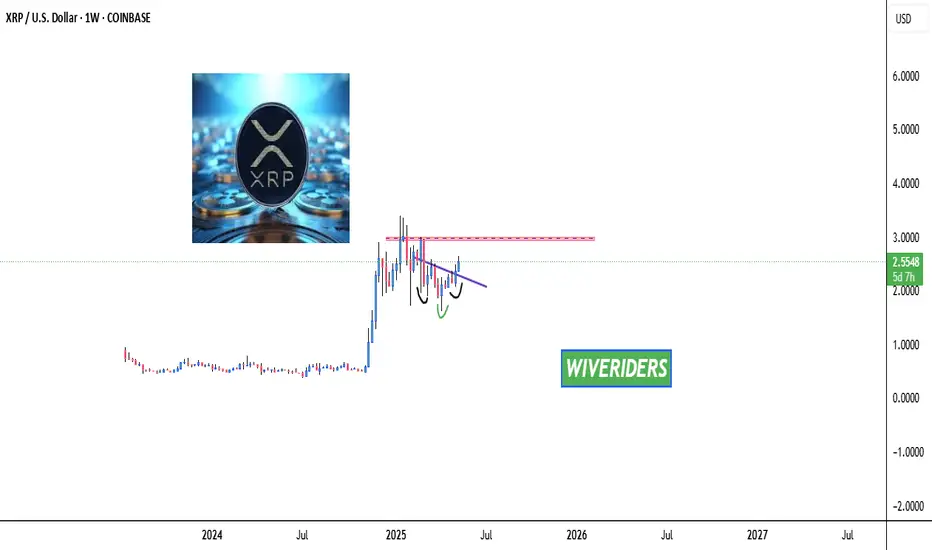
XRP Inverted Head and Shoulders – Watching for Resistance!🚀 CRYPTOCAP:XRP Inverted Head and Shoulders – Watching for Resistance! 📈
CRYPTOCAP:XRP has formed an inverted head and shoulders pattern and has broken out of the neckline (purple zone). However, we’re approaching a red resistance zone, and when the price reaches this level, there could be some retracement before continuing upward. 📊
Let’s monitor this move closely! 💼💸
LUNC Bullish Inverted Head and Shoulders – Target Ahead!🚀 SEED_DONKEYDAN_MARKET_CAP:LUNC Bullish Inverted Head and Shoulders – Target Ahead! 📈
SEED_DONKEYDAN_MARKET_CAP:LUNC has formed a bullish inverted head and shoulders pattern. If confirmed, the first target could be the green line level! 📊
Let’s catch this breakout together! 💼💸

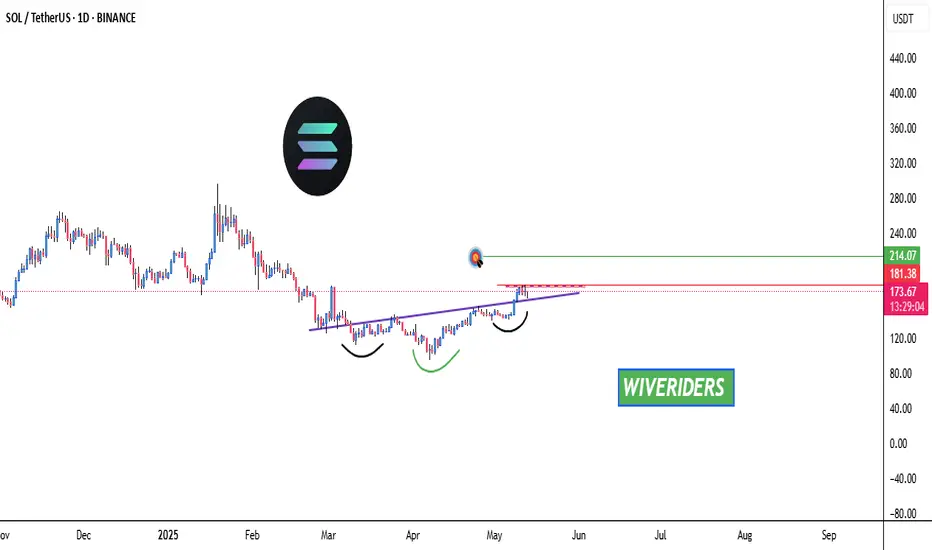
SOL Inverted Head and Shoulders – Breakout Potential!🚀 SOL Inverted Head and Shoulders – Breakout Potential! 📈
SOL has formed an inverted head and shoulders pattern and is now testing the red resistance zone. If the price breaks through this resistance, the first target could be the green line level! 📊
Let’s watch this breakout unfold! 💼💸
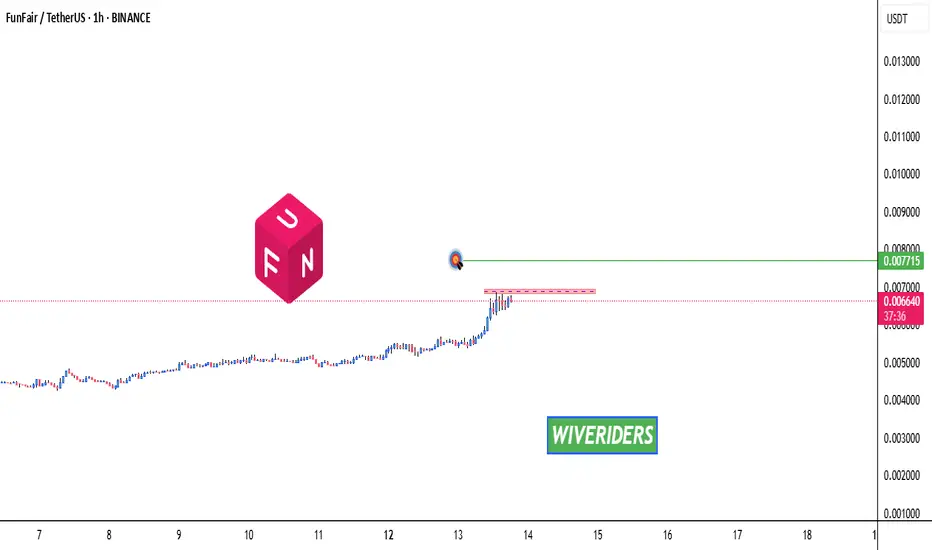
FUN Testing Red Resistance – Breakout Potential! 🚀 FUN Testing Red Resistance – Breakout Potential! 📈
FUN is currently testing the red resistance zone. If the price breaks through, the first target could be the green line level! 📊
Let’s catch this breakout together! 💼💸
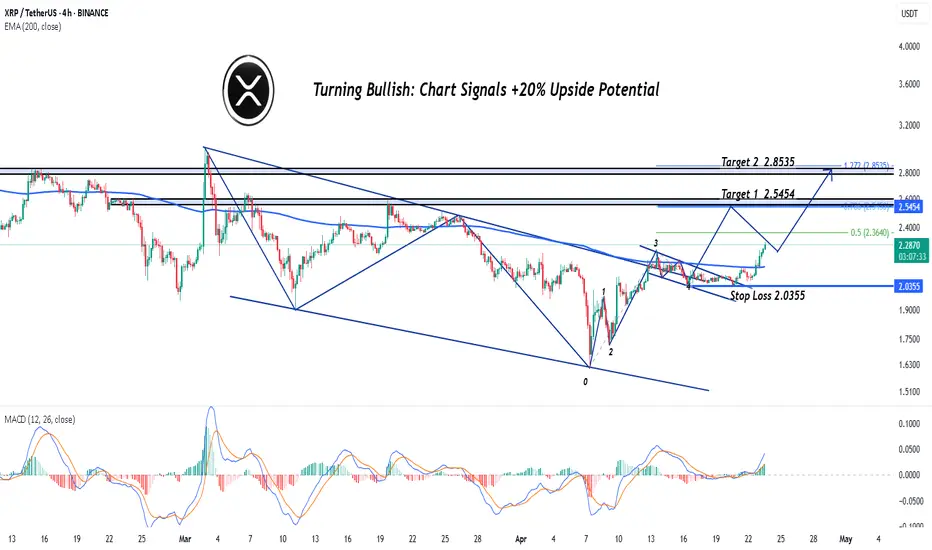
XRPUSDT: Turning Bullish, Chart Signals +20% Upside PotentialHey Realistic Traders!
Is XRPUSDT Gearing Up for a Major Bull Run or Just Faking Us Out Again? Let’s Break It Down...
XRPUSDT has finally broken out of its bearish channel, and price action is holding strong above that zone. This is a solid indication that bulls are gaining control. Shortly after the breakout, a smaller falling wedge formed, which is typically a bullish continuation pattern.
What adds further interest to this setup is that the falling wedge appears to be developing during what may be Wave 4 of the Elliott Wave cycle. While Wave 4 is usually corrective, it can occasionally take the form of a wedge or triangle-like pattern. If this interpretation holds, it would suggest that a bullish Wave 5 may follow, often the final impulse leg in the trend.
Zooming into the 4-hour chart, a fresh breakout has just occurred, further strengthening the bullish case. Adding to this, the MACD has printed a golden cross, a classic momentum signal that supports the outlook for continued gains.
With all these factors aligning, the first target is set at 2.5454. A minor pullback could occur at that level before price continues its move toward the second target at 2.8535. Both targets have been calculated using Fibonacci extension levels from the current bullish wave.
This outlook remains valid as long as the price stays above the stop-loss level at 2.0355.
Support the channel by engaging with the content, using the rocket button, and sharing your opinions in the comments below.
Disclaimer: "Please note that this analysis is solely for educational purposes and should not be considered a recommendation to take a long or short position on Ripple.
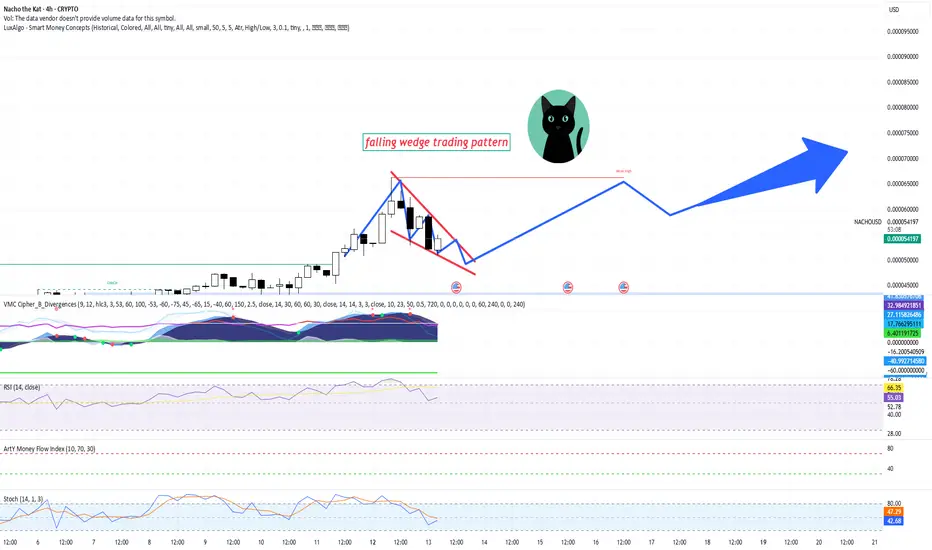
Nacho the Kat Bullish Falling Wedge Pattern Signals PotentialChart Overview
The chart shows a falling wedge pattern forming on a 4-hour timeframe for "Nacho the Kat" (NACHO/USD). This is a bullish pattern often indicating a potential price breakout to the upside, particularly after a period of consolidation within the wedge.
Price Action Analysis
Current Price: The price is approaching a potential breakout point, with the trend following the pattern outlined in the chart.
Falling Wedge:
The pattern suggests the price has been consolidating within lower highs and higher lows, creating a narrowing range. Historically, the breakout from a falling wedge tends to be upward, especially when volume and momentum indicators align with the trend.
Volume and Momentum Indicators
VMC (Volume Momentum Cipher): Shows divergence (highlighted by green and red dots). The momentum is slowing but still supports the possibility of an upward move once the price breaks above the resistance level.
RSI (Relative Strength Index): RSI is at 55.03, indicating neutral market conditions. There is room for upward momentum before reaching overbought conditions, which further supports the possibility of an upside breakout.
ArtY Money Flow Index: It is currently above 40, showing positive money flow, indicating that buying pressure is still relatively strong.
Stochastic Oscillator: The Stochastic is at 47.29, which is within a neutral range. However, it could suggest potential upward movement, especially if the oscillator crosses above 50.
Support and Resistance Levels
Support: The support level is represented by the strong low section of the falling wedge. A breakdown below this level could invalidate the pattern.
Resistance: The resistance lies at the upper edge of the falling wedge. Once the price breaks this level, it could indicate the start of a bullish move.
Trading Plan
Entry Point:
Wait for a confirmed breakout above the upper resistance of the wedge. A break above this level will provide a clearer confirmation of upward movement.
Consider entering the position at or above 0.0000057 USD.
Stop-Loss:
Place the stop-loss below the lower trendline of the wedge to limit potential losses in case the breakout fails. A reasonable stop-loss could be around 0.0000045 USD.
Take-Profit Targets:
Short-Term Target: After a breakout, aim for a conservative target around the next resistance at 0.0000065 USD.
Long-Term Target: If momentum continues to build, the next potential resistance levels may be around 0.0000075 USD.
Risk Management:
As with any trade, ensure to use proper risk management by not risking more than 1-2% of your total capital per trade.
Keep an eye on the volume and momentum indicators. If they show signs of weakening before the breakout, consider reducing position size or waiting for more confirmation.
Final Thoughts
The falling wedge pattern suggests that "Nacho the Kat" cryptocurrency may be preparing for a bullish breakout, but it's essential to monitor price action carefully. A strong breakout with increasing volume will likely signal further gains, while a failure to break the wedge resistance could lead to further consolidation or downside risks.
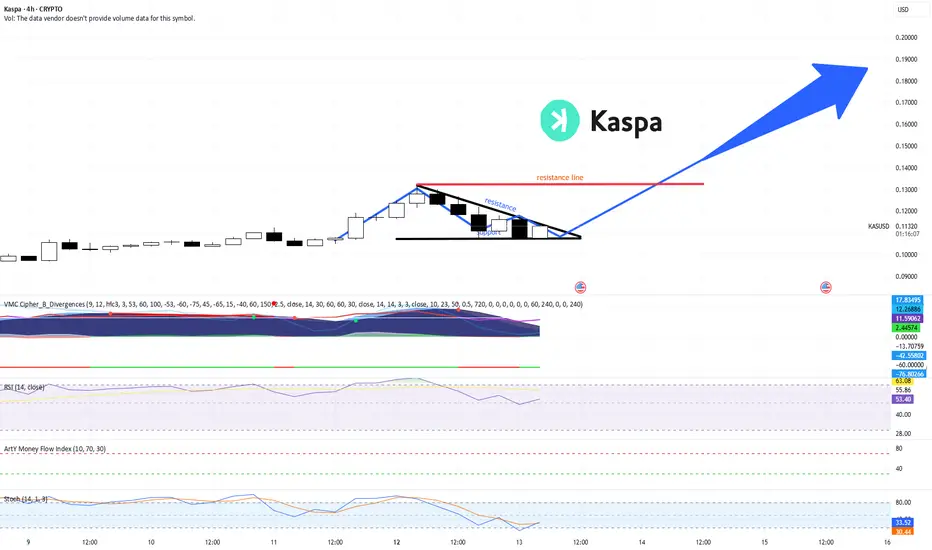
Kaspa on Its Path to Glory (TA + Trading Plan) + UPDATETechnical Analysis for KASPA (KAS)
Current Price: 0.11268 USD
Timeframe: 4-Hour Chart
Indicators and Key Observations:
Price Action: Kaspa is currently in an ascending triangle pattern, with price action approaching the resistance line, which has been tested multiple times without a clear break. This pattern indicates the possibility of a breakout if the price moves above the resistance line.
Support Zone: The support level has been consistent, forming a base near 0.1070 USD. This is a crucial area where buying interest has been observed.
Resistance Line: The price is approaching the resistance at around 0.1130 USD. A breakout above this level could signal bullish continuation towards higher targets (potentially 0.1900 USD as indicated by the chart’s blue arrow).
Technical Indicators:
VWC Cipher B Divergences: The indicator shows bullish signals, suggesting that price might continue to rise, especially if it successfully breaks the resistance line.
RSI (Relative Strength Index): The RSI is sitting at around 52.96, indicating that the asset is neither overbought nor oversold. This gives space for potential bullish momentum.
MFI (Money Flow Index): The MFI is relatively neutral, indicating that there is no immediate imbalance between buying and selling pressure.
Stochastic Oscillator: The oscillator shows a potential bullish crossover, with the signal line moving towards the overbought zone.
Trading Plan for KASPA (KAS)
Entry Strategy:
Long Entry: Consider entering a long position once the price breaks and closes above the resistance line around 0.1130 USD. Look for confirmation through a strong green candle to ensure momentum continuation.
Target: The primary target for this trade is 0.18 USD, as indicated by the blue arrow in the chart. A second target can be placed near the psychological level of 0.20 USD, depending on market conditions and price action.
Stop-Loss Strategy:
Place the stop-loss slightly below the support zone, ideally around 0.1060-0.1070 USD, to protect against a false breakout. The stop-loss should be adjusted as the price moves in your favor to lock in profits.
Risk-Reward Ratio:
The risk-reward ratio for this trade is favorable, as the potential upside (0.18-0.20 USD) significantly outweighs the downside risk (stop-loss below 0.1070 USD). A risk-reward ratio of 2:1 or higher is ideal for entering the trade.
Volume Confirmation:
Ensure that the breakout above resistance is accompanied by an increase in volume. Low-volume breakouts can lead to false signals, so confirming the move with higher-than-average volume is crucial for a successful trade.
Risk Management:
As always, never risk more than 2% of your trading account on any single trade. Use proper position sizing and adjust your stop-loss accordingly to maintain a controlled risk profile.
Recent News - Crescendo Upgrade 🚀
Today, Kaspa has rolled out its Crescendo upgrade, which boosts the network speed to 10 blocks per second. This is a major leap in scalability, enhancing transaction speed and efficiency. The upgrade is expected to drive greater adoption and increase investor interest, potentially providing additional support for the upward momentum in the KAS market.
Kaspa (KAS) is showing signs of bullish momentum, with key technical indicators pointing to a potential breakout above resistance. The recent Crescendo upgrade adds further optimism for the coin's future prospects, making this an exciting trade to consider. Be sure to monitor price action closely and implement strict risk management strategies for optimal results.
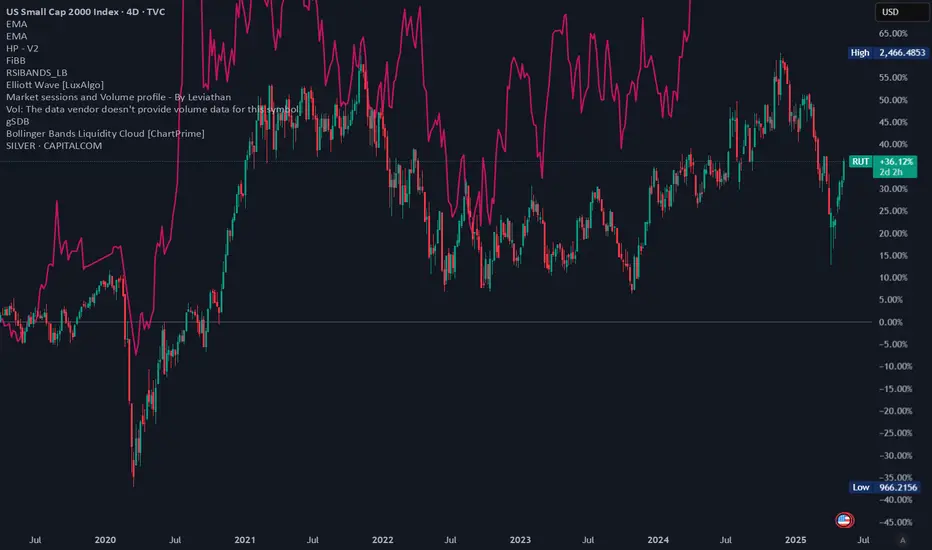
what is underperforming? Personally, I think small caps are where we should be looking for opportunities.
We see the people telling you 5-15% easy silver will pump before maybe something happens. Gold is in the same spot IMO. they want you to buy the sucker rally before the dump(As they build short positions).
I will be looking to buy some silver in a year or two when the divergencies look correct to me.
NOT FINANCIAL ADVICE!!