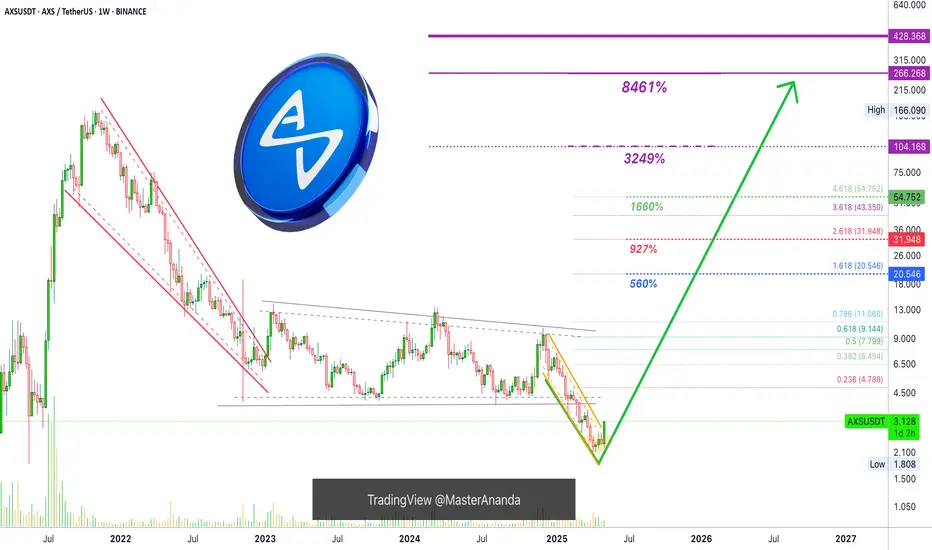
Can Axie Infinity Grow 8,000%? Let's Ask The ChartAxie Infinity is recovering from a final flush episode this week. The action just turned green after AXSUSDT hit the lowest price in 4 years, since May 2021.
First, it is still early for buyers and Cryptocurrency traders. Why? Because the action is happening at bottom prices. Just look at the chart, truly low prices as AXSUSDT is still trading below its 3-Feb. low but recovered above its March low already.
The recovery above the 10-March 2025 low within a single candle reveals that the bottom is already in. The final drop, which was a strong shakeout or stop-loss hunt event, not a bearish impulse, is over.
On the left side we can see the bear market wave. It lasted an entire year from November 2021 through November 2022.
This bear market is followed by a neutral-sideways market. This is the transition period.
Now the market is set to turn ultra-bullish but before this bullish cycle there is one final shakeout and that's the drop from December 2024 until April 2025. This move is intended to activate the stop-loss of thousands of traders. Once these people sell lower than what they bought, the market changes course. This is why I do not recommend using a limit stop-loss.
As soon as the multi-year low is hit, the market turns green. This is what is happening now, just watch! Axie Infinity is set to grow long-term.
Buy low to sell high.
Never set a stop-loss limit order on an exchange, it is a recipe for disaster. It is better to wait patiently because the market will recover and will produce strong, sustained, long-term growth.
I have two set of targets, the easy-local targets and the "global" targets.
The easy targets are 560%, 927% and 1,660%. The global targets include the potential for a new All-Time High. We will have to wait and see. I don't know of these purple targets will hit, but is good to be prepared.
Hope for the best and prepare for the best.
Thank you for reading.
Namaste.
Altcoins
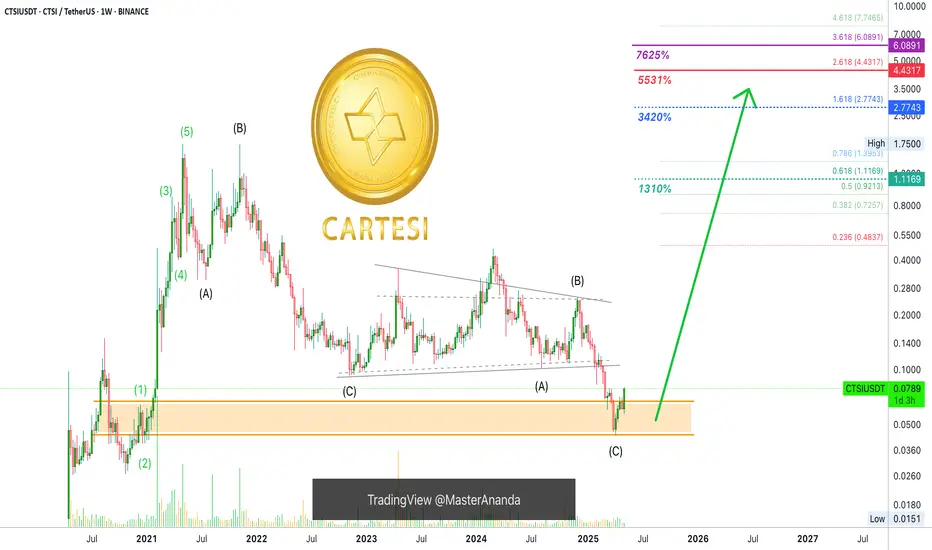
Cartesi 5,531% Profits Potential & 2025/26 Bull MarketMy dear friends, let us start a new day of writing with great Altcoins for you today.
I've been looking at hundreds of charts, literally hundreds. Nothing is trading at bottom prices anymore.
The Altcoins market is still within a long-term support zone and sometimes a long-term consolidation zone, but the true bottom, as in the lowest possible, is already gone. This is good, we had plenty of warnings and plenty of time to buy when prices were the lowest, it is time to move to the next phase.
We no longer have the lowest ever but still have very good entry prices all across the market. A great example is Cartesi, CTSIUSDT.
Here you can see the final big ABC and the action recovering above the mid-March low. While full green this week, CTSIUSDT still trades below its 3-Feb. low. This means that it is still early for this pair.
There is a long-term higher low between now (early April 2025) and October 2020.
We are facing the start of a bullish impulse in the form of a 5-up waves pattern.
Notice the potential for profits on the chart. This is what reveals that it is still early. It is still early because even if things end up badly, say a weak bull market, CTSIUSDT can hit $1.11 and produce a bullish wave totaling 1,310%. Since the bull market will be everything but weak, we can expect higher prices.
Not weak but ultra-strong. Something unexplainable and unimaginable. We have to see it, feel it and live through it in order to believe it.
Namaste.
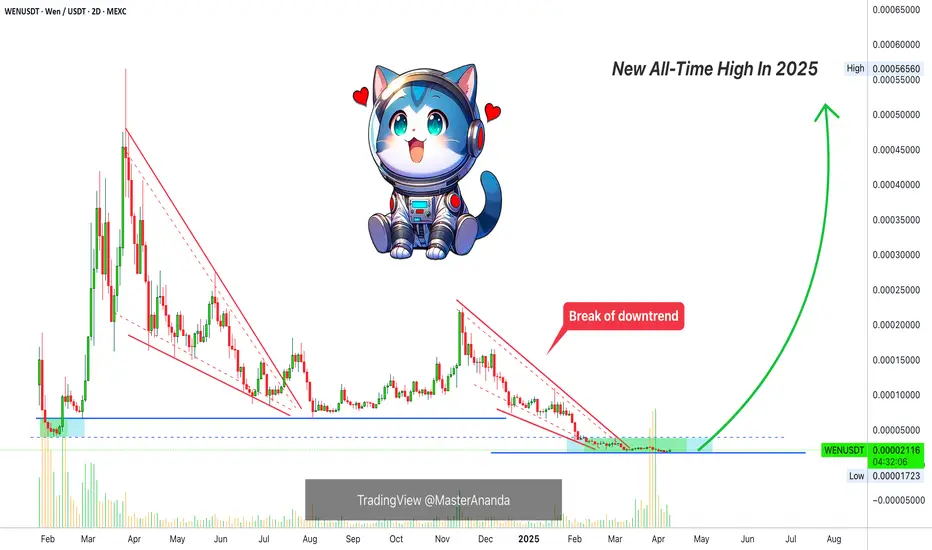
Wen: Your Altcoin ChoiceWen had a bull market in 2024. A 1,300% bullish wave that peaked in March. After this wave, the market went down and finally sideways.
The bullish signal here comes from the volume indicator. The highest volume ever happened in late March 2025, just two weeks ago.
This much buying at bottom prices can easily indicate that whales are starting to load on this coin. Whales buying is something to always consider because whales are in the know. They know when the top is in and when the bottom is in. When they start buying, the market is soon to change. When they start selling, it is the end of a bullish phase.
Here we can see no volatility, no swings, no momentum and no volume until the market enters new All-Time Low territory. Once this new low levels are activated, there is a huge increase in trading activity, buying and selling. So participants had no interest in this pair, as soon as prices became low, we see a strong accumulation phase.
This signal is quite revealing, it tells that whatever is happening now is about to change.
WENUSDT went from going down to sideways and from sideways lower to a new All-Time Low. After this sideways and ATL period, we will experience a new wave of growth. That's based on market cycle, marketwide action, experience and the volume indicator. Prepare for massive growth.
Imagine a bullish wave that starts to build up now and peaks after 3 months. 1-2 months with momentum building up and the last month a major wave of growth. After this wave, the classic correction. But this correction won't lead to a new low and consolidation phase. Instead, this will be a quick correction that will lead to a new session of growth, the last and final; the bull market bull-run phase.
Thank you for reading.
Namaste.
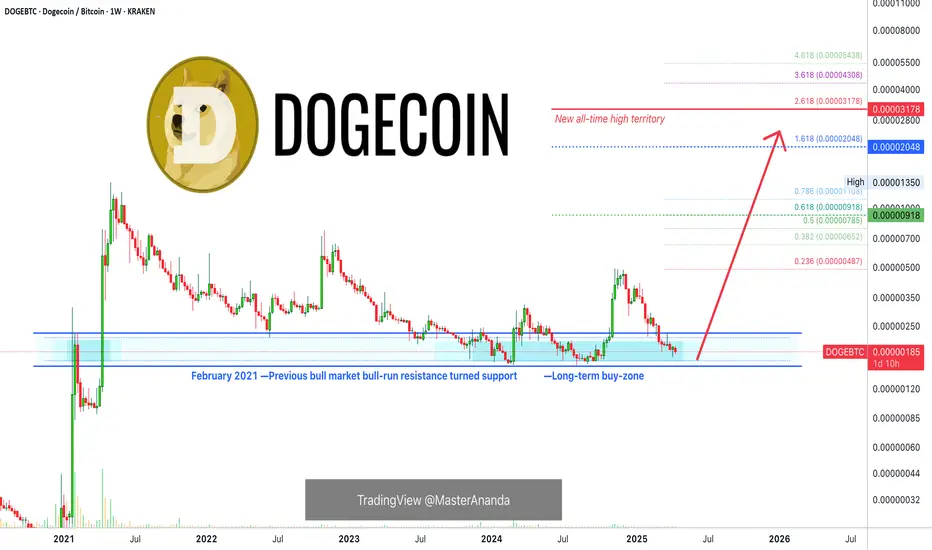
Dogecoin Vs Bitcoin: Mapping The 2025 All-Time HighThese are not the numbers that I am using for my DOGEBTC trade, these are very strong targets, for my numbers I am using the conservative targets for whatever reason. I guess it has been just too long since the last bull run phase.
Dogecoin is now trading within a long-term support zone vs Bitcoin, the strongest support range ever for this Cryptocurrency trading pair.
In the 2021 bull market, this level worked as resistance before the fifth and final wave. After the end of the bull market, this resistance turned support and it has been tested over and over and it holds.
The first time it was tested was June 202, then again in late 2023, early 2024 and again late 2024. This is the blue zone on the chart.
After the bullish jump last year, DOGEBTC is back again moving in this trading range. The action is happening as a higher low compared to previous years and there is no volume. It is 100% certain that this support will hold, which means that we are now in a very strong buy-zone, the accumulation zone. The best entry range possible before the 2025/26 bull market phase and bull run.
» Buy and hold.
Namaste.
Xai's Downtrend Ends With A High Volume BreakoutThe Cryptocurrency market is entering a very interesting period right now. Unless you've been around for more than 4 years in this market, you haven't seen anything like it.
There was strong growth in late 2023 into early 2024 and also in late 2024 into 2025, but nothing compared to what you are about to experience, this is different.
Some pairs grew thousands of percentages of points in the last few years, I shared many charts for these so they don't need to be mentioned again. Really strong and yet, what you are about to experience is something completely different.
The best example for comparison is the last bullish wave. The build up phase took three months and then at the end there was a bullish period lasting 3-4 weeks. That's it. The bottom was hit August 2024 and the Altcoins went sideways. They were not really rising but more sideways than anything and in late November a strong advanced happened. This advance ended just as fast as it started and a long corrective phase developed.
This is the second part, after each bullish wave there was always a strong correction after the 2021 bull market, this time it will be different.
First, imagine that the build up period instead of sideways consist of up. Prices start to grow... Up, up, up slowly and then a major advance. Imagine the pair you hold growing for months and then a strong advance on top of all that growth.
The second part is the correction. Each bullish wave for several years would be followed by a strong correction and boring period, not this time. The strong advanced will be corrected but the correction will lead to a strong resumption and then months of additional growth, a completely different dynamic. This is it.
So you are about to experience something great.
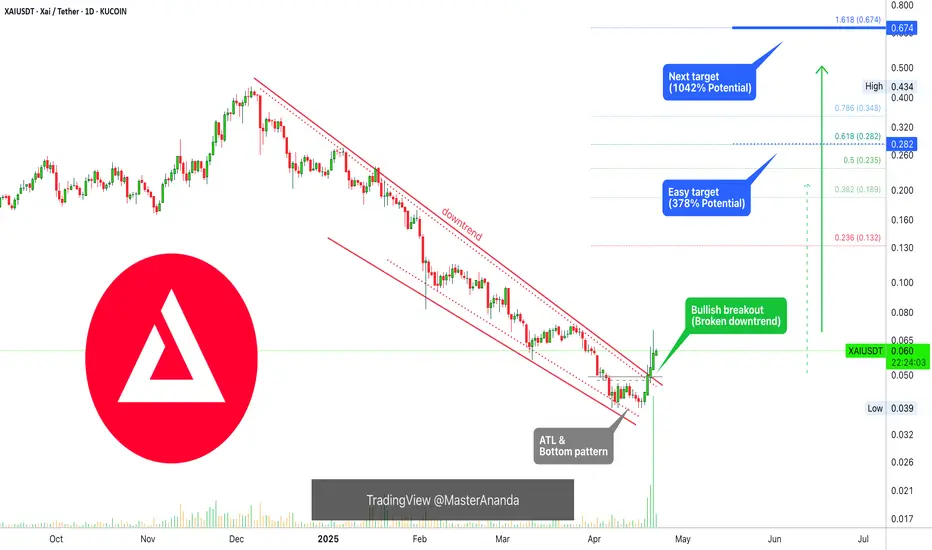
» Here XAIUSDT is making a strong breakout from a bearish-downtrend on high volume. This is the start of the 2025 bull market for this pair. The same is true for many other Altcoins.
Do not try to catch the ones that are already moving, buy the ones trading low near support, before the breakout, and wait. In this way, you can enjoy the entire wave when the breakout happens.
I am wishing you tons of profits, great luck, health, wealth and success.
Thank you for reading.
Namaste.
Kaito: Easy Short-Term Trade Setup (PP: 130%)This is an easy trade setup. It is a short-term trade-idea based on the daily KAITOUSDT chart.
The chart bullish signals consist of: (1) A broken downtrend, (2) a rounded bottom and low 7-April and (3) a higher low 4-May.
After this combination of signals, today we have a full green candle and bullish wave. The higher low coupled with this candle is the continuation of the bullish move that started after the April low. Seeing that the downtrend has been broken, we can expect higher prices in the weeks and months to come.
The target on the chart is an easy target, it can go much higher of course.
Thanks a lot for your continued support.
This is how an easy trade setup looks like. Easy to spot, easy to buy easy to hold.
Namaste.

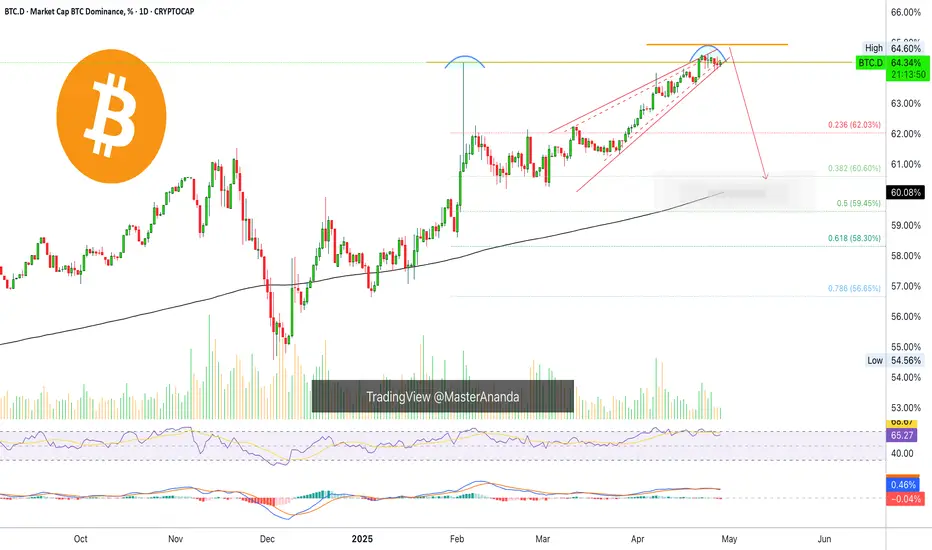
Bitcoin Dominance TA, Bearish SignalsRecently I spotted a very strong, long-term bearish signal on this index. A triple-bearish signal as it is present with three indicators. I am talking about a bearish divergence.
Volume has been dropping significantly as the index moves higher.
The weekly RSI peaked October 2023 and has been producing lower highs. The MACD peaked July 2023.
These are long-term, but let's have a closer look and consider the daily chart.
Here we have some interesting signals as well, let's start with the candles:
—Here we have a rising wedge ending in a rounded top and long-term double-top. The uptrend is also in risk of failing. A breakdown of this uptrend, which can happen anytime, would result in a strong crash of this index.
Next is the daily RSI:
—The peak happened November 2024. There is also a short-term lower high as the peak this month happened on the 7th of April, the index peaked on the 22nd.
—The daily RSI is already trending lower.
Clearly the most interesting and revealing of all three indicators is the daily MACD. Let me show you the chart first and then I'll describe the signals:
—Here the lower high is so strong that reveals what is coming to this index. The MACD peaked in February and produced a lower high this month, April. Notice the bearish cross, it happened yesterday.
The daily MACD and RSI trending down with short-term, mid-term, long-term and long long-term bearish divergence all point towards a lower reading on these oscillators.
The last major drop for this index happened in November 2024 with the bottom hitting a month later, December 2024. At this time Bitcoin produced a very strong advance as well as the entire Altcoins market, it was awesome.
It is surely interesting to notice that the index recovers and moves higher while Bitcoin continued to grow. But at that time the Altcoins were starting their correction. Most of the Altcoins peaked late November 2024 and some in early December 2024. So this index is more related to how the Altcoins behave rather than Bitcoin.
When it drops, it does not mean that Bitcoin will drop but that the Altcoins will grow. When it grows, it does not necessarily means that Bitcoin is moving up but that the Altcoins are moving down.
We know the Altcoins are set to produce their strongest growth period since 2021. This Bitcoin Dominance index works as confirmation. It leaves no room for doubt.
» Doubt can remain open as to whether the start of this rise will happen tomorrow or within a few weeks. Short-term, anything goes; the market can become erratic and produce some strong shakeouts, specially preceding a major wave of growth. But after 2-3 weeks, it is 1,000% certain that the entire Cryptocurrency market will be bullish and up. Regardless of what this index does or anything else for that matter. When the time is ripe, the market grows.
The time is ripe right now... You will be happy with the results.
Namaste.
Ethereum waking up?One of the most disappointing projects in the crypto space in recent years has to be ETH, losing ground on BTC since September '22. Finally ETH looks to have woken up outpacing BTC this week and broken out from the daily downtrend channel and currently at the underside of the DAILY 200 EMA.
BTC.D has printed a SFP and dropped 2% from 65.4% to 63%, could we be seeing a rollover and rotation into altcoins?
How I see it the moving average should cap off this move for now and a retrace towards the breakout area & previous lower high. That would then be the first higher high and higher low of this calendar year, a very bullish change in structure.
A more aggressive bullish scenario in the short term would be a reclaim of the 1D 200 EMA, leaving the inefficiency zone at the breakout level unfilled.
Either way the next HTF target is $2,800 for ETH which would bring price to the range midpoint and a key supply zone with many resting Stop losses.

Bitcoin @$100,000 | Top Altcoins Choice —Your Pick (Session 6)Good morning my fellow Cryptocurrency trader, what a wonderful day.
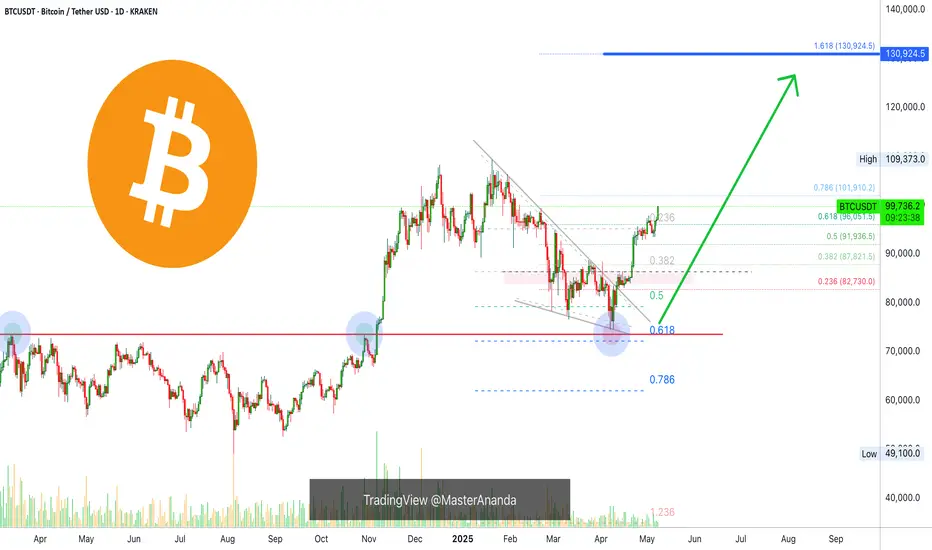
Bitcoin is now on its fifth consecutive green week and challenging $100,000 as resistance today.
The last barrier was a price range between $94,000 and $98,000. This barrier is now gone. Bitcoin continues to move higher day by day yet trading volume is still low. What does this means? It means that we are yet to experience the real bull market wave, bullish momentum will only grow and reach astronomical proportions late this month.
We are going up.
As Bitcoin hits $100,000 for the first time after the correction phase, the Altcoins market is sure to follow and we will see an explosion of projects breaking up and reaching new heights. Timing is still great for many pairs. Not early, but definitely not late.
Top Altcoins Choice —Your Pick (Session 6)
Leave a comment with your favorite Altcoin trading pair I will do a full analysis for you. I will switch between publishing in my profile and answering in the comments section.
You have to visit @MasterAnanda to find your analysis when I reply to you as new publications cannot be shared in the comments.
I will do mainly one pair per person/username/supporter.
The Altcoins are hot now... It is not too late, we still have to experience the entire 2025 bull market bullish cycle and bull run phase. The bull market might extend beyond 2025 but the main date for a new All-Time High is around November. Can be December 2025 just as it can be October, there will be strong variations between projects and pairs.
Definitely, many projects will continue growing into 2026. Overall, the next bear market should very small in duration, and then once more maximum growth. The bear market this time around will look like a simply correction and there won't be 2-3 years of consolidation, not anymore. This time around, we are going to see real-true long-term growth. An entire decade of growth.
Leave a comment to show your support —boost and follow!
Namaste.
others altcoins MAKE ALTCOINS GREAT AGAIN 🧲💹
Others monthly handle cup neck part tested and on the rise
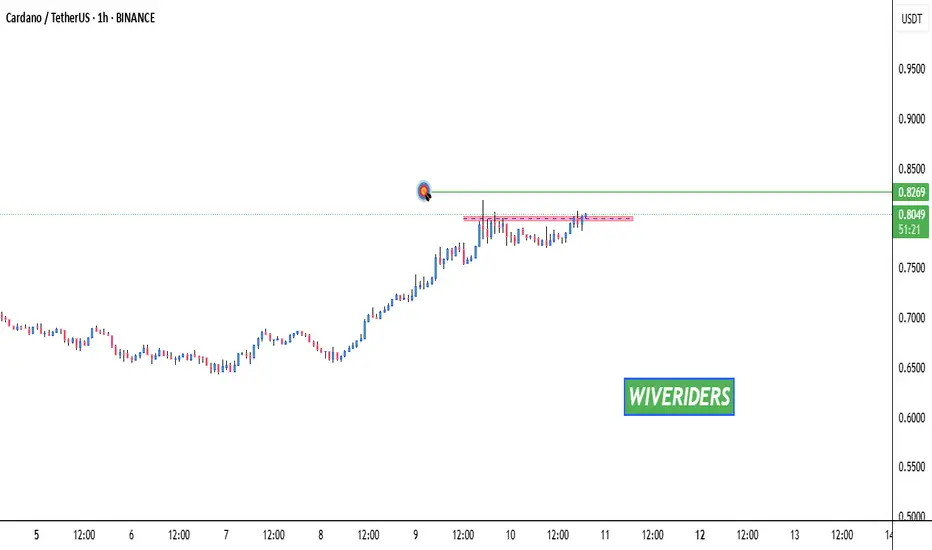
Testing Red Resistance – Breakout Potential!🚀 CRYPTOCAP:ADA Testing Red Resistance – Breakout Potential! 📈
CRYPTOCAP:ADA is currently testing the red resistance zone. If the price breaks through, the first target could be the green line level! 📊
Let’s catch this breakout together! 💼💸
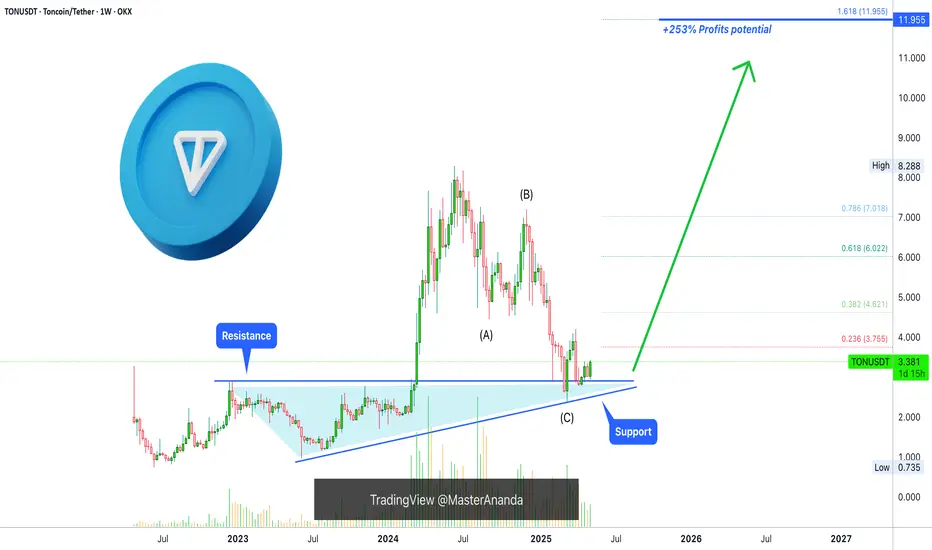
Toncoin: Still Early But Bullish (PP: 253% & 429%)Believe it or not, it is till early for Toncoin and this is good news for buyers. It is still early but very bullish.
The low here happened 10-March 2025, which means that buyers were present in April and ended up supporting the project and not letting it produce a lower low. This reveals how strong this pair will grow in this bullish cycle.
The current weekly candle is trading above the two previous weeks open and close. This little simple signal reveals that the continuation of the initial bullish reaction when the low was hit is about to happen, or you could, it is the start of the next bullish wave.
The main target I am showing here is $11.95 for a nice 253% profits but there is more. This is the final target only because I am using the linear chart. There is also $17.88 for a great 429%. These targets should hit easily as the bull market develops, expect growth long-term.
It is still early for Toncoin, early but bullish.
Thank you for reading.
Namaste.
Waiting for a Perfect Entry! 🚀 SEED_WANDERIN_JIMZIP900:WIF in Uptrend – Waiting for a Perfect Entry! 📈
SEED_WANDERIN_JIMZIP900:WIF is currently in an uptrend! If you missed the entry, you can wait for a correction. Once the price comes back to the green zone, keep an eye out for confirmation to enter long! 🔥
Let’s catch the next opportunity together! 💼💸

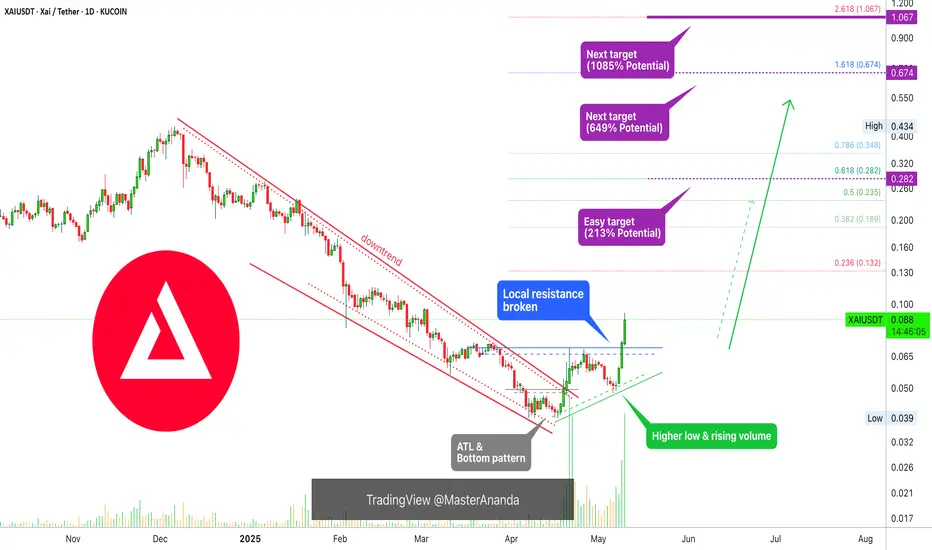
Xai Becomes Extremely Bullish, Additional 1085% Profits PossibleThis is an update for a trade setup from late April that initial had more than 1,000% potential for growth. I will share the link in the related publications.
» XAIUSDT is now extremely bullish. What makes this chart different to others is the really high volume. This high volume, from a technical analysis perspective, works to support any bullish signal already present on the chart while at the same time reveals lots of interest for this project and trading pair.
It is still early and there is huge potential for growth here. The targets shown on the chart are easy targets, there will be more long-term. Actually, I added some more targets...
Thanks a lot for your support. This is a good choice if you looking for a pair that is strong and safe, based on the chart. The bullish action is starting now, intensifying, but should go on for months.
You can easily approach this pair with a buy and hold strategy. Please remember, after buying prices can start to decrease, at this point, we simply hold rest easy, waiting for the resumption of the bullish trend.
When lots of people become active and join the market, normally it is right at the time when most pairs are about to take a break. If a break does happen, just know that the action will resume in a matter of weeks or days. Weeks if it is a long retrace/consolidation, most of the time the pause will only last days.
Long-term growth. Higher highs and higher lows.
You can read everything I publish daily, also the articles I published since 7-April, and you will get a good picture as to what is happening with the market and what to expect. @MasterAnanda
Thanks a lot for your continued support.
Namaste.
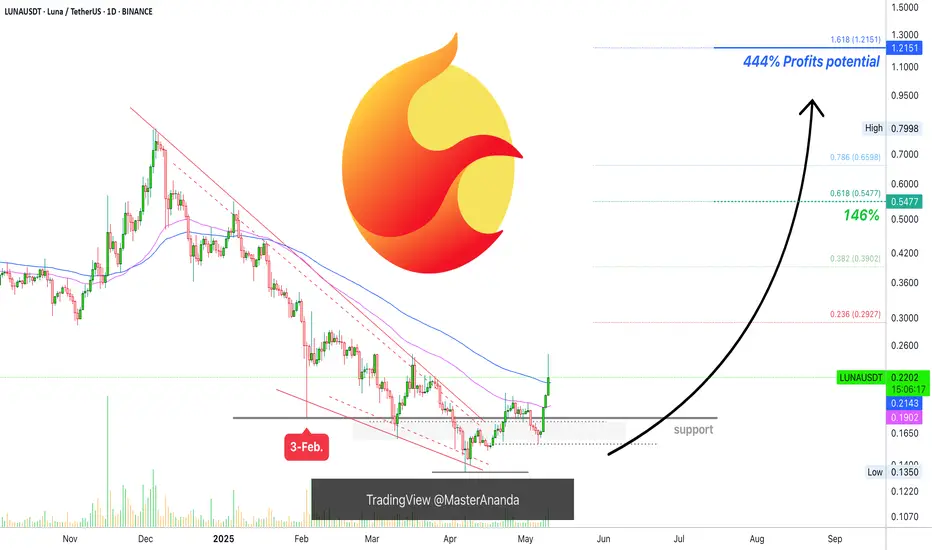
Terra Luna Bottom & Bullish Reversal (444% Profits Potential)We know for a fact that the main low of the correction happened 3-Feb., this is shown here with a red candle with a long lower wick. The lower lows after is a continuation of this move.
As soon as price action moves back above this low, we can say that the bulls are in, but this is not all for Terra, LUNAUSDT.
First, we have the candlestick pattern three white soldiers, three consecutive strong green sessions on the daily timeframe. This signal can be followed by a retrace that ends in a higher low followed by additional growth.
This signal is supported by rising volume. Volume is rising slowly each day and the third and last day has the highest volume in weeks. Of course, the downtrend has also been broken.
Finally, the action is happening above EMA55 and today above EMA89. So the long-term bullish bias and growth potential is being activated.
There is a more, the RSI is really strong and MACD on the bullish zone (not shown). All these are classic signals revealing that Terra Luna is set to experience long-term growth.
The correction is over.
The bottom is in.
Crypto is going up.
Namaste.
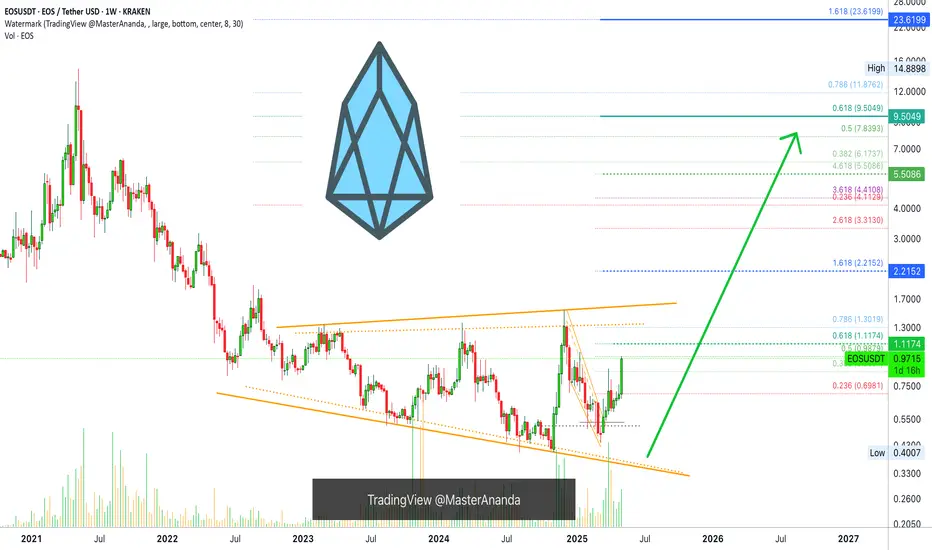
EOS Update: New 2025 All-Time High & MoreWe've been looking at the daily timeframe for EOS and the daily timeframe is mostly short-term. This is because we were focused on a leveraged trade setup. But, now that the bullish bias has been confirmed—notice how big is this weekly session—we can consider the bigger picture.
Here is EOSUSDT still moving within the long-term consolidation channel that appeared after the 2022 bear market. Immediately we can extract some positives out of this information, it is still early.
While EOS has been growing now for two months straight, since March 10, the action is still happening below the early December 2024 high. This high is part of a long-term consolidation channel.
As the action turns bullish and a recovery develops, EOS will finally enter the bullish zone. The bullish zone activates higher prices and these higher prices will lead to the 2025 bull run ending in a new All-Time High.
The targets are divided in two sessions, the local targets ending around $5.50 and the "global" targets which show $9.50 as a strong level, $11.8 and also $23.6 as a new All-Time High potential. This is only a potential because I haven't given much thoughts to these numbers. My strategy is to keep it clean and simple. Get the bottom—buy when prices are low—wait patiently and let the market grow.
Just as the market showed us with clear and strong signals when the bottom was in, it will also reveal when the top is in. We just buy and hold and when prices are up, we enjoy the profits and consider selling when the action is near a top. Not the perfect top, but near the top because it is hard to know how far up a Cryptocurrency can really go.
When the last wave comes, the market becomes euphoric and everything gets out of control. A rise to $23 can lead to $34, $55, $80 or even more because the last wave is the speculative phase, anything goes.
I hope you enjoy the content.
It is still early.
Thanks a lot for your continued support.
Namaste.
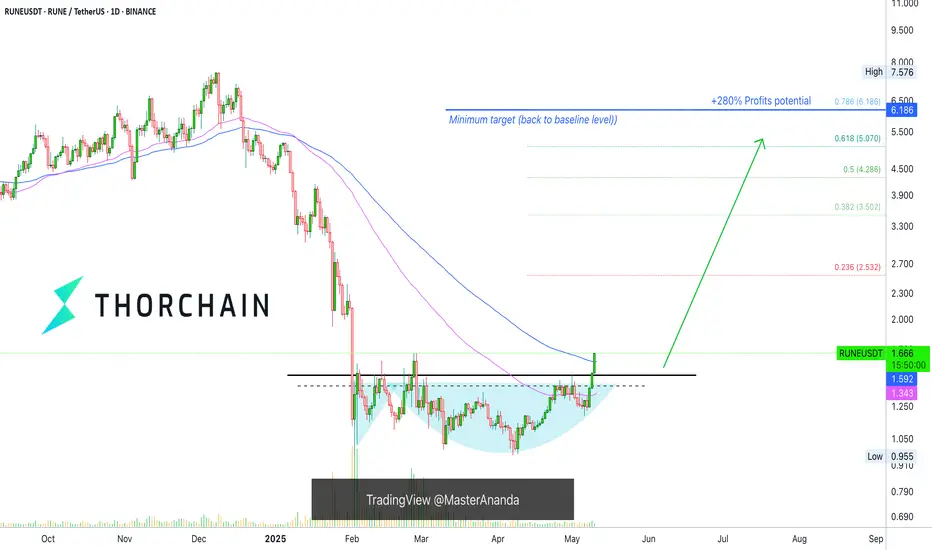
Thorchain "Back To Baseline" Easy 280% Profits TargetThorchain (RUNEUSDT) is no longer bearish, the bullish bias is now fully confirmed and this statement is supported by many chart signals. Let's look at those.
First, there is a strong and classic reversal bottom formation, the Adam & Eve pattern.
This pattern was completed when RUNEUSDT moved above its base (black line on the chart).
This pattern on its own is a strong reversal signal but that is not all, today RUNEUSDT is moving above EMA89 and recently conquered EMA55 daily for the first time as resistance. This is happening with three green daily candles and the strongest bullish momentum since March 2024.
Current action is indicative of so much more to come, but here we will focus on something basic and simple, the "baseline."
This is a very easy target, RUNEUSDT is set to test the December 2024 resistance zone, the price zone from where it took the plunge. Obviously, this resistance will break after some challenge easy, but this is the first and main level that will be tested on this bullish wave. That's a very easy 280% profits target in the coming months, very easy with a strategy based on buy and hold. You can't go wrong. You will be happy with the results.
Thorchain will grow, Bitcoin will grow, the Altcoins will continue growing and what you are witnessing now, is only the start.
Thanks a lot for your continued support.
Namaste.
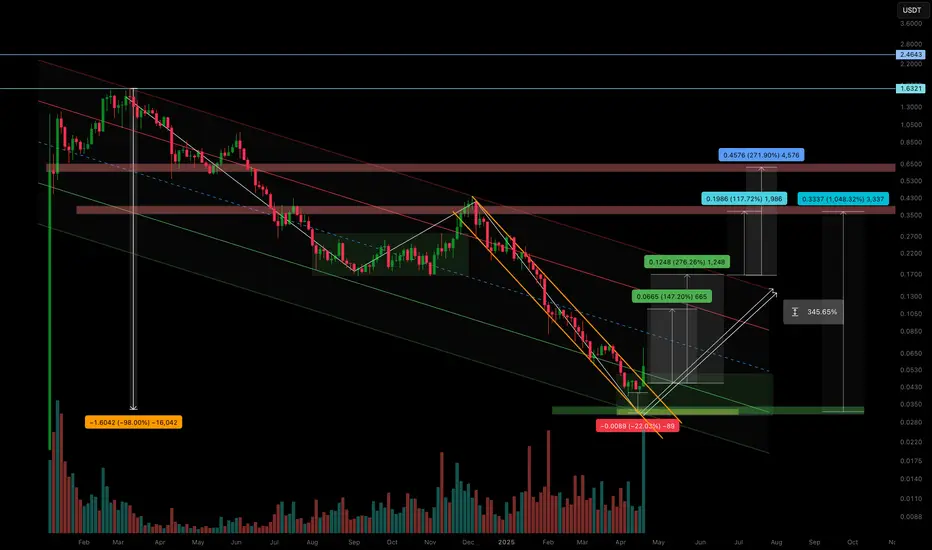
XAIUSDT — profit protection, risk management, area of interestXai (XAI) - is a cryptocurrency designed to revolutionize the gaming industry by enabling real economies and open trade within video games. Developed by Offchain Labs, Xai operates on the Arbitrum platform, a layer-2 scaling solution for Ethereum, which enhances its efficiency and scalability.
One of the standout features of Xai is its integration of Explainable AI techniques. These techniques make automated trading bot systems more transparent and trustworthy, addressing a significant concern in the cryptocurrency space. This transparency is crucial for fostering trust among users, particularly in the context of in-game economies where players trade valuable items.
📍 CoinMarketCap: #373
📍 Twitter(X): 308.5K
___________________________________________
🛡️ Risk Management and Approach:
When trading low-liquidity coins , I allocate a specific portion of my portfolio in advance for such trades.
These funds are split across different projects , which allows for diversification and helps mitigate potential scams .
If one coin pair dies — it's not critical , as long as the portfolio is structured properly.
📉 Current Situation:
On the broader view, the price is moving within a large descending channel .
Right now, it's near the outer support of the inner channel.
Since I’ve already allocated funds for this coin, I’ve taken a small entry near the support of the inner channel , and I plan to add more in the lower marked zone .
There’s a high probability of price chop due to news (tariffs, rates, debt ceiling, refinancing), and I take that into account.
💭 General Thoughts:
Diversification is key. You can never rule out the possibility that any project might end up as a scam. But with proper portfolio structure, that’s not a major issue .
There’s nothing to fear if you have a clear plan and tactics for different scenarios.
Like many other coins right now, I see the current accumulation zones as solid .
🔁 Additional Observation:
The recent mass delistings on Binance mainly target projects listed during the 2021–2022 distribution phase.
There’s a chance the exchange is cleaning up future risks , while “fresh” coins listed under the new conditions may stay longer.
📌 This post is not financial advice. It reflects my observations, actions, and logic in managing the position.
Notcoin New All-Time High Confirmed (1400% Profits Potential)Yes! I am being serious, a new All-Time High is what will happen next and has been confirmed.
Good morning my fellow Cryptocurrency trader, let's go straight to the chart because things are starting to become exciting.
Remember the "final resistance" we've been tracking? Today this resistance level finally breaks on a full green candle, the third consecutive green day.
After 7-April, Notcoin started its bullish advance by producing a double-bottom 16-April. This double-bottom led to the steps pattern where NOTUSDT started growing for more than 10 days straight, slow and steady growth. The final resistance pushed prices lower and this lower ended as a higher low.
This leads to market conditions as they are today. The higher low started with a full green candle that pushed NOTUSDT back above EMA55, then another full green candle to challenge resistance, and today the action went above producing the highest price since early March and erasing the entire bottom pattern and market correction. The bulls are now in control.
With bullish momentum growing after a bottom was hit, this is not the end but only the start. We will see Notcoin growing long-term, higher highs and higher lows and a new All-Time High is in the cards for 2025, late 2025 and this opens up more than 1,400% potential from current prices, an amazing bullish wave.
Seeing the bigger picture and how much potential there is for growth, we can say that it is still early, because Notcoin will be growing daily for months and months and months.
This is a friendly reminder, you can still jump in, buy and hold.
Namaste.

The Altcoins Market Is Ready To Grow —Altcoins Season 2025The Altcoins market is ready to grow and here I have all the proof that you will ever need.
Good afternoon my fellow Cryptocurrency trader, how are you feeling today?
We know that the Cryptocurrency market is one; What one does, the rest follows.
We know that Bitcoin is the king of Crypto and when Bitcoin is bullish, the rest of the market also turns green. But Bitcoin being bullish isn't always all that is needed for marketwide bullish action. Bitcoin needs to be bullish but at a strong price, bullish confirmed. And that's exactly the situation we have today.
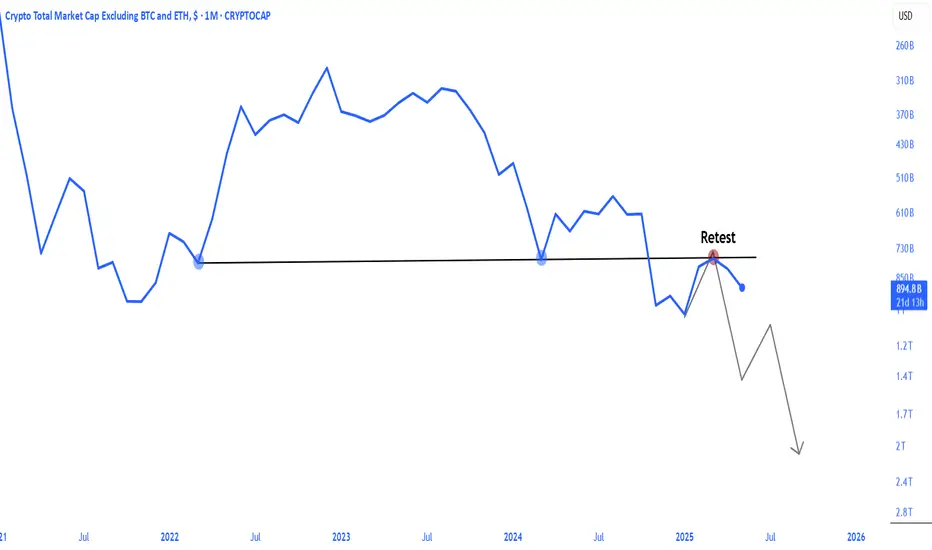
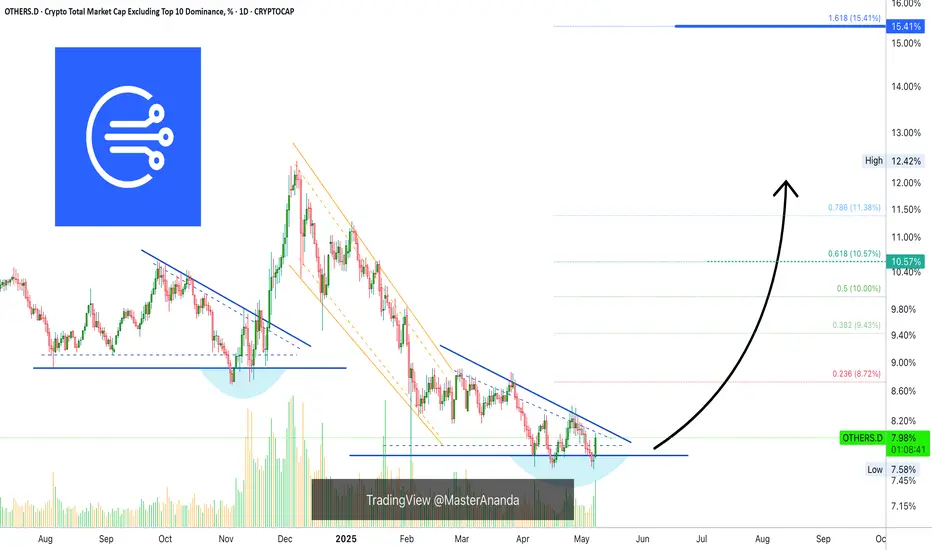
Today Bitcoin crossed easily and with a full green candle the $100,000 price barrier. Not only $100,000 but higher, $104,000 after trading as low as $96,800 today. With Bitcoin ultra-bullish, the Altcoins are set to follow and this chart—OTHERS.D—confirms not only the big Altcoins will follow but all Altcoins, the smaller ones as well.
Here is the best piece of news I can give you:
When Bitcoin grows 10%, the smaller Altcoins can grow between 50-100%.
When Bitcoin grows 30%, some of these Altcoins can grow up to 300%. Most of them can grow anywhere between 100 and 200%. This scenario is already present.
From Bitcoin's bottom around $74,500, it is already some odd 30% up. But, the smaller Altcoins do not start growing together with Bitcoin, only when Bitcoin becomes really strong. Bitcoin is really strong now so all the Altcoins grow.
When Bitcoin grows, say 50%, from $100,000 to $150,000, many of the OTHERS Altcoins will be growing between 300 and 500%.
When Bitcoin grows 80-100%, these Altcoins will be growing between 600% and 1,000%. So these pairs can be used to earn as profits in the same range as with a leveraged trade but without the liquidation risk.
So you can earn 5X, 6X or 10X on a small Altcoin, while Bitcoin produces its bullish wave.
Here the OTHERS.D index hit bottom yesterday and today is starting to grow. We have a full green candle and the action moving above support, the 7-April low.
The chart patterns, price dynamics and market conditions are pointing toward this index moving up. This moving up is the proof that the smaller Altcoins are set to grow strong. This means that these will grow faster than Bitcoin, Ethereum, Cardano, Solana, Dogecoin, XRP, BNB, Tron and all those in the TOP10. Don't get me wrong, everything will grow, but it is time for the Altcoins season.
Thanks a lot for your continued support.
Namaste.
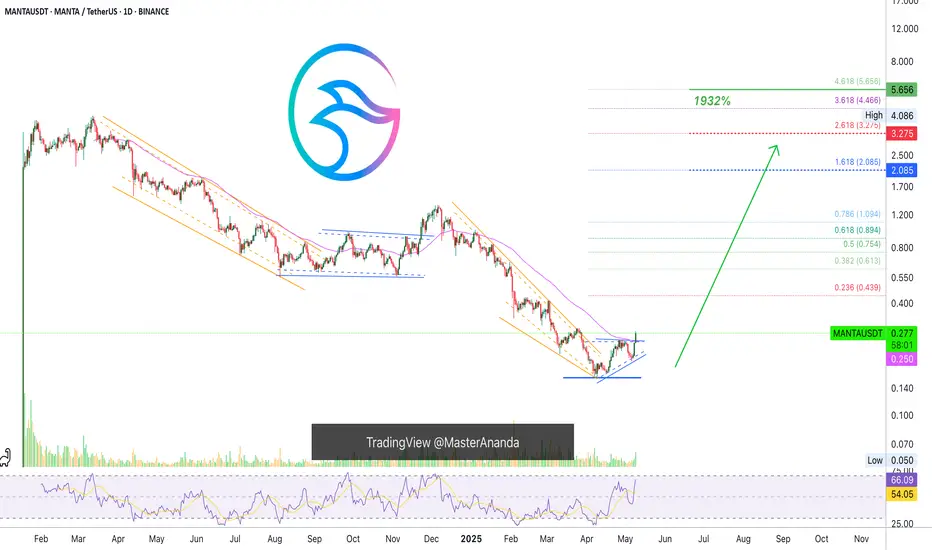
Manta Classic Bullish Signals = Bull Market Confirmed—PP: 1900%This analysis can be used not only to spot the trading opportunity that is now MANTAUSDT, but also for learning purposes. Let's go back to basics.
Here MANTAUSDT is breaking daily above EMA55. This break is happening with a full green candle and yesterday's candle also closed full green. Today's full green candle has above-average trading volume and is coming after several short-term higher lows. So this is a constellation of signals. One signal, the break of resistance, supported by many additional signals (volume, candles and chart pattern).
The classic signal is the break above EMA55 on the daily timeframe. This confirms a bullish potential for the mid-term, minimum, which means 3 months.
The next signal comes from the RSI, it is super strong. A hyper bullish RSI while a project is trading at bottom prices is another classic bullish strong reversal signal. It is present here.
These together, with marketwide action, what the rest of the market is doing, is more than enough for me to say: Manta is going up.
Thank you for reading.
Namaste.
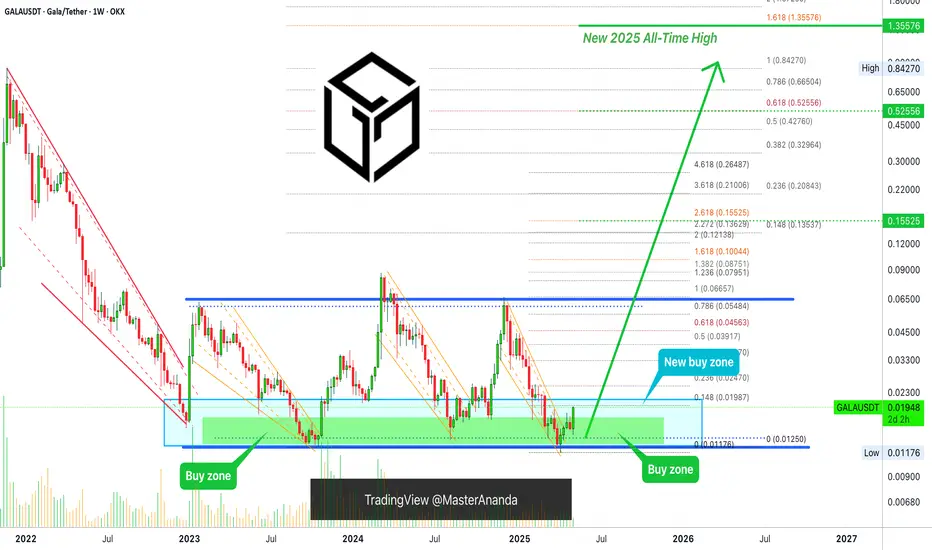
Gala Games Update: Looking—Still Bottom Prices—Good!Gala Games, we looked at it recently, just a month ago. Nothing changes but one small detail, there is a strong bullish breakout from the buy zone.
This weekly candle is full green. GALAUSDT lasted a total of four weeks in the buy zone after the All-Time Low. Leading to the ATL, four more weeks the action happened around this level. So total is 8 weeks, minimum for you to buy at bottom prices. With the action we are seeing now, these prices are now gone forever, but there is good news. It is still early.
The chart is very clear. Actually, we can change/extend the buy zone to include current prices. For example, the buy zone we identified a month ago was the green box on the chart. Now, I drew a new box, blue, and this can be our new buy zone. Since it is still early and Gala Games has so much potential for growth, it is easy to buy now focusing on the long-term, you can't go wrong.
The chart is very clear, Gala Games is trading still at bottom prices with a young bullish breakout. Growth is expected for months if not years. On a broader picture, we are set for an entire decade of financial prosperity and growth. Not only Crypto of course, everything related to finance. But, this does not change the fact that there will still be bear markets and strong corrections, it is only that the bullish cycles will be uncharacteristically strong while the bearish cycles will be weak and short. This is based on hundreds of years of data and a combination of so much... So much that I don't have the space nor time to share it all here.
It is only necessary to say, that GALAUSDT is still early for those looking to profit from a massive bullish wave. Literally, All-Time Low. Once we hit bottom, there is no other place left to go but up.
Prepare to be amazed as the Cryptocurrency market takes over the world.
Namaste.
Travala Goes Bullish, The Wait Is Over —1,150% Profits PotentialHere it is, this is the same chart I shared back in early March this year. Notice the green line and the buy zone. It has been only two months and this zone was activated and the action is now moving back above it; this is ultra-bullish.
In the 8-March 2025 publication I mentioned that we should be ready to wait 6-8 months to see massive growth, and it is true; but, at the same time I was preparing you for the long-term. Bullish action will start now and very strong growth will happen within weeks or days.
If you are prepared to wait 8 months, you will be happy when your money start growing in a period of just 3-4 months. On the other hand, if you are prepared to wait 1 month, you will become anxious and furious and might even sell if the bullish action doesn't start after three months.
So I say, "think long-term."
Prepare to wait years but the truth is that the market will pay sooner, we just need to be patient and prepared.
» This is a strong chart setup and an easy trade; buy and hold.
Travala is ready to move now vs USDT (tether) as well as vs Bitcoin (BTC), it will be massive. You can now buy and hold and enjoy the profits as they come.
This is a friendly reminder.
Thanks a lot for your continued support.
(The targets can be seen on the chart —long-term, the final target will go higher than 1,150%.)
Namaste.
