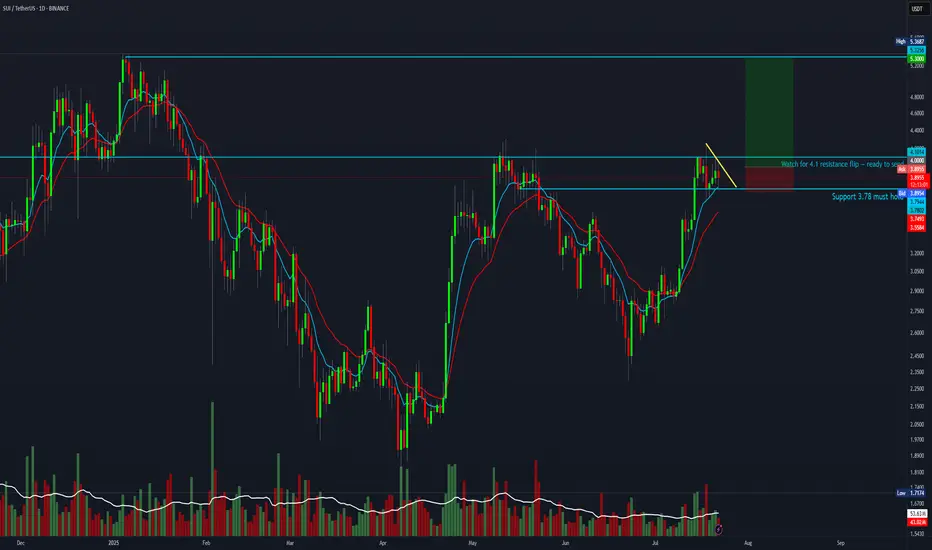
6:1 R:R trade setup for SUIAnother attempt at a 6:1 R:R setup with a target at the all-time high of 5.3.
Entry: 3.9417
Stop Loss: 3.745
Target: 5.3
Altcoins
The End of the Altcoins Bull Market? BTC.D Turns Bullish?Bitcoin Dominance produced a bullish trend that was more than 1,000 days long. While this was a major development, the action never happened just straight up. There were always fluctuations.
Bitcoin Dominance broke out of a major rising wedge pattern. A pattern that lasted years in the making.
Recently, Bitcoin Dominance produced the highest bearish volume since 2021. A strong chart signal.
The major breakdown following the multiple years long uptrend signals the start of a change of trend. A downtrend. This downtrend is extremely bullish for the altcoins market because BTC.D only goes down when the altcoins are going up and doing so faster than Bitcoin.
What we are seeing now is an inverted correction, a pullback. Simply put, BTC.D already made a strong drop and it needs some relief. This relief is not the end. Bitcoin Dominance can move just a little higher to later resume its newly developing downtrend. Which means that the altcoins market bull market has not reached its end, it is only getting started.
Thank you for reading.
Namaste.

Now We WaitTrading Fam,
In my last video, I mentioned how I had been learning to trade more patiently, giving myself those high-quality, high-probability winning trades. This is a perfect time to illustrate that strategy.
With our altcoin market overheated, I am expecting more rest, accumulation, and pullback in many of our alts. The selection of even decent entries is very slim. It's time for us to sit back, wait, and let the trades come to us again.
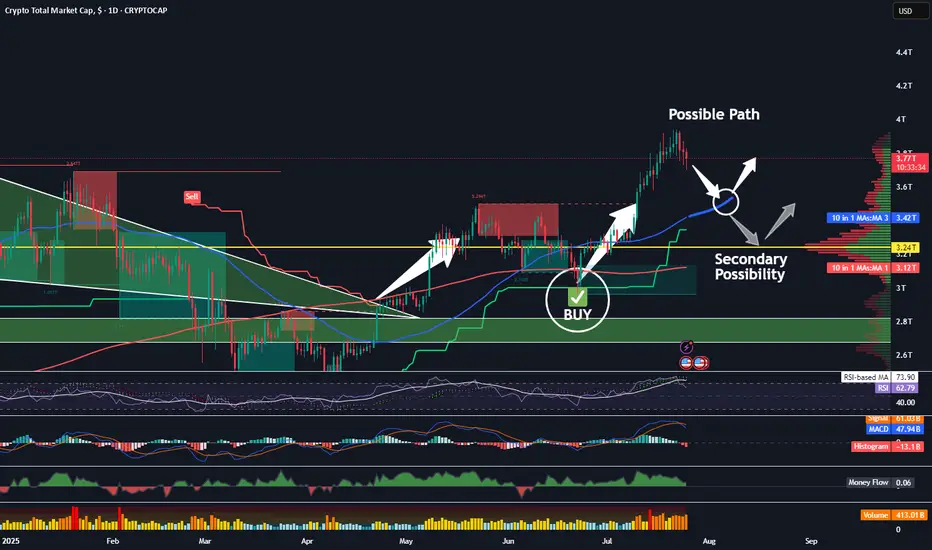
The TOTAL chart shows us more clearly what may occur. Let's discuss a few important indicators on this chart.
First of all, we see my indicator popped a BUY signal right around 3T. We had a safe bet at that point; we were going to see quite a bit of buying action in the altcoin space. Indeed, we did. The altcoin market increased by about 25 percent and went all the way to 4T, at which point the sellers came back in. Now, we are in the middle of a little bit of a pullback, and I think there could be more to come. I am expecting at least a touch of that rising 50-day SMA, currently at 3.4T.
Supporting my thesis here are the crossover of the RSI to the downside of its 14-day MA, the MACD cross, the Chalkin money flow decrease, and the HMV indicating high volume during these sell-offs. Leverage is being liquidated. This is healthy!
It is possible that the total market cap could drop even further, all the way down to that 3.24T PoC on the VRVP. That is where we see most of our volume in alts has occurred. Keep these two targets in mind. Once hit, I will begin looking for more trade entries once again.
✌️Stew
SYRUPUSDT 4H Chart Analysis | Trendline Breakout & Next MovesSYRUPUSDT 4H Chart Analysis | Trendline Breakout & Next Moves
🔍 Let’s break down the latest action on the SYRUP/USDT 4H chart and pinpoint what comes next as trend and momentum cues line up for traders.
⏳ 4-Hour Overview
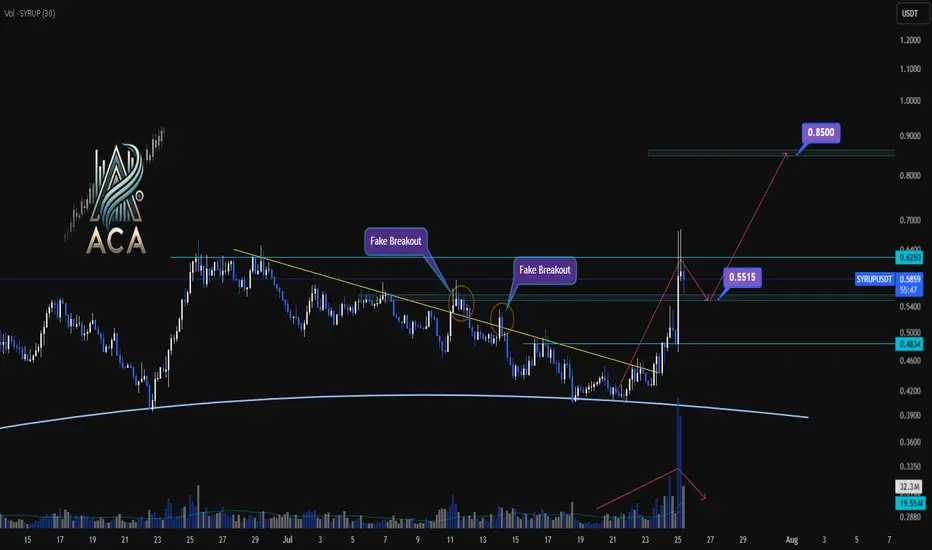
- The recent breakout above the key trendline was backed by a surge in volume, providing clear momentum confirmation and pushing price toward resistance.
- Price has already reached 1.5R of the initial breakout target, a strong sign the trend is in motion.
- Upon touching the $0.6250 resistance, momentum cooled, with volatility decreasing — a classic consolidation phase after a high-energy move.
🔻 Correction & Structure
- With volume subsiding and momentum slowing post-$0.6250, we’re now expecting a corrective move down toward $0.5515.
- This retracement zone will be critical to watch for higher low formation – a bullish structural signal if supported by volume confirmation.
🔺 Long Setup:
- Should SYRUP reclaim and break above $0.6250 after setting a higher low at $0.5515, and with renewed volume, we could see another strong leg higher.
- The next major resistance sits around $0.85 — this aligns as a logical upside target based on the range extension.
📊 Key Highlights:
- Trendline breakout with sharp volume spike = momentum confirmation.
- 1.5R reached before first deep pullback; structure remains bullish above $0.5515.
- Watch for a higher low and subsequent break of $0.6250 with volume to confirm the next move to $0.85.
🚨 Conclusion:
SYRUP’s chart is at a pivotal juncture: a constructive pullback to $0.5515 could set up the next wave higher if supported by volume. A confirmed breakout above $0.6250 targets $0.85 — stay patient and wait for volume signals at key levels.
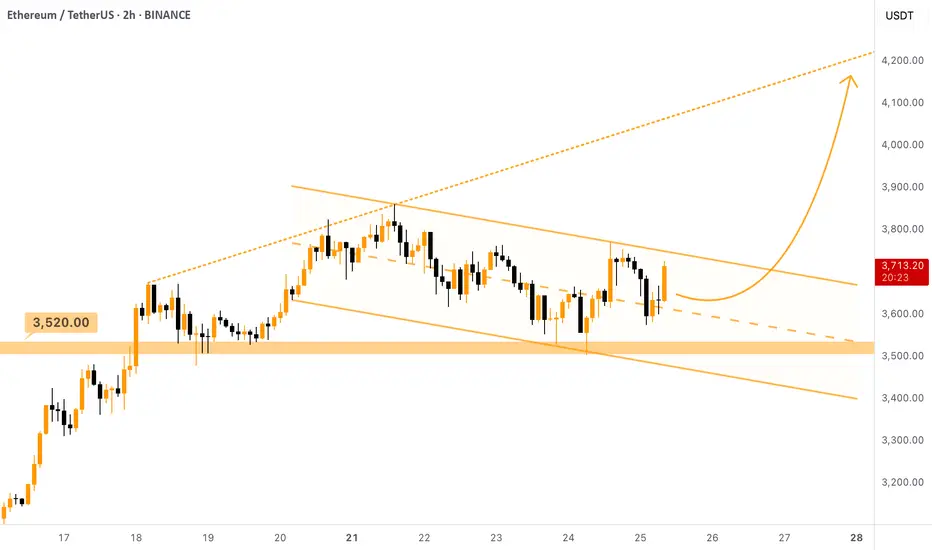
$ETH - Taking Lead Over $BTC (again)Ethereum is strong as ever here. Despite Bitcoin dumped due to the FUD of Galaxy Digital selling CRYPTOCAP:BTC worth of $3.5B, Ethereum managed not stay above the support and even umped!
It is currently forming a Descending Channel (bullish pattern) above the $3520 support level. Local setup. Once this channel is broken upwards, we can expect the price to move towards the ascending resistance that was set a week ago, target is $4100 - $4200 .
You can either enter a trade here or wait for the breakout of the descending channel, the second option is safer.
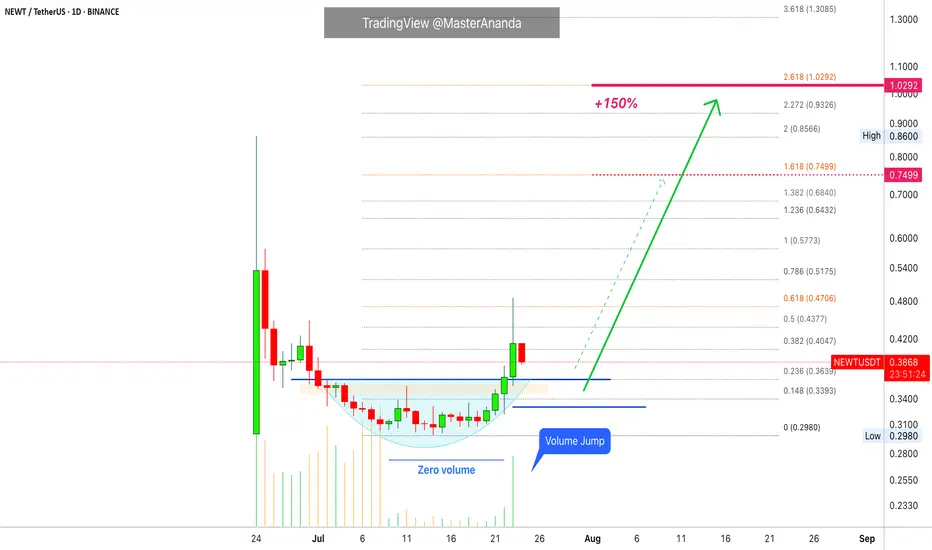
Newton Protocol · Volume Signal · 150% PP Short-TermI will show you now a successful choice on a volume signal as we look at Newton Protocol (NEWTUSDT) on the daily timeframe.
Notice how trading volume is flat while NEWTUSDT is producing a rounded bottom with the daily candles. It reads "zero volume" on the chart.
Now notice the strong "volume jump" today, 23-July, as soon as the action moves outside the rounded bottom, also a Fib. extension resistance. The strong jump confirms the start of a bullish advance. Our short-term target gives us 150% profits potential.
I will end this series soon and go back to our usual schedule.
These charts show the altcoins market being full of opportunities at this point in time. There is something for all types of market participants, active or passive traders. Risk lovers or risk averse. We are only getting started.
Your support is appreciated and all feedback is welcome.
Do you enjoy short-term trades?
Did you know, you can hold these pairs long-term once the bullish trend develops. Selling for profits is only optional, the market is set to grow until late 2025 or maybe into Q1 2026 or beyond.
The things that are happening worldwide in relation to Crypto are a first in the history of humanity. It is the first time that money is free from a tiny controlling monopoly. It is the first time in our history that you can create your own money. Decentralized finance. No middle men. The greatest financial and technological development in our history.
Namaste.
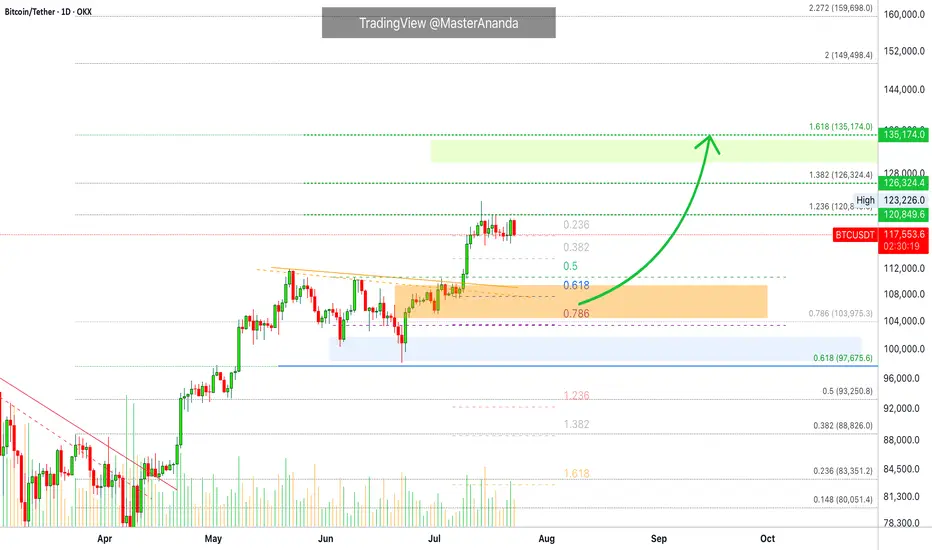
What's The Lowest Bitcoin Can Go? (Top Altcoins Choice —Comment)Bitcoin just hit a new all-time high recently and is consolidating just below resistance. I have a question: How far down can Bitcoin go on a sudden retrace?
That's a great question. Assuming that Bitcoin will continue growing mid-term and long-term, we can expect some more consolidation before higher prices. A retrace is not mandatory but is possible. A correction is almost impossible; low probability; not likely.
The worst case scenario Bitcoin does go down and the action should stop right at the previous high. Resistance turned support. That is, $112,000 to $110,000 would the first and main support range. Harder for Bitcoin to move much lower but these levels are not active yet.
If Bitcoin were to produce an extreme shakeout before additional growth, I would say the worst possible would be a touch of $104,000, but this is still a low probability setup. The chances are that Bitcoin will continue sideways while the altcoins grow. The fact that the altcoins are bullish means that Bitcoin will resume growing in due time. The next major move is another advance exceeding $130,000. It can happen within weeks or next month.
Patience is key on Bitcoin, the altcoins need to catch up.
Sometimes, Bitcoin can go sideways for months wile the altcoins grow. Prepare to wait or switch yourself to some mid-sized and small-cap altcoins. The big pairs tend to move like Bitcoin. Each chart needs to be considered individually.
Thanks a lot for your support.
Feel free to leave a comment with your favorite altcoin for an update. I will do an analysis for you in the comments section below.
Namaste.
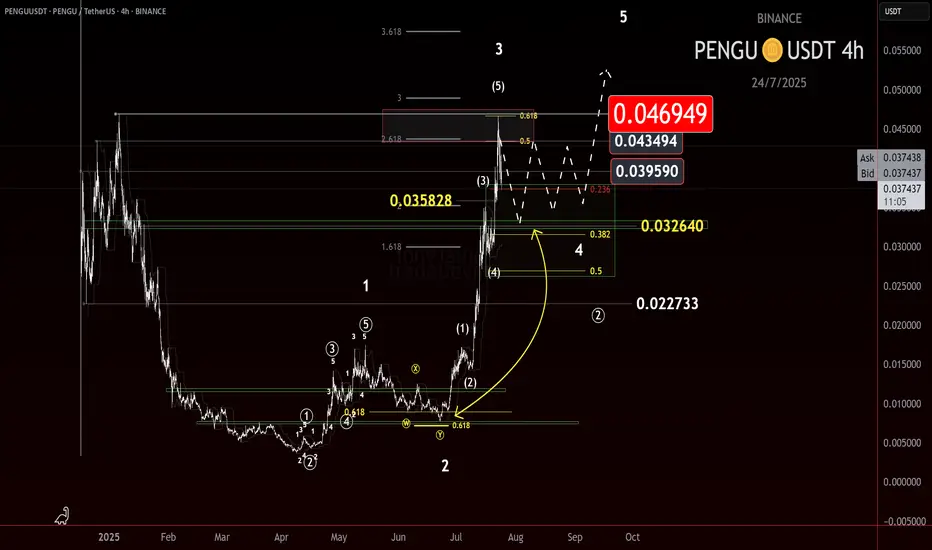
Is $PENGU Cooling Off?CSECY:PENGU continues to deliver, respecting structure and printing some clean price action. After breaking out of consolidation beneath the LOI at 0.032, price extended sharply, reaching as high as 0.0469—where we just saw a firm rejection, previously identified in the last update.
That level wasn’t random. It aligned with a Most Likely Target (MLT) for a wave 5 at a lesser degree and a wave 3 at a higher degree. That kind of confluence usually draws in some heat—and it did.
So what now?
The conservative bull outlook is that we may be entering a wave 4. How this pullback unfolds could tell us a lot. The last retrace was shallow, and if this one digs a bit deeper or breaks certain levels with pattern clarity, that might signal a higher degree wave 4 is underway. The key level here is the 0.0325 level we were watching before.
The raging bull scenario is that we’re still in a lesser degree impulse up. A hold and bounce off the key level could be enough to continue the move higher. But I’m watching the conservative outlook here until we get more print.
Here’s what I’m watching:
• Wave 4 Behavior
Is this a pause or a pivot? The next leg depends on how corrective this gets.
• 0.027
A break here would raise eyebrows. That’s a deeper level of interest and could hint at something more than a minor pullback.
• Pattern Depth & Structure
Each retrace tells a story. More complex wave 4s tend to show themselves through drawn-out corrections or deeper fib targets.
I’m still holding partial from the original 0.012 entry, having taken some profit on the way up. If we get a clean W4 print, I’ll be scouting for the next add.
Trade what’s printed. Stay flexible. Let the wave show its hand.
Trade Safe.
Trade Clarity.
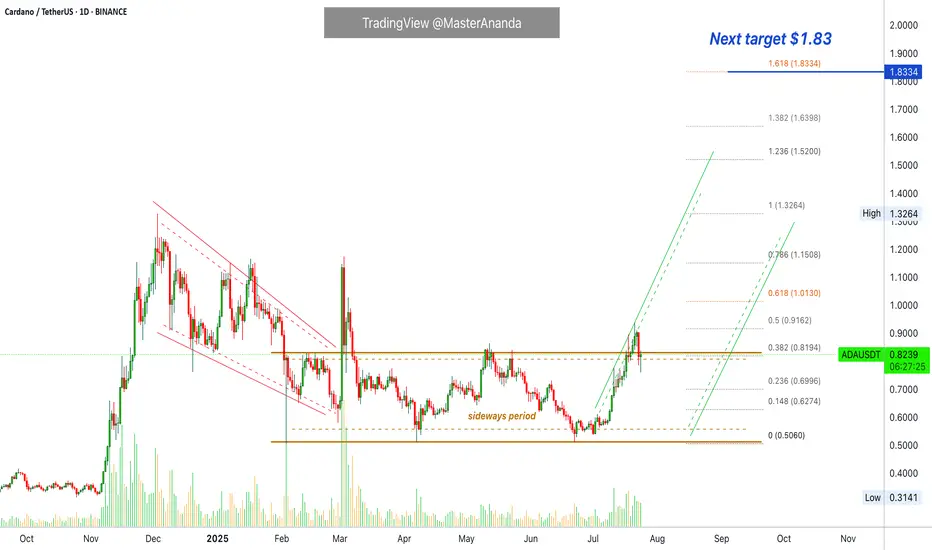
Cardano Has Plenty of Room To Grow · Will Hit Beyond $4 EasilyCardano's all-time high is $3.10. Cardano is currently trading at $0.82. Pause. You will be a genius when ADA is trading at $4 if you decide to buy below $1. It is not too late. This is only the start.
Good afternoon my fellow Cryptocurrency trader, how are you feeling in this wonderful day?
The first major advance for Cardano after the last bull market happened November 2024 and peaked December; we are still getting out of the consolidation that followed the correction of this bullish wave.
Only now Cardano is breaking a sideways channel and still trades below its December 2024 peak. Bitcoin is trading at a new all-time high and is preparing for a major move above $130,000. XRP is trading at a new all-time high and is not dropping. Ethereum is very close to a new all-time high and will certainly continue to grow, only days away. Cardano still has to break its March 2025 high, its December 2024 high; this is not bad, it only means that is still early for this amazing pair.
A bullish advance started 8-July and lasted only 13 days. We are seeing a small retrace now, three days with only one day red. Cardano will recover and continue growing. This growth will not be exhausted in a matter of weeks, it will go for months. Cardano has to grow straight up, daily, weekly, for a prolonged period of time to move beyond $4. But $4 is not the top, $7 and $8 are also possible.
The reason why the action might seen slow, is because this is only the start. Give it time, the market is giving us an opportunity to join. The market is giving everybody the opportunity to buy Cardano while prices are still low. You know how Crypto operates. When it starts moving, it goes so strong and so fast that there is no time to react. Act now and you will reap the reward.
The bullish cycle is confirmed. Just look around, what do you see?
Our sisters and cousins are rising. Our young children are growing; Crypto is going up.
Cardano is one of the main projects in this market and it will not stay behind. You will not be disappointed, you will be happy with the results.
Namaste.
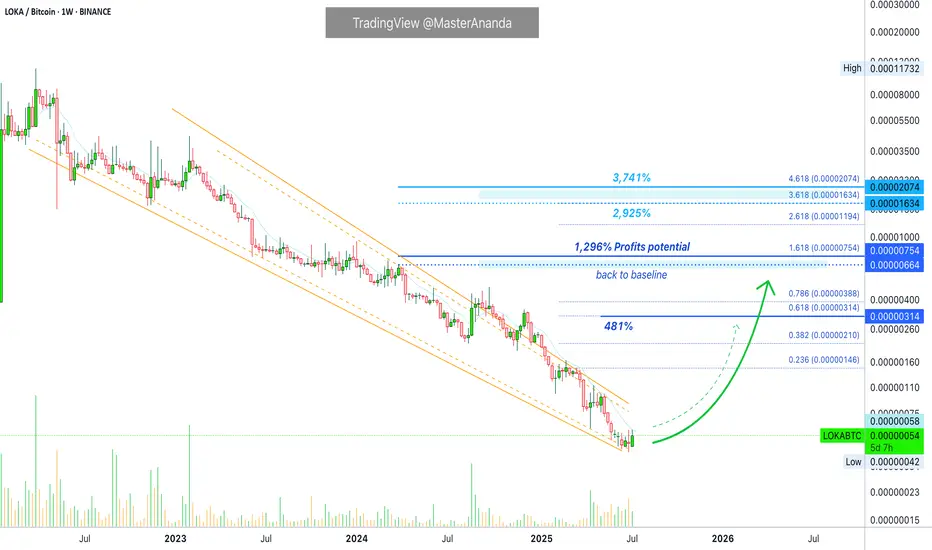
League of Kingdoms · Back to Baseline 1,300% Profits TargetLeague of Kingdoms has been dropping since March 2022 vs Bitcoin, LOKABTC. A more than 3 years strong downtrend. The chart is telling me that this downtrend is coming to an end. We have a volume signal, together with price and marketwide action.
Growth potential is huge, it goes beyond 3,700%. For this chart setup, we are going to be focusing only on the "baseline." That is, 1,296% profits potential. This is an easy target.
To get a better picture of this chart you can always disable the log. scale and you will get a better view of reality. LOKABTC is trading at true bottom prices. Once the bottom is in, a reversal can happen any day. The reversal can lead to long-term growth. It will be the first bull market for this pair.
We do not use leverage on this type of setup, very low risk. The strategy is simply to buy and hold. Accumulate long-term as much as you can and want.
Make sure to do your own planning before trading. Market conditions can always change.
Thank you for reading.
Namaste.
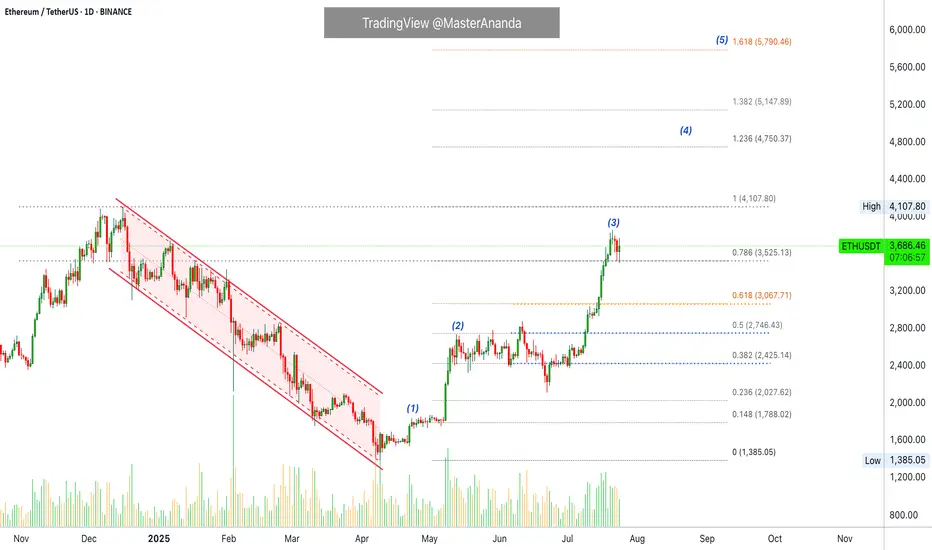
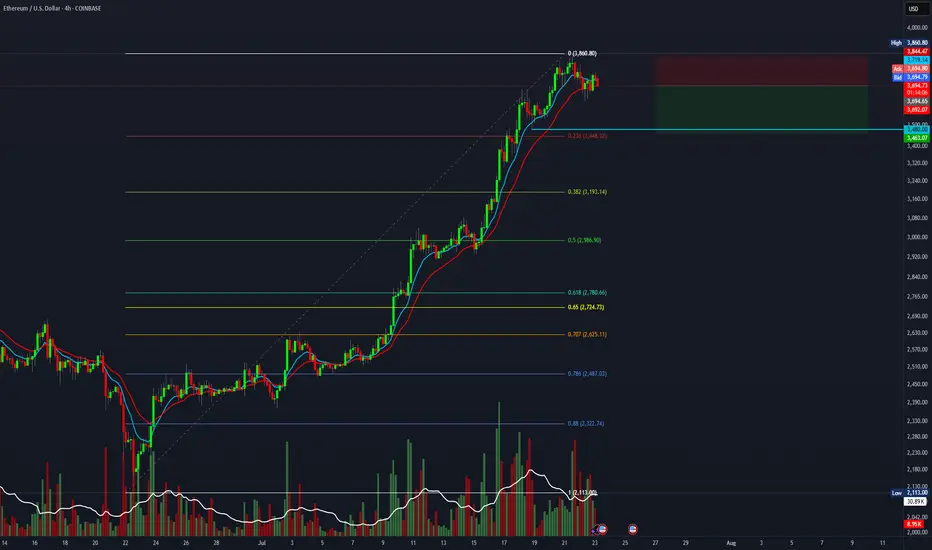
Why Ethereum Will Continue Growing · Trading Above ResistanceEthereum started its latest bullish on the 9th of April. Each advance has been preceded by a period of consolidation.
ETHUSDT (Ether) recovered from its bottom range 23-April, immediately it went sideways for 14 days before moving forward (1). As soon as Ethereum reached $2,700, we have the same pattern but extended, more sideways before moving forward. See this as (2) on the chart. This time the consolidation period lasted 57 days.
The last advance was even stronger (3), Ethereum peaked at $3,860 and we can expect another sideways period, a pause, repeating the same pattern as before. Now, there is an interesting part. The first is a prediction: This consolidation period wont be as long as the second one. The second is related to resistance and support. Notice how ETHUSDT peaked above 0.786 Fib. and this level is being tested as support. The fact that bullish action managed to conquer this level and stop above it, not below, favors the bulls. This means that the market is strong and set to continue growing. There is no significant bearish volume on the red days and the action is neutral so we can expect an advance; the next high will be a new all-time high. We will name it (4) on the chart.
This price pattern should repeat giving us additional growth. After a new all-time high, there will be resistance shy of 6K. And then we expect higher prices with Ethereum peaking around $8,500. Depending on how this level is handled, we can look for $10,000 or even $11,000.
Right now the chart is bullish and points higher.
Continue to hold long-term. It is still too early to fold; it is too early to sell. We are going higher.
Thank you for reading.
Namaste.
5/Altseason Live Psychology:My Core Principle,Learned Over Years
This experience is built on analyzing every previous altseason. And here is the main takeaway: altseasons are always short, but incredibly rapid. In this chaos, most people, driven by emotion, make the same mistakes:
- They open too many trades.
-They close a position on the first small move, hoping to "re-enter" another project that's "about to explode."
-They shift capital from a growing asset to one that hasn't moved yet. And it still doesn't move.
The problem is the mindset. You don't invest in what's falling or bet on "dark horses." You invest in what is already growing.
This might sound new to some, but the most important principle in trading, and in life, is to REINFORCE STRENGTH.
This is an attention market. And attention is captured by the speed and power of growth. Everyone is looking at what's pumping. That's where the money flows. Your job is to be in that flow, not to try and catch a falling knife.
And one more thing, the most critical rule for the next two months. I AM BEGGING YOU, DO NOT OPEN SHORT POSITIONS. Any 15-25% correction on a strong project is not a reason to short; it is your buying opportunity. Measure from the peak, and you will see these entry points. The strongest projects will correct even less. This system works.
Of course, this doesn't mean blindly buying everything that's green. You need to understand the narratives. But if your project is old and showing weakness while others are flying, maybe it's time to switch to a leader. As a subscriber wrote in the comments of my last post: in the previous cycle, SUI did a 10x, while APTOS did a 4x. This clearly shows where the market's attention was focused, and consequently, where the results were.
Best regards EXCAVO

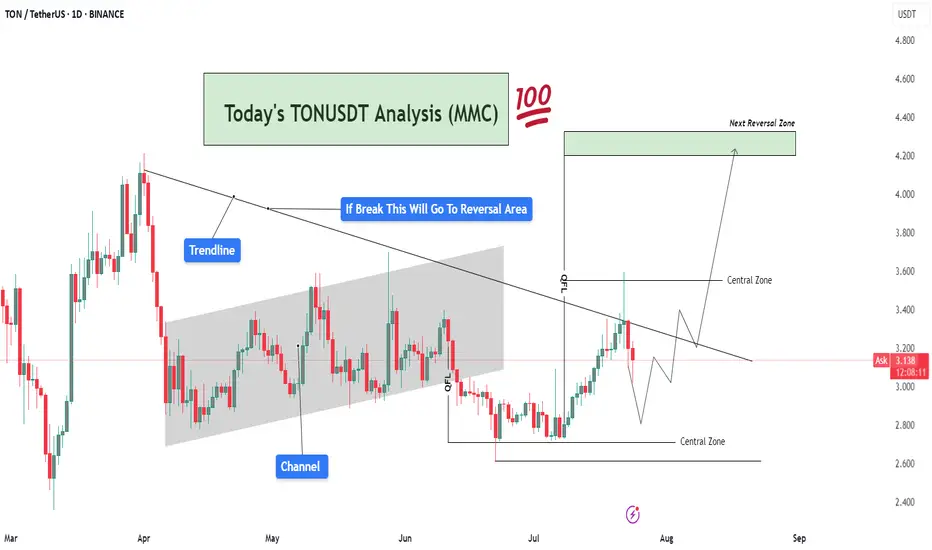
TONUSDT Analysis – Trendline Breakout Target To Reversal Area🧠 Market Sentiment & Context:
TONUSDT (Toncoin vs USDT) is currently trading at $3.13, showing signs of compression within a well-defined MMC structure. After forming a clear QFL (Quick Flip Level) base, the market is approaching a decisive breakout level, with a strong rejection or breakout likely in the coming days.
This chart displays confluence from trendlines, channel breaks, central zones, and QFL demand zones, providing multiple layers of structure-based decision-making. Here's a deeper dive 👇
🔍 Technical Breakdown – What the Chart Is Telling Us:
🔸 1. Major Trendline Resistance – Bearish Control Zone
The descending trendline drawn from prior highs is acting as dynamic resistance.
Price tested this line recently and faced rejection, showing that sellers are still active.
However, the consolidation below the trendline suggests accumulation, not panic selling — a classic sign of smart money positioning before a breakout.
🔸 2. Previous Channel Structure – Broken & Retested
The price previously moved inside a slightly rising parallel channel, reflecting a slow and steady bullish phase.
The channel has now been broken, but TON quickly reclaimed structure via a strong bullish engulfing candle from the QFL base, hinting that this was a liquidity grab (stop hunt) before the real move.
🔸 3. QFL (Quantity Following Line) – Institutional Demand Zone
The QFL base at around $2.85–$3.00 was created after a swift sell-off followed by immediate bullish response.
This is a high-probability MMC reversal structure, where large buyers typically enter.
Since this QFL held firm, it has created a solid foundation for bullish momentum, provided the trendline is eventually broken.
🧭 What's Happening Now – Price Action Update:
Price is caught between two major Central Zones:
Lower Zone: $2.85 – $3.15 (Support)
Upper Zone: $3.50 – $3.70 (Resistance)
The current movement shows price creating higher lows, indicating bullish pressure building beneath the trendline.
Volume remains low, which means the market is waiting for a catalyst (news or breakout) before a directional push.
📌 Key Reversal Zone Ahead – Eyes on $4.20 to $4.40
If price breaks and closes above the descending trendline and crosses the upper central zone, we can anticipate a strong bullish move toward the Next Reversal Zone marked around $4.20–$4.40.
This zone has historical confluence as:
Previous strong supply zone
Psychological round number
Fibonacci extension alignment
This will likely be the profit-booking area for swing traders and early buyers from the QFL zone.
📈 Trade Scenarios Based on MMC:
✅ Bullish Scenario (High Probability If Breakout)
Price breaks the trendline → Pullback → Retest of $3.50–$3.60 zone
Bullish continuation to $4.20–$4.40 Reversal Zone
Ideal entry on retest after breakout
Stop-loss below $3.00
❌ Bearish Scenario (If Rejected Again)
Rejection from trendline leads to re-test of lower Central Zone
Breakdown of QFL level (~$2.85) would invalidate bullish setup
Potential drop toward $2.60 zone for liquidity sweep
🧠 MMC-Based Observations:
🔹 MMC Element 📍 Explanation
🔺 Trendline Key resistance from macro downtrend
🟩 Central Zones Neutral battleground for buyers/sellers
🔻 Channel Break Confirmed bearish momentum earlier, now tested
✅ QFL Strong base, showing early smart money entries
🎯 Reversal Zone High-risk area, expect volatility and profit-taking
📌 Strategic Summary:
Bias: Bullish (as long as price holds above $3.00)
Confirmation Needed: Daily candle close above trendline & $3.50 zone
Target 1: $3.85
Target 2: $4.20–$4.40 (main reversal)
Invalidation: Close below $2.85 (QFL loss)
🚨 Final Thoughts:
TONUSDT is showing clear smart money footprints via the QFL formation and trendline pressure. The setup is ideal for MMC-based breakout traders waiting for confirmation before entering. Volume spike + trendline break will likely spark the next impulsive rally.
Stay patient, and trade the reaction, not the prediction.
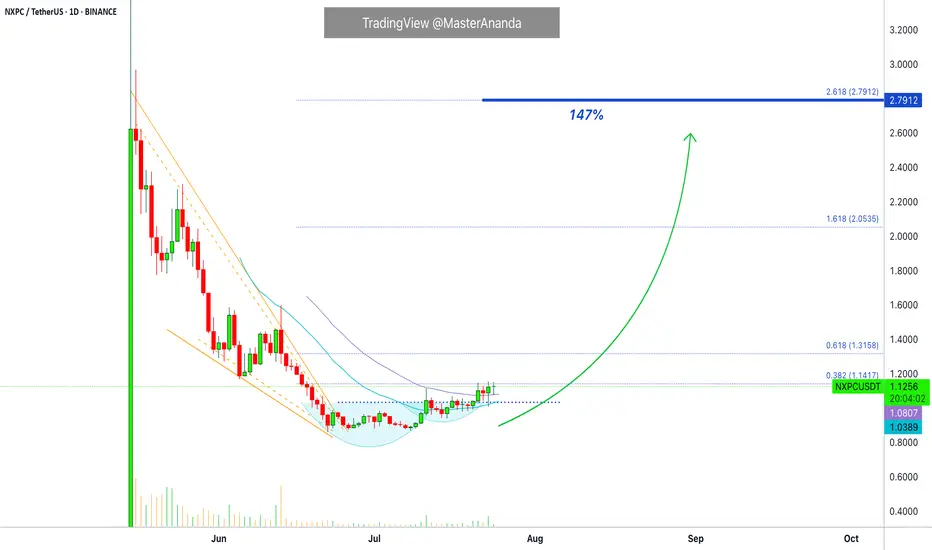
Nexpace Trades At Bottom Prices but Bullish · Easy 147%Here is another trading pair that is trading low and will produce nice growth (profits) in the coming weeks and days. Nexpace (NXPCUSDT).
This one is better than some of the others because it has lower risk. The risk is lower because the action is happening out of the bottom range but prices are still very low. Low prices but with an early bullish bias developing.
NXPC is trading daily above EMA21 and 34 but not EMA55, which means that it is still early. It confirms what I just said above.
Since the entire altcoins market is bullish and rising, Nexpace will also grow. This is an easy short-term trade setup. You can expect to double-up within 15-30 days. Can happen sooner but it can also take a while longer. Be prepared to wait.
Namaste.
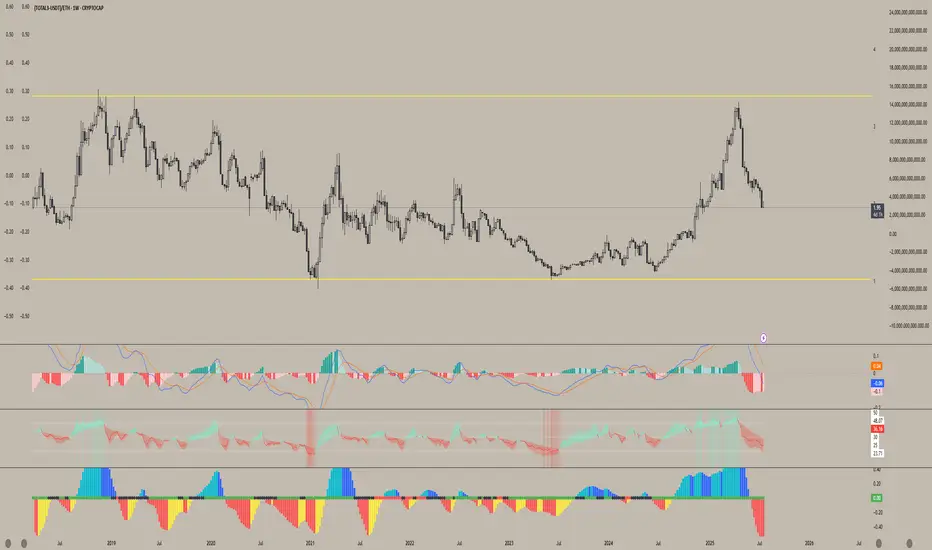
Altcoins are getting absolutely decimated relative to ETHWhile Ethereum has been on a massive run from its lows this year — pulling altcoins up with it — most alts are still lagging far behind.
This chart clearly shows how poorly altcoins are performing against ETH, reinforcing why, at least for now, ETH remains the better hold.
It also fits the classic money flow rotation: BTC → ETH → Large Caps → Small Caps — and right now, we're still in the ETH phase. Until we see strength return in these ETH pairs, chasing altcoins may just lead to more underperformance.
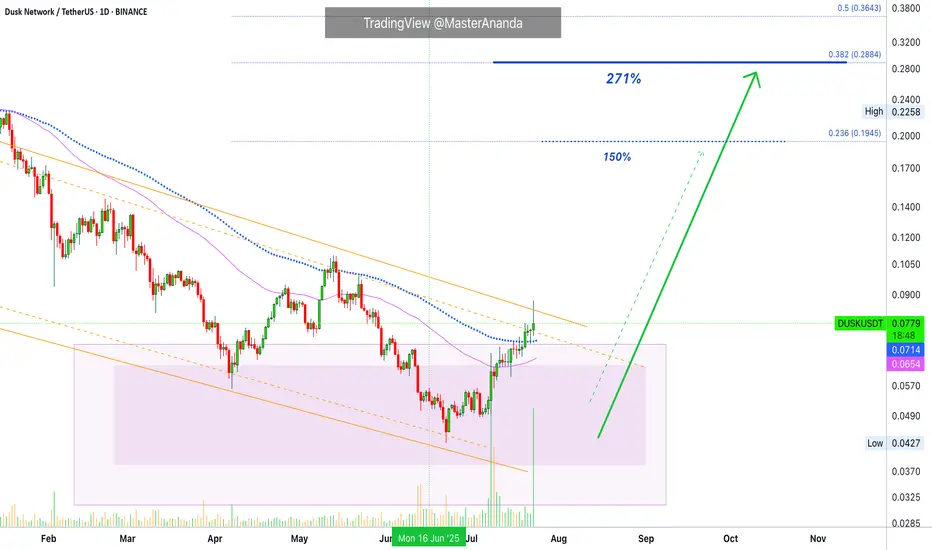
Dusk Network Instant 150% · More Possible · Trading ExplainedThis is a complete setup, I shall explain. Trading long-term vs trading short-term and technical analysis.
We are looking at Dusk Network (DUSKUSDT) on the daily timeframe. You know how I always look for the bottom and trend reversal for all major pairs for long-term trade-numbers; but, when focusing on the short-term you want a fully confirmed setup rather than the perfect bottom. Why?
The perfect bottom can lead to months and months of consolidation before a bullish breakout. A fully confirmed chart setup leads to instant growth.
Here DUSKUSDT has really high volume above EMA89. Full green candles and pushing higher. Already rising, you can see how the bullish bias is only intensifying. This type of setup can produce the much sought after sudden 100% jump. Once this happens, collect profits and move on.
So, long-term, buy and hold. Keep waiting until the cycle top.
Short-term, get in and get out.
Namaste.
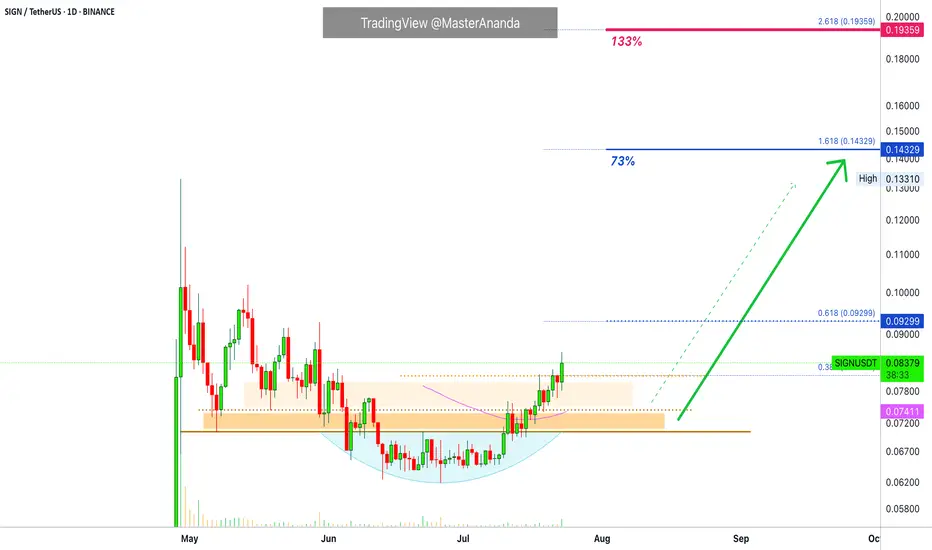
Sign · Same Chart, Same Pattern, Easy Profits · 133% PotentialThe same chart, the same dynamics and the same highly profitable easy to win trading opportunity.
The main low happens 7-May. There are lower prices after this but this is the stop-loss hunt event. We know this based on the rounded bottom pattern.
SIGNUSDT is back above its 7-May low and also trading above EMA55 on a daily basis. Above EMA55 after hitting a major low is as bullish as it gets. On top of that, we can see slow and steady growth; remember, the build-up process that leads to a strong bullish wave.
Notice how each candle, each day, prices are climbing higher and higher. The strongest signal of all is price action. When prices are rising, that is all you need. Supported by a volume breakout and we have another chart setup that will produce profits short-term.
The exchange I am looking at allows up to 5X, but you can do spot; less risk and no stress. If something goes wrong, the worst case scenario is a long wait or a small loss. On the other hand, a mistake with leverage can mean losing your entire position. Which one do you prefer?
There is no right or wrong answer. Higher risk will translate into a higher potential for reward. A lower reward potential translates into less stress and less risk. Whatever you choose is up to you. It all depends on your personality, your capital, your trading style, the available tools and your goals.
I say, start small. If you can secure many small wins, eventually you will be able to handle the big ones. Only go big when you have experience securing the small trades.
If you are in a hurry to win big, then you might end up losing everything; over and over, again and again.
Avoid repeating the same mistakes. Learn from the Master.
Thanks a lot for your continued support.
Namaste.
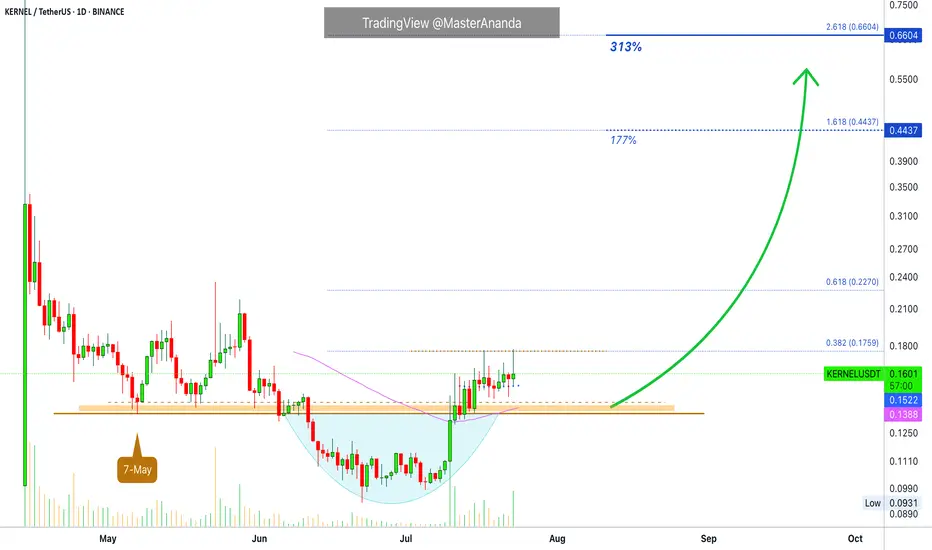
KernelDAO Short-Term Trade Setup · 300% Profits PotentialThis is another strong chart setup. I am looking at the short-term because that is the request I am getting from many of my followers. People are interested now in growing their capital so this can be used to accumulate strong reputable projects later on. Something like double-up, triple-up then grow some more. When enough cash is available; sit back, relax and hold.
The main low here is 7-May. The break below support is the liquidity-hunt event.
After the action recovers above support, bullish confirmed.
Notice KERNELUSDT trading above EMA55 and EMA89 daily.
Trading volume also favors the bullish side. Notice how red days have very low volume. On green days we have the higher numbers of volume spikes. High volume when buying, low volume when selling.
The first target is good and strong for 177%. The second target goes to 300%. This can be achieved easily within 1 month (short-term), or it can extend to two months but not much longer. The trick is to be ready to wait.
If you expect the market to move within hours or days, you might be disappointed. Yes, sometimes it moves fast but this is the exception and not the norm. Better to be prepared to wait a long time and if it moves faster, that's a bonus but we have to be realistic to produce consistent wins. If you want to be in the action, diversification is a good strategy. If you just want to win, patience is key.
Namaste.
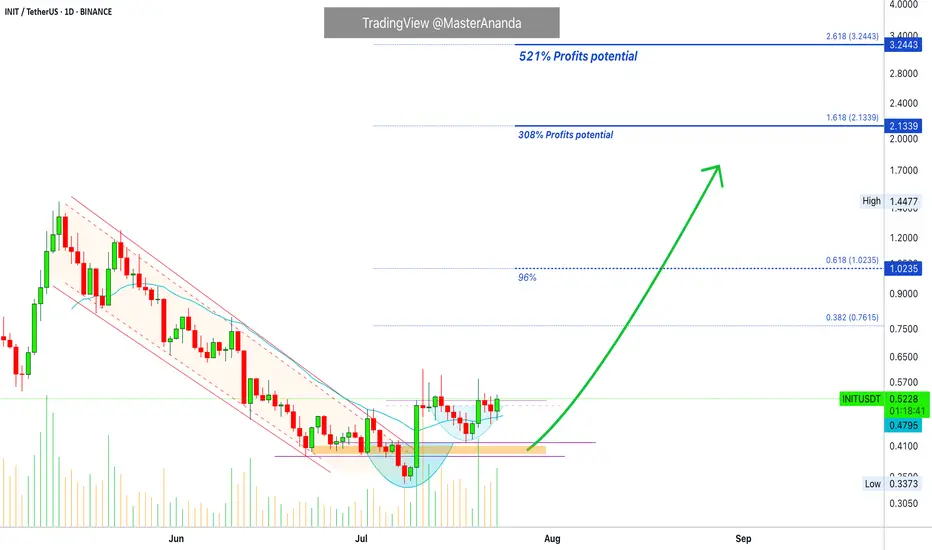
Initia Breaks Downtrend · 300% Profits Potential Chart SetupHere we have a nice chart setup and we are aiming for 144% short-term followed by 300%+ potential profits. Initia—INITUSDT—broke out of a downtrend 10-July with a full green candle and is already trading above EMA21. This is a solid, easy and simple chart setup.
Notice how the new projects continue moving forward while some of the big projects are stalling or retracing. This simply shows that the overall market continues bullish. If the market were to go on a correction, which develops marketwide, everything turns red.
When some pairs remain green in whatever section of the market, it means that money is simply moving from one sector to the next. After just a few hours, the market continues growing. We will see additional growth in the coming days. All is green, all is good, continue to hold strong. This is only the start.
Namaste.
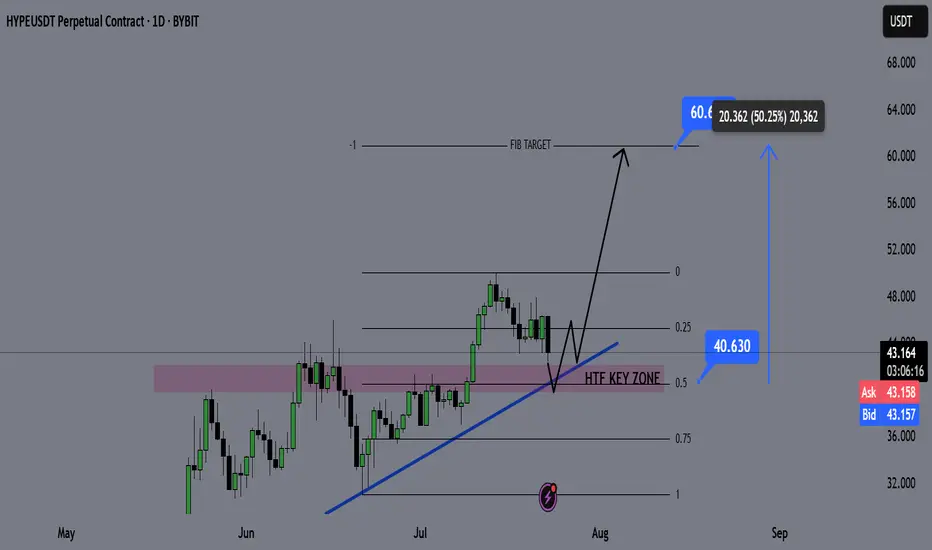
HYPE Swing Long Opportunity - Altcoin Season📌 Fundamental Sentiment:
The crypto market — alongside broader risk assets — continues to gain traction. This momentum is largely fueled by rising expectations of policy shifts in the U.S., with Trump intensifying pressure on Jerome Powell and advocating for aggressive rate cuts from the Fed.
📌 Technical Analysis:
HYPE is approaching a key HTF bullish trendline, and confluences are stacking up in the same region:
✅ HTF Demand Zone
✅ Equilibrium (EQ) of the HTF bullish trend
✅ Bullish Trendline Support
These three HTF confluences overlapping at the same price zone indicate a high-probability setup for a significant bounce and a possible swing long opportunity.
📌 Gameplan:
Price hits HTF bullish trendline
HTF demand zone gets tested
EQ level tapped → discount offered to buyers
📌 LTF Confirmation Criteria:
I’ll wait for:
A 1H swing break
A strong 4H rejection candle
These will confirm momentum shift. If confirmed, I’ll enter a swing long.
🎯 Target: $60
💰 Potential gain: ~+50%
❗ Stop-loss: Below the swing low that triggers the LTF confirmation
—
🔔 Follow for daily setups and weekly macro recaps
💬 Drop your chart or questions below!
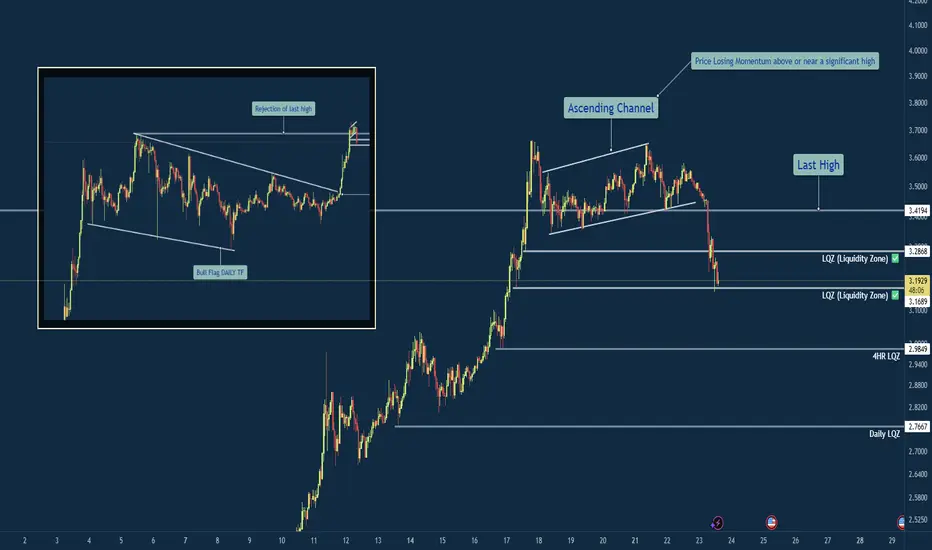
XRP/USD – Bearish Shift After Momentum Exhaustion🧠 Summary:
XRP/USD has shown clear signs of exhaustion after sweeping the previous high. Following a breakout from a daily bull flag, price struggled to hold momentum near the key level of 3.4194, forming an ascending channel that eventually broke down. Liquidity zones below current price are now in focus.
🔍 Technical Breakdown:
✅ Daily Bull Flag → Broke out with strength
⚠️ Rejection near Previous High (3.4194) → No follow-through
🔼 Ascending Channel → Formed post-impulse, now broken
📉 Momentum Shift → Structure flipped bearish
💧 Liquidity Zones (LQZ) below price acting as magnets
📌 Key Levels:
🔹 Last High: 3.4194 (Rejection Point)
🔹 Broken LQZ: 3.2868
🔹 Current Support: 3.1689 (LQZ - being tested)
🔹 Target 1: 2.9849 (4HR Liquidity Zone)
🔹 Target 2: 2.7667 (Daily Liquidity Zone)
🧩 Confluences:
Liquidity sweep of prior high
Momentum loss near key resistance
Break of ascending structure
Retesting broken zones with room below
⚠️ Final Thoughts:
This trade is playing out just as we described in the post before this on XRP. We discussed watching how price would react to this area before making any type of "Late Entries". XRP is still a huge and vital part of the Crypto Eco System so long term i am holding my Long position. The areas on the chart are still great areas to buy in at "Dollar Cost Average". This will be one of those positions that though it may be bearish on the lower time frame you need to zoom out and always keep an eye on the weekly and daily chart before making any drastic moves.
Short swing setup on ETH, targeting 1.5R.It's time for a healthy pullback on ETH. This short setup offers a 1.5:1 risk-to-reward ratio with a target of $3,500.
Entry at $3,725
Stop loss at $3,850
Target at $3,500.
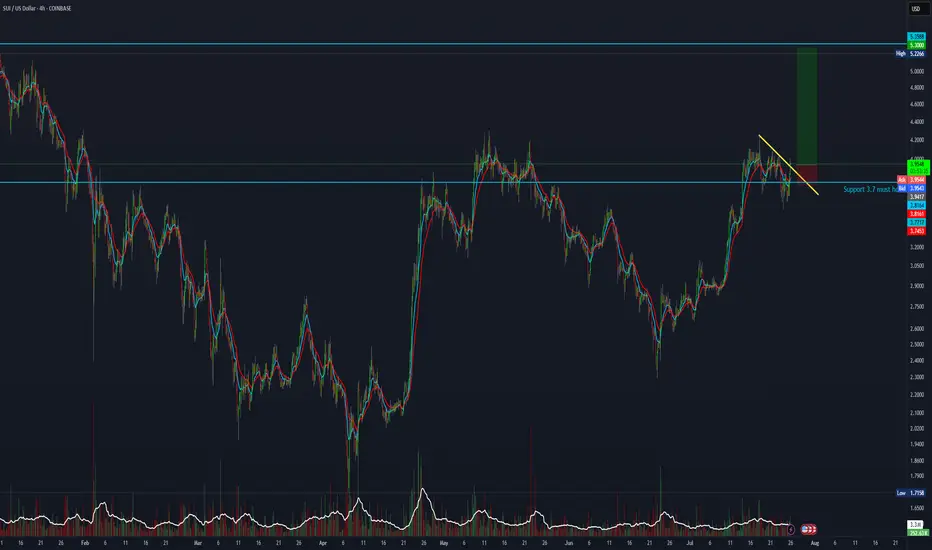
SUI 5R setup forming.SUI looks ready to move. Wait for a breakout above $4 — once it flips the $4.10 resistance, it could fully send toward ATH.
Entry: $4
Stop Loss: $3.70
Target: $5.30