Altcoins
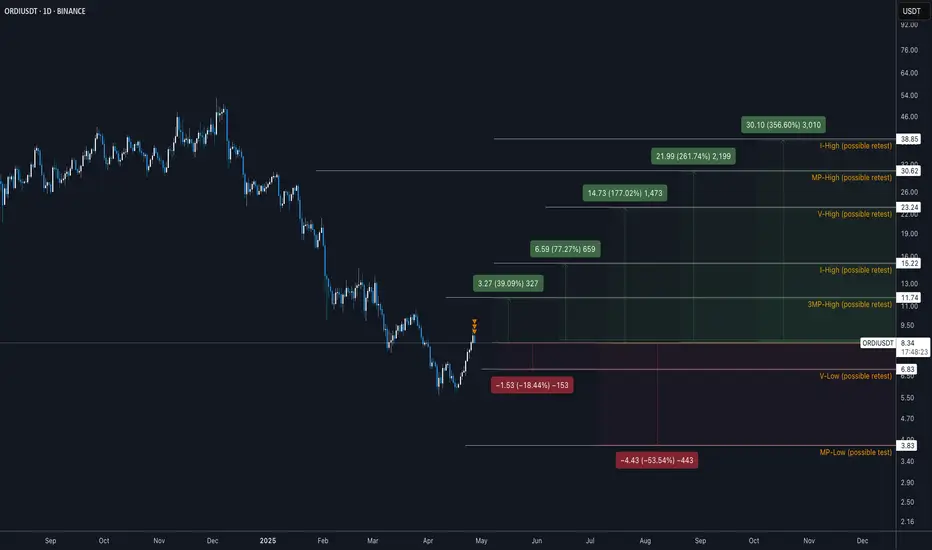
ORDI is printing a classic “dead-cat or genesis‐leg” decisionORDI is printing a classic “dead-cat or genesis‐leg” decision
🕞 60-Second Read
Trend on the 1-D chart is still structurally bearish but price (spot 8.34 USDT) just bounced +55 % off the March capitulation wick.
Hot-Zone #1 – 6.83 (V-Low): last defended demand, 18 % under spot.
Hot-Zone #2 – 11.74 (3 MP-High): first daily breaker sitting 41 % above spot.
Hot-Zone #3 – 23.24 → 30.62 (V-High ↔ MP-High): macro supply shelf where the next big void starts.
🎲 Probability Dashboard
HTF Trend & Market Structure – -2
Liquidity Map (voids above, un-retested pivots) – +1
Momentum (bull div & impulse) – +1
Derivatives Flow (funding near flat) – 0
Net Score = 0
Bear / Neutral / Bull odds ≈ 45 % / 25 % / 30 %
📈Trade Playbook
Strategy 1
1. Layered Limit Grid – Aggressive Counter-Trend Long
Entry layers (size %):
7.05 – 25 % of your allocated ORDIUSDT size
6.20 – 35 %
5.20 – 25 %
4.20 – 15 %
SL = 3.35
TP ladder:
11.74 – 25 % off-load
15.22 – 25 %
20.72 – 30 %
23.24 – 20 %
Weighted R:R ≈ 4.6
---
Strategy 2
2. Layered Limit Grid – Conservative Breakout Long
Trigger: daily close > 12.00, then place grid orders.
Entry layers (size %):
12.10 – 40 %
13.20 – 30 %
15.20 – 20 %
20.80 – 10 %
SL = 10.10
TP ladder:
23.24 – 30 %
30.62 – 30 %
37.65 – 25 %
48.25 – 15 %
Weighted R:R ≈ 4.9
Setup Logic
Price reclaimed minor breaker but sits inside a 72 % upside void to 11.74.
Three un-retested pivot highs (11.74 / 15.22 / 30.62) magnetise rallies.
Yearly BC 37.65 brackets with I-High 38.85 – high-timeframe liquidity pool.
Capitulation low left MP-Low 3.83 as invalidation reference for longs.
Risk Radar
BTC volatility spill-over could nuke thin ORDI order-books.
Macro: U.S. risk‐off headlines keep alt liquidity fragile.
Narrative: inscription / BRC-20 hype cycle cooling – watch volume.
ORDI is printing a classic “dead-cat or genesis‐leg” decision: defend 6.8 and bulls get an air-pocket run to 15 – 23; lose it and 3.8 is next. Trade the grid, not the hopium.
(Not financial advice – manage your own risk.)
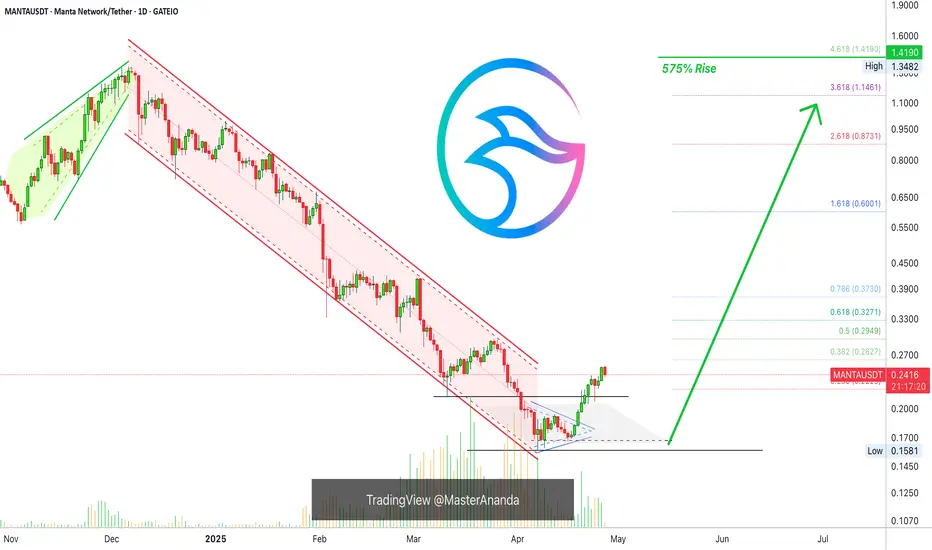
Manta Network Bottom Situation—Trading Tips & Tricks (575% Rise)We have a situation here where the market bottom has been confirmed.
Notice that MANTAUSDT is trading above its 11-March low but below its 3-Feb. low. The pairs that are trading above the 3-Feb. low are stronger from a TA perspective and from a trading perspective and likely a fundamental perspective as well, compared to those trading below.
They are stronger first because the recovery is strong and second because the crash was smaller. In both cases, the rise and the drop, the market showed more support and action on these. This is something to keep in mind when choosing your pairs.
Stronger pairs tend to produce better results.
When retraces and corrections happen, they tend to happen all across. So those stronger will continue to outperform and you better choose those when choosing you Altcoins, with some exceptions of course.
There are thousands of Altcoins and it is hard to choose.
For me, I chose on 7-April when the bottom hit, so all are green, but the world (and trading) doesn't end there. The truth is that bottom prices are great but available only for the short-term.
You can use moving averages as well to know which pairs are better than another and which ones are more likely to move next. The ones trading above the longer EMAs are the ones that are stronger.
Just a few tips and tricks to improve your chances of success.
Thank you for reading.
Namaste.
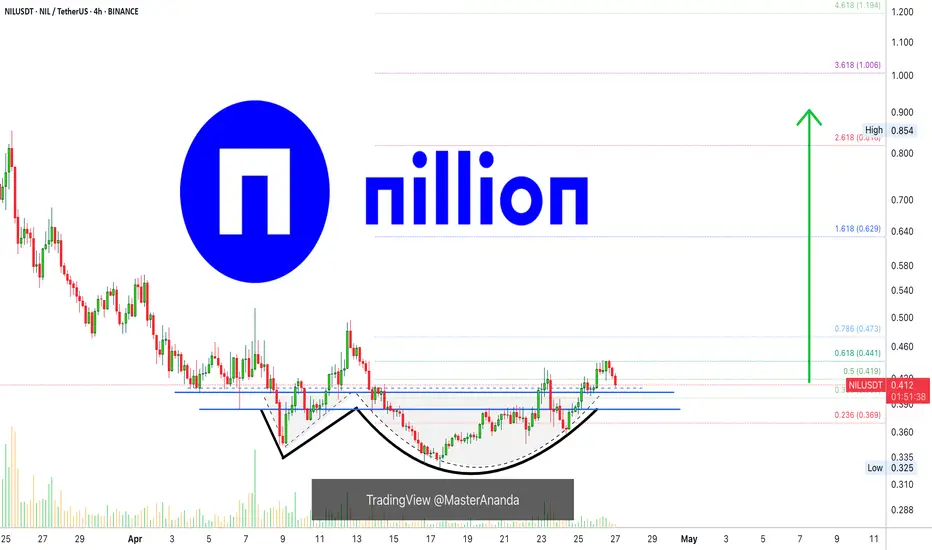
Nillion: Huge Long-Term Potential For GrowthThis one caught my attention and the project seems to be a good one, the concept behind it.
The chart here is very young so I am using a short-term timeframe, 4H.
(I will do a more thorough analysis once more data is available.)
The classic Adam & Eve (A&E) bottom formation is present on the chart.
The action recovered above the 6-April low but it is still early for this pair, which can be good, a good opportunity for buyers. Buyers beyond.
There is still no high volume candles/session but growth has been happening for 10 days. This isn't much but lower prices are better than higher prices. Again, for buyers.
This can turn out into a good project. I see bullish potential for this pair in the weeks ahead, and months.
There is room for growth.
100% bullish above support —blue lines on the chart.
In general, NILUSDT (Nillion) continues bullish as long as it trades weekly and monthly above the All-Time Low. Easy buy and hold.
Decentralizing privacy related data? Sounds great!
Namaste.
Brett: Your Altcoin ChoiceA Solana memecoin, Brett produced a year long higher low with the classic ending diagonal pattern to signal an upcoming trend reversal.
The first low happened in April 2024. The second and higher low this month, this week, 7-April 2025.
The chart dynamics are very simple. Are you wondering, is the timing right? Right for a buy, maybe. Right to hold or, will a reversal happen soon?
The answer is positive to all those questions.
The time is right and is also ripe for a reversal to take place. This is the best possible time right now to buy and hold. The market must be bought when prices are low and red. This is the situation with the chart today. Prices are low and red but ready to turn. All the early signals are in.
BRETTUSDT is showing potential for a strong bullish wave in the coming months. Being new and also trading at bottom prices, growth can go off the chart. I will not be surprised when this pair goes beyond the 1,115% shown on the chart, this target is based on the mid-term.
The first target can reach 415%.
This is an easy chart. This is an easy trade.
I don't like memecoins, but it is not about what I like, it is about what the chart says.
The chart says that this pair is bullish with huge potential for growth. If you like it, feel free to enter with force. The Cryptocurrency market is turning bullish now and this and other pairs are sure to grow.
Thanks a lot for your continued support.
Your timing is great. A good Altcoin Choice.
Namaste.

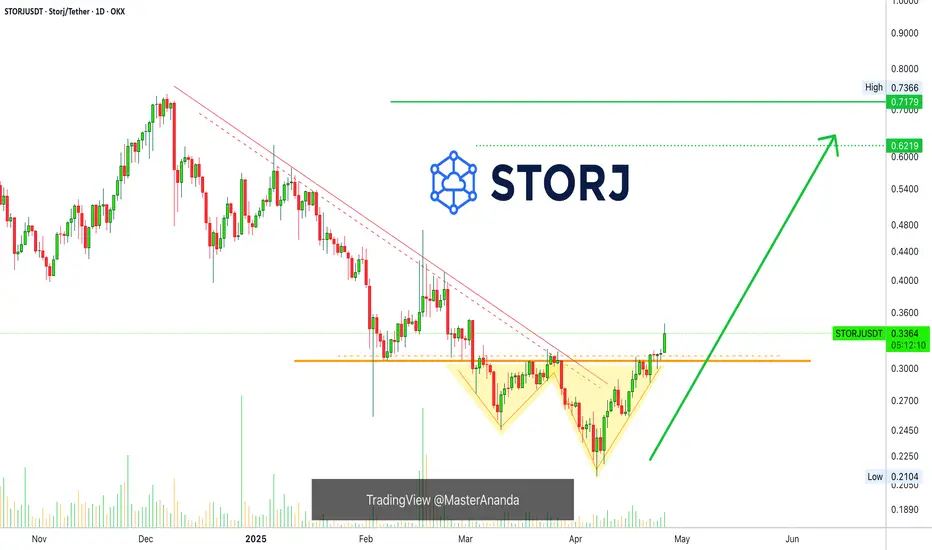
Storj —Strong Move Ahead (Easy 100-200% Profits Potential)The inverted triangles depict the bottom. After Storj moved above the 3-Feb low and broke the downtrend we entered bullish territory.
The chart was bullish when the bottom hit 7-April and we can predict a recovery, but this is only a prediction. When the action moves decisively above support, and growth starts to happen above support, then the bullish bias is fully confirmed. This is exactly what is happening here.
» STORJUSDT is trading above support and is ready to grow. This chart shows the potential for a 100-200% move to develop in the coming days. It can start within days and take only a few weeks to fully develop. This will only be the start.
After this initial strong bullish breakout, we will see growth long-term. Higher highs and higher lows. The 2025 Cryptocurrency—Altcoins bull market.
Thank you for reading.
Namaste.
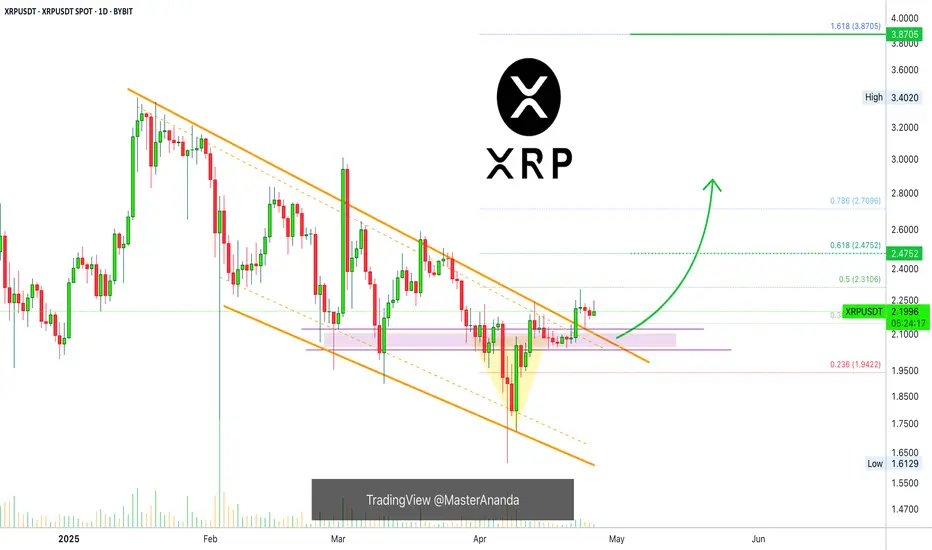
XRP Short-Term —Retrace, Correction Or Bullish Continuation?There is always the possibility of a retrace developing after a major move and this retrace can turn into a correction, it can happen.
When support is confirmed, a bullish continuation is the norm.
Here we have XRPUSDT and my intention is to focus on the short-term. The next move.
The orange trendline worked as resistance until 22-April when it was broken. XRPUSDT now trades above this magic line. The next day, it found resistance at 0.5 Fib. extension and moved down to test this upper-boundary trendline as support and it holds.
This action is happening after a major correction low has been confirmed with zero volume. The zero volume reveals that bears are not present. No new lows reveals the same.
The trendline has just been broken and XRP is moving sideways, consolidating. This consolidation will lead to a bullish continuation. The next move is up.
Additional details on the chart—targets.
Thank you for reading.
Leave a comment then follow.
If you read, it only takes a minute and it will keep you up to date with the Cryptocurrency space. New charts daily and momentum building up, the 2025 bull market is now on. Soon, full force higher prices going up!
Namaste.
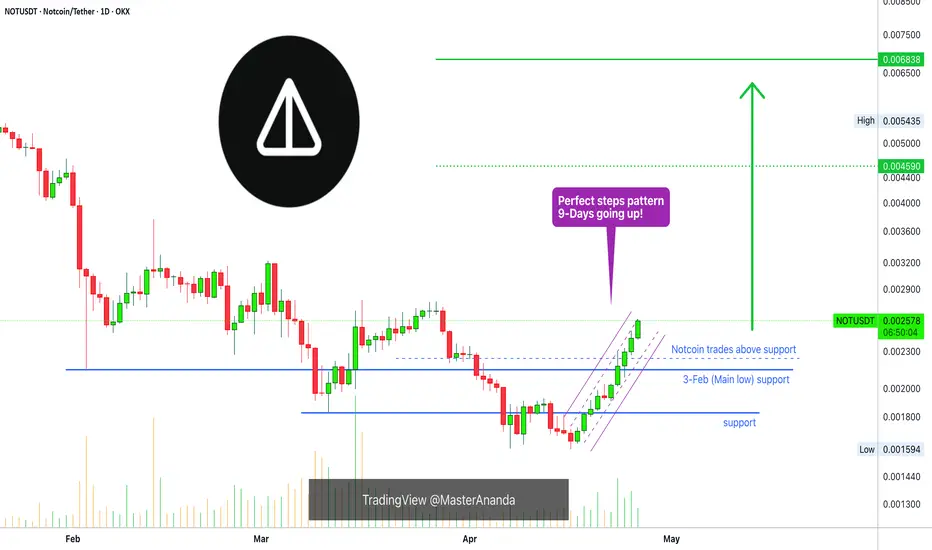
Notcoin's Whales Go Crazy! Full Insiders Game Revealed (Chart...Wow... What are the whales thinking? Are they really going to reveal their hand this easily? Do they think we are stupid?
OMG, what is happening here... Normally the whales are much smarter but here everything is being shown easily to everybody. You don't believe me? I will show you, watch!
» Notcoin has been rising straight up, green after green after green candle being closed. Up, up, up, up with a perfect step pattern. 9 days straight up.
Now, this will result in a massive major bullish jump.
The best news is that this jump will not be the end. After this major advance the market will settle at higher prices just to continue growing long-term. It is still early to take advantage of this strong bullish wave.
» Notcoin is going to grow. Market my words.
It is guaranteed. It is already happening. Bet the house. Go all-in.
Thanks a lot for your continued support.
Namaste.
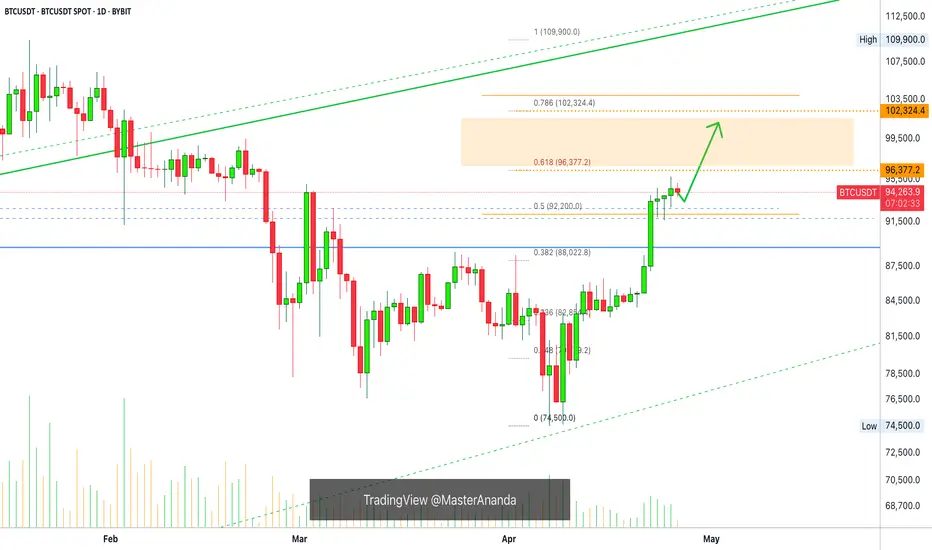
Bitcoin —Short-Term Retrace (Drop) Or Higher Next?Look at this, this is Bitcoin on the daily timeframe. I will keep it short, sweet and easy.
Bitcoin broke up 22-April and has been sideways since with an upward bent. When Bitcoin is set to drop, it drops the next day.
It has been four days and Bitcoin is going up, no retraces. This indicates that the next move will be a big, very big, green candle. No significant drop so far.
A drop would mean prices moving below 90K. Wicks lower or higher are not relevant and consider noise only. Not a drop nor a rise.
The next major move is up. Bitcoin is going up.
The action on the chart reveals higher prices.
The action coming from the Altcoins market reveals a major advance happening in the coming days.
Four days not lower but higher.
The 2-March high, the highest price since the first drop below 90K has been compromised. There was no strong rejection nor selling pressure.
This is a strong resistance level, $95,000. As soon as it gets conquered, Bitcoin will move straight up to $100,000.
Very easy, simple, short and sweet.
Bitcoin is going up. Buy and hold.
Buy and hold. I repeat.
Orange is the target zone. Short-term. Up next.
Namaste.
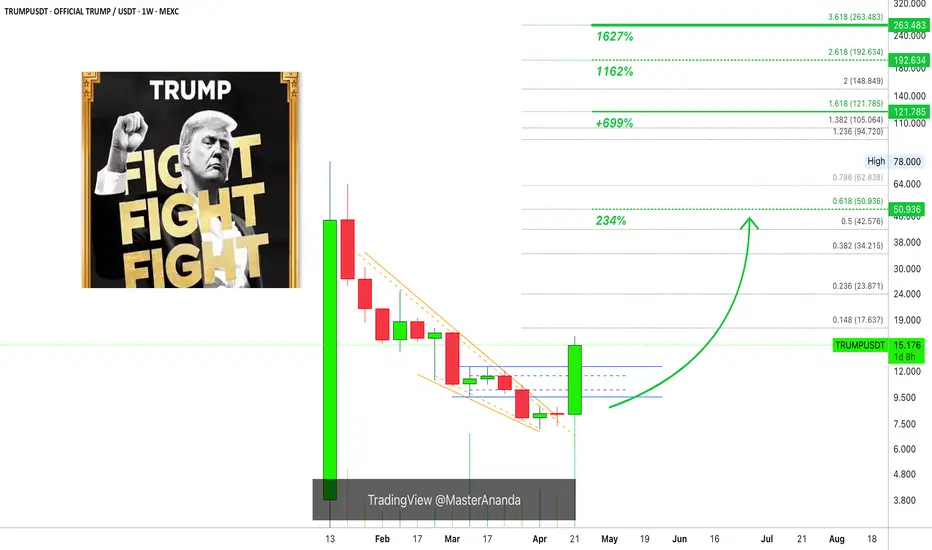
Trump Short & Long-Term With Targets ($263, $192 & $121 —1,627%)This is the long-term chart for TRUMPUSDT (OFFICIAL TRUMP), all bullish signals are strong and 100% confirmed. Higher prices next with a high lever of certainty. An uptrend will develop now, higher highs and higher lows.
The weekly session is full green, current session.
The trading volume on this session is the highest ever. Check.
There is a falling wedge pattern fully broken.
The downtrend has been broken.
There is a rounded bottom pattern (stop-loss hunt event) that work as a reversal signal.
The action is happening back above support, recently a resistance zone. These are the blue lines on the chart.
All these are bullish signals.
Next comes the targets:
1) The first and easy target sits at $24.
2) This one is followed by $34 and $42.5.
3) The main target in the coming weeks is $51.
4) Mid-term, within 3 months, we have $63, $94 and $122.
5) The remaining set of targets will be hit long-term, 6 months or more. These are in the range of a strong new All-Time High, it can be seen on the chart.
Thank you for reading.
Boost for more frequent updates and comment.
Namaste.
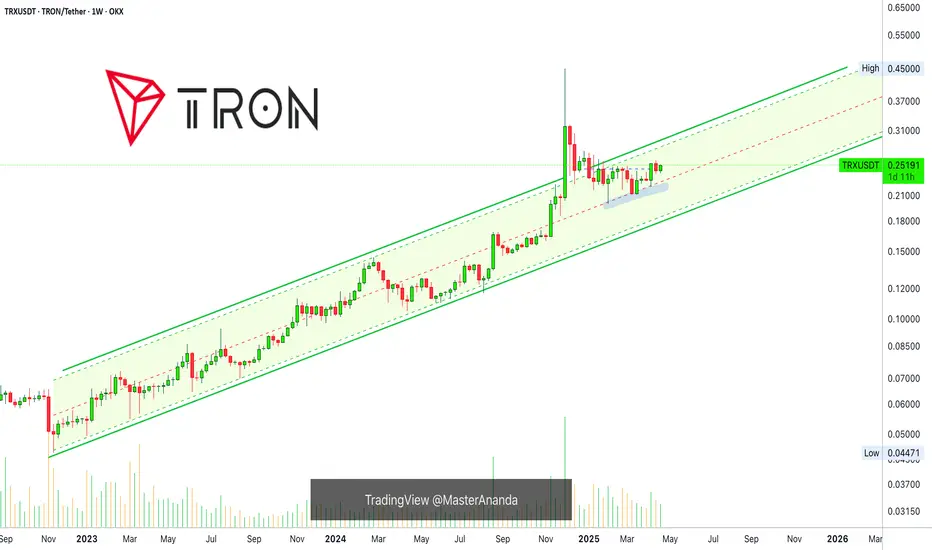
Tron Eternal Uptrend ContinuesThis is good news for the overall market. Tron continues to grow.
If we give a closer look to this chart, we can notice a rounded/cup pattern developing after the last correction and this is a strongly bullish development.
The action is moving above the base (blue line) of the pattern and this is what makes this chart structure super bullish.
Support was found also on the middle trendline of the long-term rising channel. The uptrend that has been present since November 2022.
TRXUSDT is set to continue growing long-term.
It is true that Tron is its own economy and has a real working product, or else the chart wouldn't look like this. A chart like this says that something positive is happening behind the scenes. All conditions for this trading pair and Cryptocurrency project continue to be green.
Namaste.
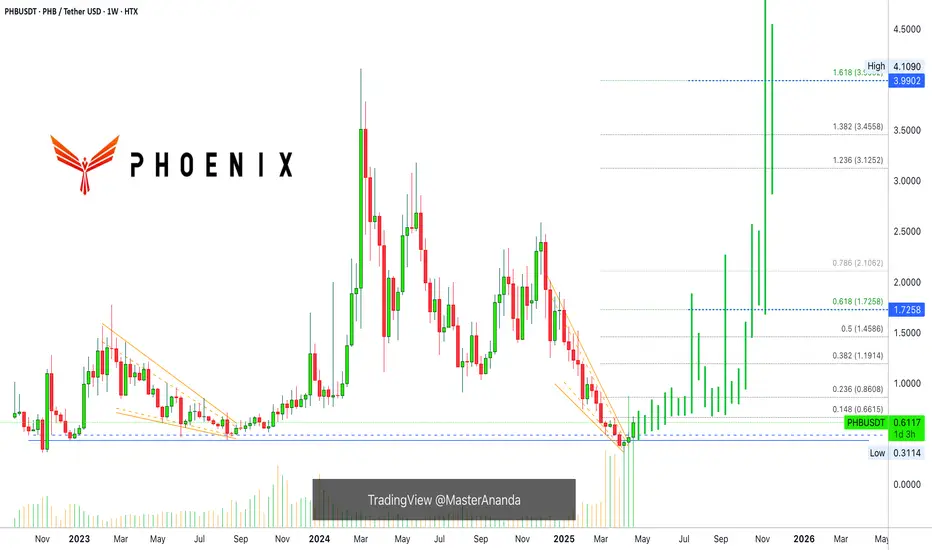
Phoenix Global Massive Growth Ahead Bullish Bias ConfirmedLast week produced the highest volume ever, extremely high, after a very strong bottom candle and signal. Phoenix Global is set to enter a major bullish trend and bull market cycle. The bottom is in.
Good morning my fellow Cryptocurrency trader, this is a great and interesting chart.
The best signals come from the candles, the best support from the volume indicator, here we have both working in unison. Great.
A doji is the candle that produced the correction low. The session ended green and with high volume. The doji is a reversal signal when confirmation comes and confirmation is in.
The following candles after 7-April are high volume candles, extremely high and full green. That's it. These past three weeks confirmed two things: (1) The bottom is in and (2) a new bullish wave will develop.
A new uptrend can last months or it can even go for years. So it is very interesting to be able to find these charts while they are trading at bottom prices. Joining the market at this time, buying and holding, can be life changing, truly. You will have your confirmation in a matter of weeks. It will take only 4-6 weeks for everything Altcoin to trade 300% higher. And that will only be the start.
» PHBUSDT activated its two strongest support levels, that is August 2023 and November 2022. The 7-April low produced a technical double-bottom and a factual long-term higher low. Another signal in support of massive growth comes next be ready and prepared.
Thank you for reading.
Namaste.
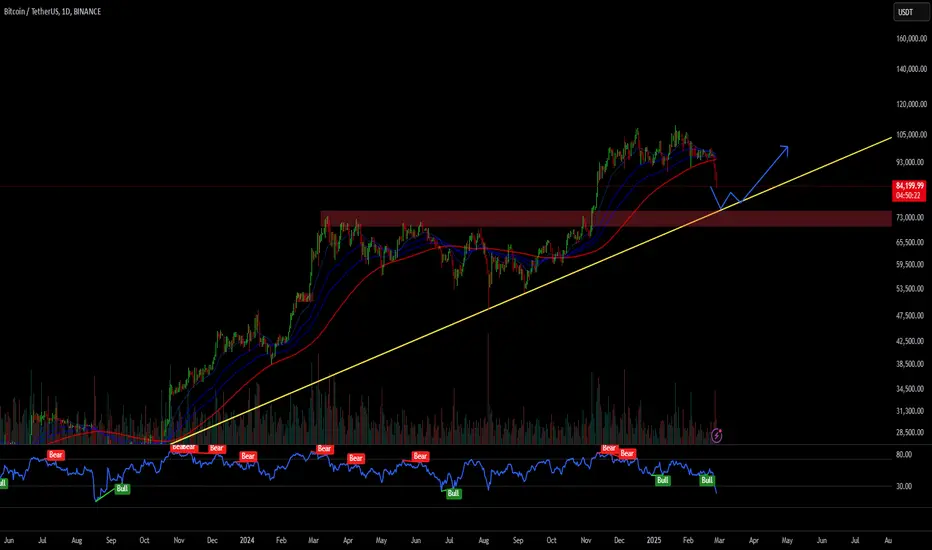
Bitcoin "Crash" 2025Bitcoin started a more significant correction recently, which is scaring many people, and there is already a lot of talk about the beginning of the Bear market.
In my view, the upward trend is still intact, and this could very well be a healthy correction to prepare for a more significant rise in the coming months.
We have an important support level at $75K which has confluence with the 3D SMMA which has already proven to be strong in the past, I think there will be some reaction and that could very well be the end of this correction, but as long as the price manages to stay above $70K I will remain bullish and looking for Longs.
It is important to note that the Fear and Greed indicator is at 21, with Bitcoin at $84K.
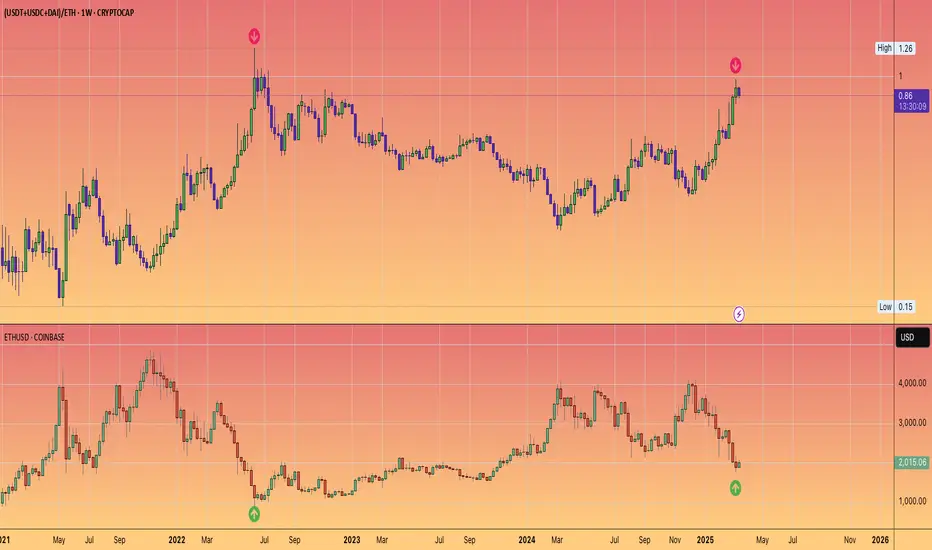
ETH Bottomed last week!This chart illustrates the ratio of the market capitalization of the top three stablecoins and that of Ethereum (ETH).
The correlation is quite evident, as anticipated.
We are likely approaching a phase where these stablecoins will be deployed, with Ethereum being a key beneficiary, signalling that we are entering a period of increased risk appetite and overall market buoyancy.
#ALTS
#USDT
#USDC
#DAI
#ETH
A wonderful ALTCOIN Bullrunis all set in motion.
If my chart resonates with you in any way.
The combined dominance charts of the big four.
#BTC.d
#ETH.d
#USDC.d
#USDT.d
We are on our way to my anticipated target zone.

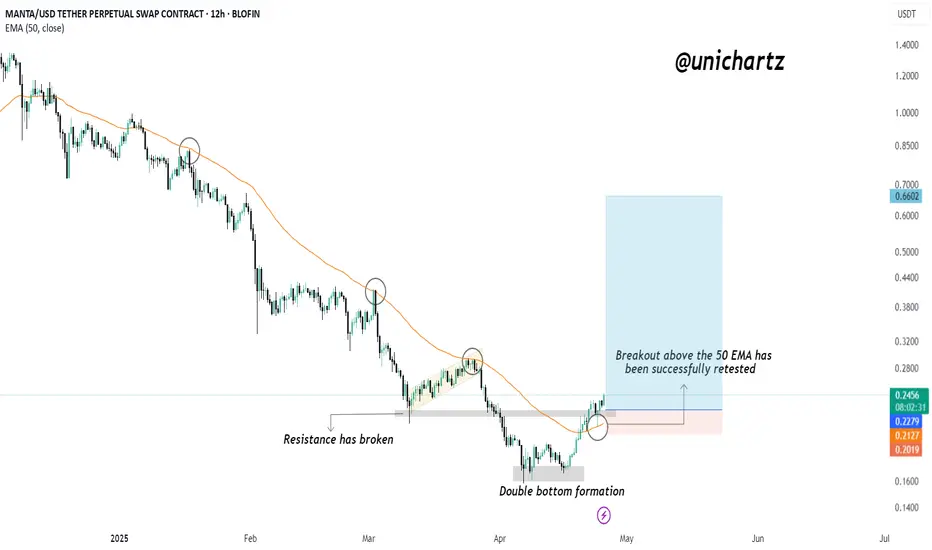
MANTA/USDT – Bullish Structure Forming MANTA/USDT – Bullish Structure Forming
MANTA is showing early signs of a trend reversal, with multiple confluences indicating strength from the bulls. After a prolonged downtrend, the asset has not only broken key resistance levels but also flipped the 50 EMA, a major dynamic resistance, into support.
✅ Key Technical Highlights:
Double Bottom Formation:
The chart has clearly printed a double bottom, one of the most reliable reversal patterns.
This formation suggests that bears are losing control and buyers are starting to step in with conviction.
Breakout Above the 50 EMA:
Price has decisively broken above the 50 EMA (~0.2127), which had previously acted as dynamic resistance during the downtrend.
Notably, the price retested the 50 EMA and successfully bounced, confirming it now as support.
Resistance Flip to Support:
The previous horizontal resistance zone has been breached and retested, reinforcing its role as a demand zone.
Market Structure Shift:
Lower highs and lower lows have now transitioned into higher lows and higher highs, signaling a structural shift from bearish to bullish.
Momentum and Candle Structure:
The bullish candles post-retest show strong momentum with minimal upper wicks — a sign of buyer strength.