Solana About To Gain Bullish Momentum Towards $420, Later $1000+It seems like Solana has been taking forever to grow, to recover; it seems like a long time. Let's do some maths. The bottom was in 7-April and we are now on July 21. 98 days. A little over three months. That is how long it has taken Solana to move back above $200. Seeing that the all-time high is $295, this isn't a long time, we are getting close to resistance and this resistance will break easily just as it happened with Bitcoin. Solana is set to grow to $420 mid-term and this bull market is likely to give us a target of $620 and potentially $1,000. $1,000 is the bright spot we want to hit on the bull run phase.
Why aim so high? Because the correction was really small in comparison to Solana's major bullish cycle since 2022. Solana crashed and crashed really hard but this hard-crash led to the strongest bullish cycle ever. Only in January 2025 did Solana stop too breathe and it did so by doing a 60% drop-market flush. With this drop over, Solana can produce the continuation of its long-term, eternal bullish cycle. Higher and higher, week after week, month after month.
If you are a Solana holder I just want to tell you to be patient on this pair. All the gains that have not been done in the past will be fulfilled in a matter of days. Solana will catch up with the rest of the giants and grow strong. Once Solana is up there at a new all-time high, the rest of the market will continue to grow.
Think of Solana behaving just like Bitcoin; when it reaches high up, instead of crashing we can experience some consolidation followed by additional growth. When we are close to the true cycle top, money will flow out of these big projects into the smaller ones, creating a major bull run.
All is good and perfect and it is early still today. Think about it, would it be late to buy below $200 when you know the potential is 1K?
Thanks a lot for your continued support.
Namaste.
Altcoins

Apecoin Technical Analysis · New All-Time High & Easy TargetsAs I told you just recently, the moving averages can be used in different ways. The main way is to gauge the market bearish or bullish potential and this is the classic way. The second one, less conventional, is to know how advanced is a trading pair within the current cycle.
Before everything was growing, we would confirm a pairs bullishness by looking at EMA55, EMA89, EMA144, MA200, etc. But now that we have a confirmed bullish bias, we can use these same moving averages to see how much room there is left for growth. For example, here APEUSDT is trading below EMA55 weekly. This is great news. This reveals to us that this pair is still early. As we know the entire market will move upwards based on the classic four years cycle—a bull market every four years, or the fact that a bull market happens the year after Bitcoin's halving—catching a pair before a major breakout can be life changing, profits can be huge.
But we still need some bullish signals though so let's look at those. Apecoin moved below its August 2024 market bottom. This is bearish. Once the action is happening back above this long-term support level the bullish bias is confirmed. Currently, APEUSDT is trading above its August 2024 low.
Another good and strong bullish signal is the classic rounded bottom pattern. On the 7-April low a rounded bottom pattern formed to produce a reversal. Notice how the trading volume is much lower on the last low compared to previous action. If the market was set to continue lower long-term, the lowest point would have high volume. Lower lows with decreasing volume signals that the bearish trend is losing force. This is already confirmed here because Apecoin produced a higher low in June and has been closing green several weeks.
Technical analysis coupled with marketwide action. Apecoin is set to grow strong long-term.
Thank you for reading. I hope you find this information to your liking. I hope you make tons of profits in this bull market cycle and fulfill all of your goals. You are appreciated.
Namaste.

Ethereum: Breakout Holds Strong | Next Targets $4K, $7K+Last week, three major crypto bills cleared the U.S. House of Representatives—and Ethereum (ETH) is emerging as the biggest winner from this legislative momentum.
ETH recently broke out of a rounding bottom pattern and hasn’t looked back. Momentum continues to build, and it’s now outperforming most other major assets.
📈 Technical Highlights:
✅ Short-term target: $4,000
✅ Long-term potential: $7,000–$8,000
🛡️ Key support: $2,700–$2,800 (bullish as long as this holds)
📣 Takeaway:
Ethereum’s breakout remains intact. Pullbacks into support could offer high-probability setups for swing traders and long-term investors.
#Ethereum #ETHUSD #Crypto #Trading #TechnicalAnalysis #CryptoTrading #EthereumPrice #Altcoins #Bullish #Breakout

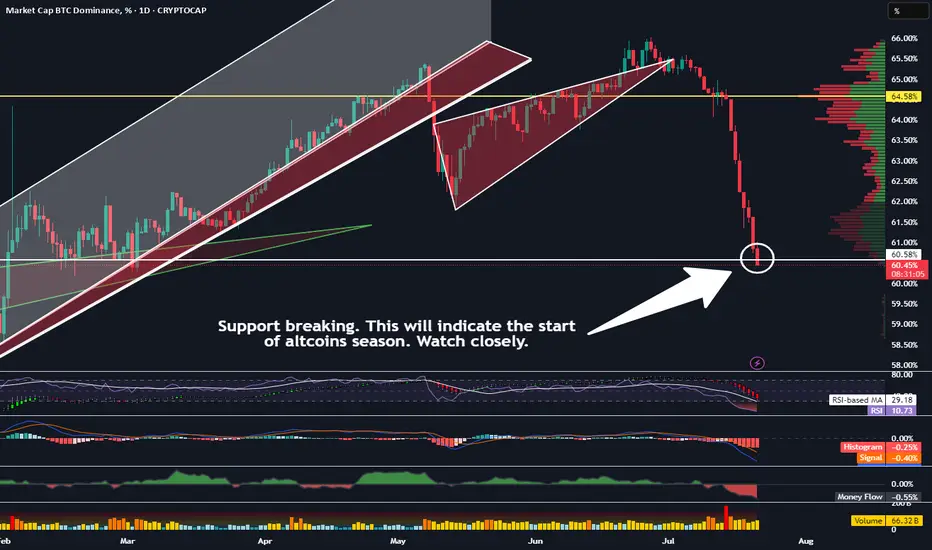
When This Support Breaks, Altcoin Season Becomes Official!Trading Fam,
We have many signs that altcoin season is almost upon us. Solana is breaking important resistance. Eth is nearing its target (both of these posts can be found below). But the most important indicator imo can be found on our BTC.D chart. Dominance has now reached an important support. I was kind of expecting a bounce here. And it still could bounce. But if it doesn't, then I feel like I can officially state that we will be in altcoin season for the rest of the year. Here's what you should be watching. If the body of that daily candle closes below our support today and then a new one opens and also closes below the support, its a wrap.
Let's go!
✌️Stew
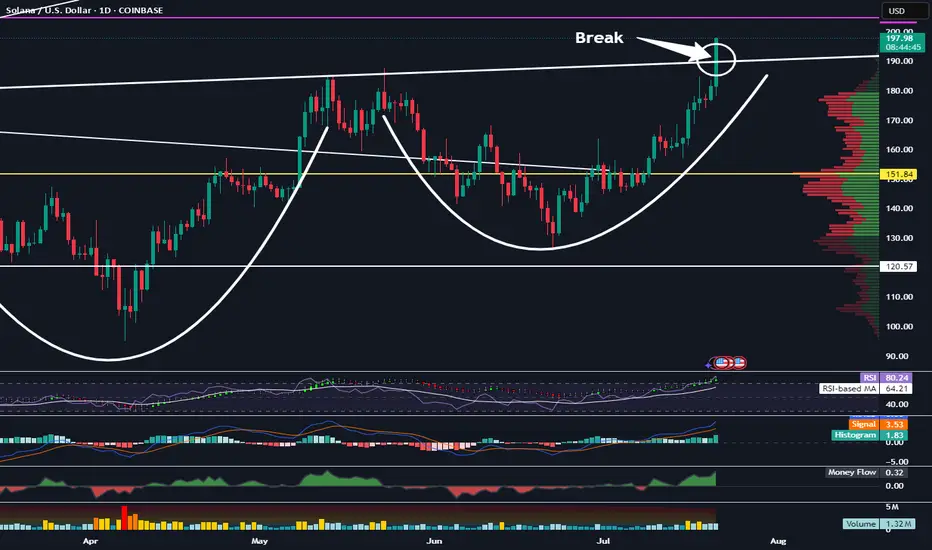
Solana Has Broken This Important Resistance LevelTrading Fam,
Things are definitely heating up in the altcoin space. Two big key movers are ETH and SOL. Right now SOL has broken a very important resistance level in the neckline of this inverse H&S pattern. Watch closely. If the body of our daily candle closes above this today and remains above it tomorrow, this pattern is in play and our target would be around $275.
✌️Stew
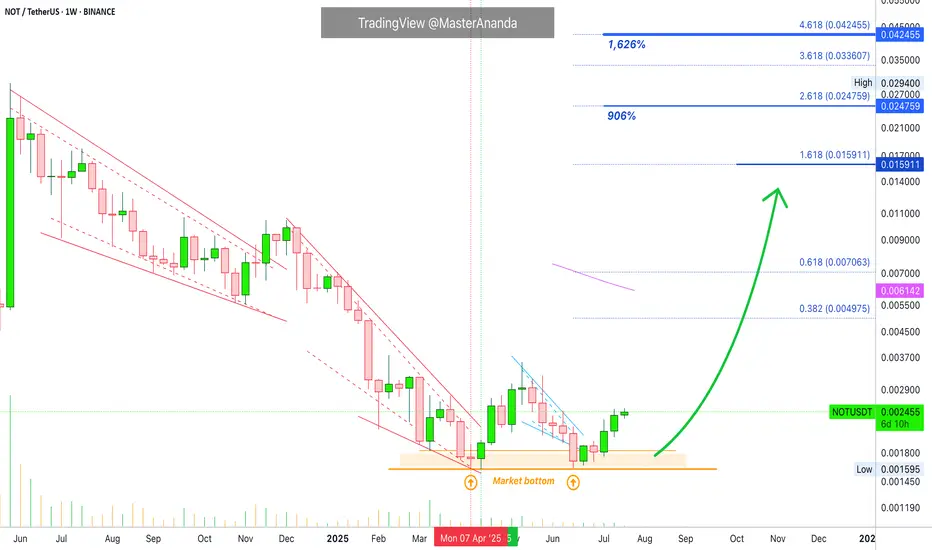
The Truth About Notcoin · Still Trading At Bottom PricesDid you miss Notcoin's bullish wave? No you didn't because it is still very early in this game. This is the beauty of the Cryptocurrency market, you can even wait for confirmation and still have access to countless opportunities.
I just showed you some charts for Cardano, XRP, Ethereum, Solana and others. What difference do you notice between those and Notcoin? Yes you guessed it right; the former are trading very high up while the latter is still trading at bottom prices.
Notcoin is still trading at "opportunity buy zone" prices because the action is happening below its May 2025 high. The trading is also happening below EMA55 and in this instance this means that it is super early. Early not bearish because we know the market is moving up based on Bitcoin Dominance Index (BTC.D), Bitcoin and the Altcoins. Everything already confirmed what we have been predicting for months.
So, NOTUSDT is set to produce a 20-30X strong bullish wave. The market is making this clear and is asking you, what will you do? How can your life change with this information that you have ahead of the masses?
While for you it might be the norm to know that "Crypto is going up," many, many people are still unaware, millions of people, and they will only join the market when prices are trading 500% to 600% up. After this we would still have the bull run.
Since you are reading this now, you have great timing and you are ahead in this game. But this opportunity buying zone won't be available for much longer, it will be gone in a matter of days. Some pairs will give us at least a few weeks to buy low, the rest of the market will start to move ahead and just several days from now, marketwide bullish action will be the norm.
You know the future in advance. Take action. Make it happen. You can change your life for the better. You can produce outstanding results.
You have what it takes to succeed in this game.
Plan ahead and you will be able to collect huge profits.
It is better to hold several projects long-term rather than switch around between pairs. Just a friendly advice.
Thank you for reading.
» Beginners should simply hold, watch and read.
» Experienced market participants should trade.
» Experts should be using leverage and pyramiding.
This is the opportunity we've been waiting for.
Namaste.
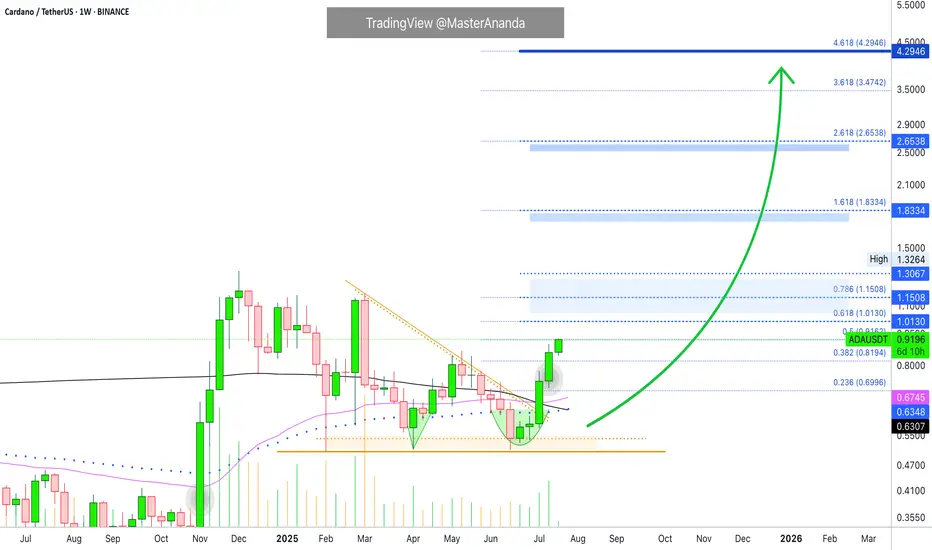
Cardano Update · Straight Up · New ATH & MoreCardano is easy to predict. We already have three great examples. Remember Bitcoin Cash? It has been growing straight up for 100+ days. Cardano will do the same. What about XRP? It is already trading at new all-time highs and Cardano is in the same group/category; big market capitalization. Then we have Ethereum which is the most recent example, as predicted, it is moving straight up. No retrace nor correction which is normal because it went sideways for months before the current bullish breakout.
Cardano has now four green weeks and this is the fifth one. This one will not be red which means straight up.
Technical analysis
I already told you about EMA55 and EMA89, weekly timeframe, ADA is trading above. MA200 as well. Notice the descending triangle on this chart. This was the consolidation period and it already broke bullish.
Targets & new all-time high
Expect ADA to continue growing until it hits the highest prices since 2021. $1.83 and beyond. Once this level is conquered, we can start rooting for a new all-time and this will happen with a high level of certainty.
Cardano will easily reach $3 and move beyond $4. I think it can go much higher...
I will do a new publication with updated new all-time high projections. The targets above are valid for the coming months.
Just a friendly update.
And thank you for your continued support.
(If you enjoyed this post, follow!)
Namaste.
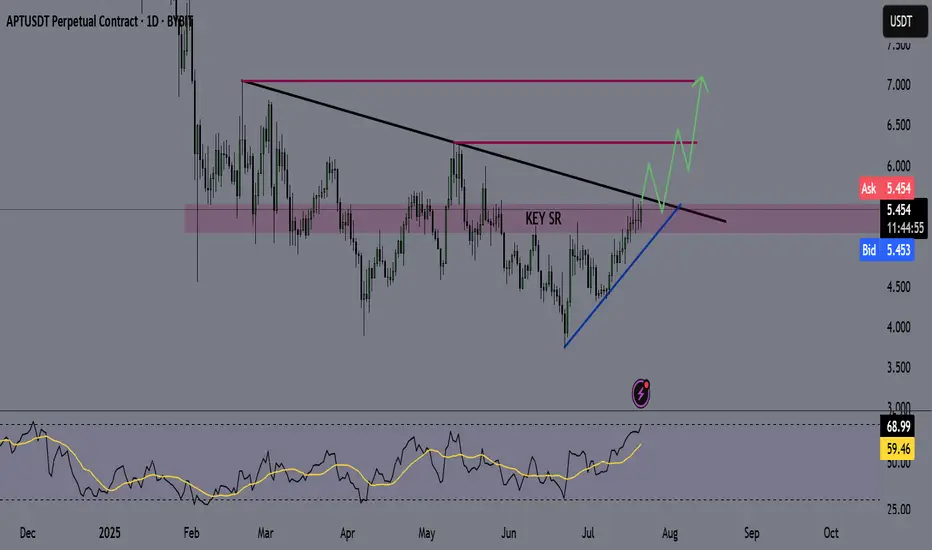
APT - APTOS Coin - Swing Long Idea📌 Fundamental Sentiment:
The entire crypto market is rallying, alongside other risk assets. This momentum is largely driven by U.S. policy expectations — specifically, Trump’s increasing pressure on Powell to resign and aggressively push for rate cuts from the Federal Reserve.
📌 Technical Analysis:
Price is currently testing the HTF supply zone with strong momentum. Additionally, it’s approaching a long-term bearish trendline that has dictated the downtrend since February 2025.
📌 Gameplan:
I want to see:
A clean breakout above the HTF supply zone with daily candle closure.
A confirmed break and close above the HTF bearish trendline on the daily timeframe.
If both confirmations align, I’ll start preparing for swing long setups, potentially riding into the early stages of a 2025 altseason.
—
🔔 Like & Follow for more daily updates. Feel free to drop your thoughts in the comments!
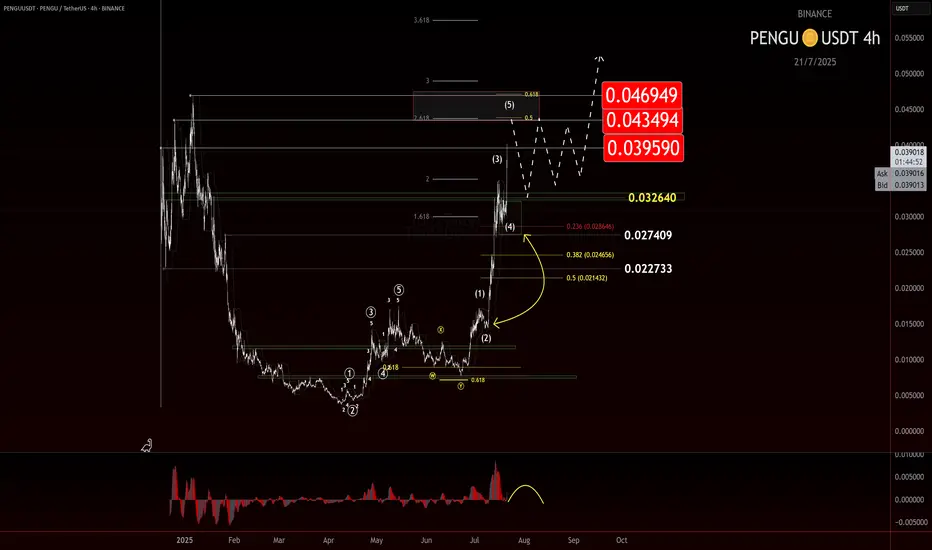
$PENGU: Taking Profit and Watching for a TurnIf you find this information inspiring/helpful, please consider a boost and follow! Any questions or comments, please leave a comment!
PENGU has made a strong move off the 0.007 level, now it just popped cleanly out of consolidation beneath the key LOI at 0.032. That break gave us the signal we needed for continuation, and so far, the price has followed through nicely.
But now, we’re approaching a zone where things could get a bit trickier.
This advance is starting to look like a classic wave 3 impulse, and while there’s no clear confirmation of a top yet, signs are beginning to flash caution. That means it’s time to start watching for potential topping behavior—especially if we move into a broader consolidation phase.
Here’s what’s on my radar:
• Wave 3 Exhaustion?
Still unconfirmed, but this could be the final leg of the wave 3 structure.
• AOI or Key Level Rejection
A stall or strong reaction near resistance could be a red flag. Channel parallel being reached.
• Bearish Divergence on the EWO
Momentum isn’t keeping pace with price. That’s often a precursor to a deeper pullback.
No need to force the next move here. This thing could just keep ripping up, but I am being extra cautious here. Not only to look for a potential top, but if a retrace is given, a potential long add to my current trade. Taking profit at these levels makes sense, especially given the early entry from 0.012 and my trade plan.
As always, trade what’s printed, not what’s hoped for. Stay nimble.
Trade Safe!
Trade Clarity!
21/07/25 Weekly OutlookLast weeks high: $123,220.24
Last weeks low: $115,718.15
Midpoint: $119,469.19
New BTC ($123,220) & SPX ($6,315) ATH last week! We're really seeing progress being made on all fronts now, bitcoin saw its sixth week of net inflows into BTC ETFs ($2.39B).
The week began strong hitting the new ATH very early and then settled into a tight range to cool off. Altcoins however surged in relation to BTC to break out of HTF downtrends and begin to make up lost ground. One of the beneficiary's of this price movement has been ETH, breaking out from a multi year downtrend against BTC and hitting $3,800 in its USD pair.
For this week I do expect much of the same for BTC as momentum is with altcoins for now. However, as those altcoins reach HTF resistance levels it becomes very important for Bitcoins chop to be accumulation for the next leg up and not distribution for the way down. With so few pullbacks the threat of a sudden correction is present but the probability drops should BTC look to press higher with strong demand.
The ECB Interest rate decision takes place on Thursday but no changes to the 2.15% rate is forecast. In terms of news there are no planned upsets that I can see.
Good luck this week everybody!

ALTSEAON CHART UPDATE OF CRYPTOCURRECIESthis is altcoins chart , braking through a bulling orderblock ,
its high prbable this gonna break ATH and the move to the new wealth making moves ,
investment is high risk and high rewarding

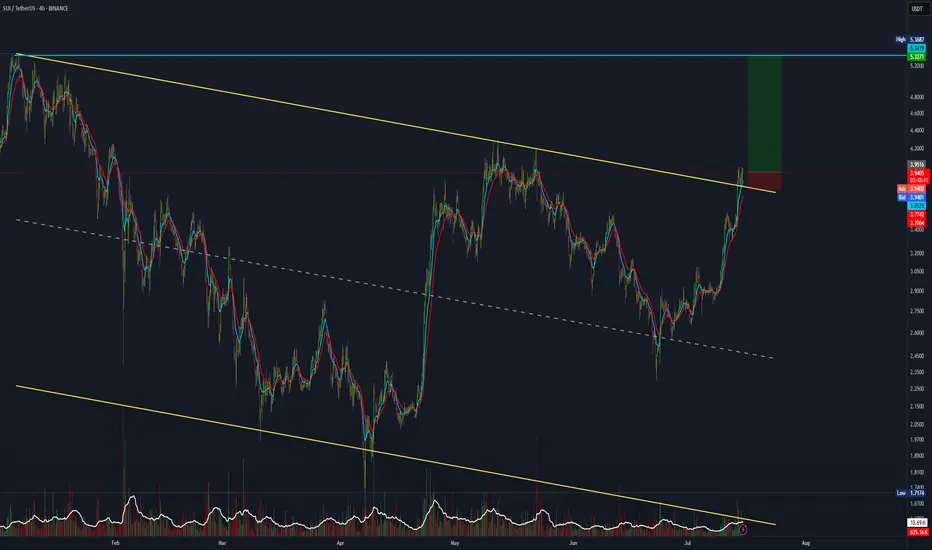
SUI trade setup with a 7:1 risk-to-reward ratio.SUI has broken out and retested the major channel. If you're bullish, this 7:1 R:R setup is worth considering.
Entry: 3.94
Stop Loss: 3.77
Target: 5.30.
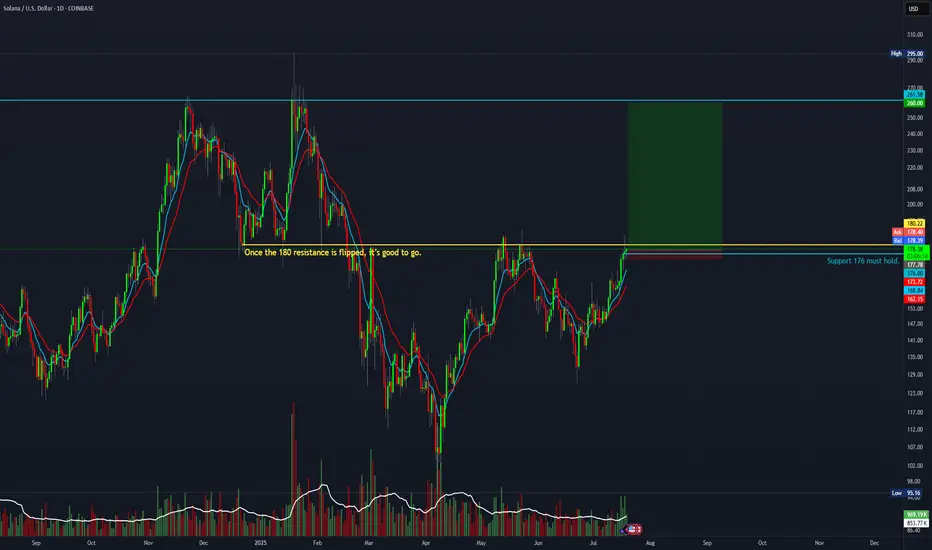
20:1 R:R for SolanaTaking a chance on this super high-risk setup with a 20:1 R:R before it takes off.
Entry: 177.78
Stop Loss: 173
Target: 260
OFFICIAL TRUMP Last Barrier · $30 or $100 Next · MixedThe last barrier is on now. The last barrier as in the last and final resistance level TRUMPUSDT (OFFICIAL TRUMP) needs to conquer before a major rise. Will this rise reach $30 or $100 or higher? Continue reading below.
Make sure to boost this publication and follow to show your support.
Hah! Resistance is confirmed as EMA89, what a drag. This is the blue dotted line on the chart but notice something else. Look at the magenta line, EMA55. TRUMPUSDT is trading above EMA55 but below EMA89. Bullish and bearish. Bearish and bullish. Mixed?
There is nothing mixed.
The main low happened 7-April. A higher low in 22-June. Can you see?
This is not mixed, this is bullish confirmed.
If the market were to move lower, then in 22-June we would have either a test of the 7-April low or a lower low. The fact that the drop stopped higher means that buyers were present. People were actually expecting for prices to drop and once they dropped they bought everything that was being sold. Prices couldn't move any lower because people were buying up. These are smart trader, smart money; experience for sure.
They managed to buy some tokens at a lower price within the "opportunity buy zone." This zone is available no more and now we have the mix of resistance and support; EMA89 and EMA55. What happens next?
Based on the previous signal I just showed you and marketwide action, Bitcoin super strong, we know that TRUMPUSDT will follow and break-up. Yes! Massive growth.
Both targets are good and will hit. Short-term, we will see a challenge of $30 and long-term we will see $100 and beyond.
Thanks a lot for your continued support.
Namaste.

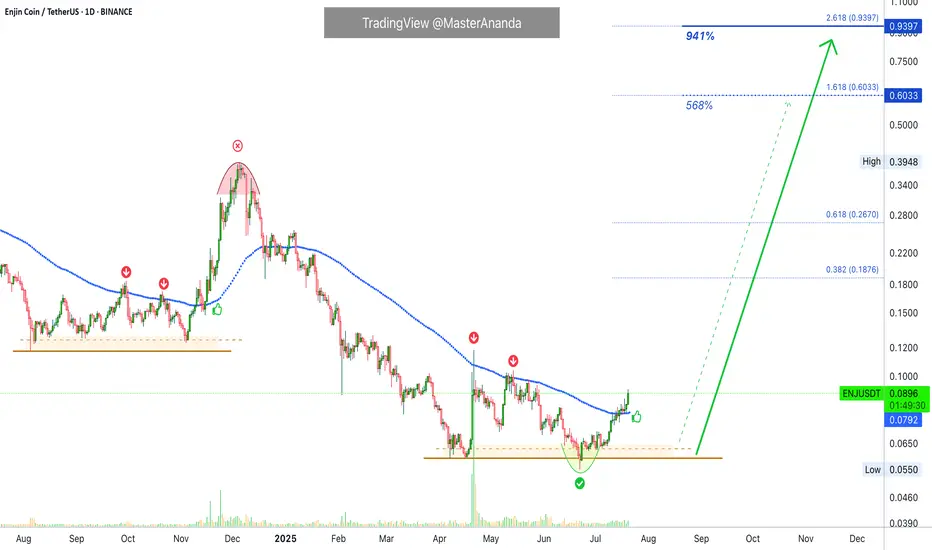
Enjin Coin Ready for a Truly Major Advance · PP: 941%Technical analysis is truly an exact perfect science, when mastered. If you master this tool you can use it successfully to make very strong and accurate predictions.
If you can make one prediction right, then the tool works.
If you can make several correct predictions, then the tool being valid is confirmed.
If some predictions fail, we have to assume our interpretation is wrong rather than the tool. If the tool is the one at fault, then all predictions would be either wrong or random. And since we can make thousands of highly accurate predictions, it means the tool works.
Back in late 2024 ENJUSDT was rejected twice at EMA89 resistance. As soon as it broke above this level it produced a strong advance. This wasn't enough and the market moved lower. As it reached a major low point in April and June 2025, the same conditions showed up.
ENJUSDT was rejected twice below EMA89 as resistance, notice the red arrows on the chart. Currently, Enjin Coin managed to conquer EMA89 and this is bullish. Looking at past history and knowing what we know about EMAs, this means that the doors are open for a strong bullish wave.
Enjin is set to produce a major advance and this is already confirmed. Just like late 2024 but much stronger, prices will go much higher because we are in the year of the bull market, post Bitcoin halving, every four years. Marketwide growth is happening and will only increase. This pattern has never been broken, it is already happening, it is confirmed and guaranteed.
Namaste.
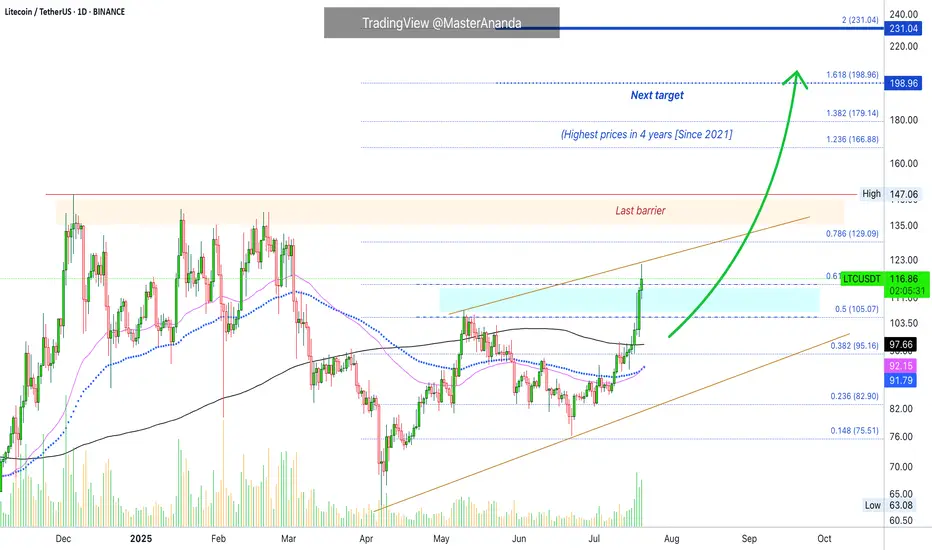
Litecoin's Path Beyond $200 Revealed · Daily TimeframeWe looked at Litecoin on the weekly timeframe which is the long-term picture, but we also need to consider the daily to see what is happening up-close.
As soon as we open this chart we have three signals that stand out:
1) Litecoin is now trading above MA200 safely and rising. This is a very strong bullish development and supports additional growth.
2) Trading volume has been rising significantly being now the highest since February 2025. The difference is that in February we were in distribution, resistance being confirmed with prices set to move lower. In this case, the action is rising from support and volume is rising rather than dropping.
3) May's peak has been broken. Many pairs are still trading below their high in May. Those that broke this level are the ones moving first and this signal exudes strength. Litecoin is now one of the top performers specially in the group with a big market capitalization.
The next barrier is the December 2024 high at $147. Short-term the next target is $129. As soon as the former breaks, we are going to be looking at the highest price since 2021.
Litecoin is fighting resistance today, 0.618 Fib. extension at $115. It is trading above this level but the confirmation only happens at the daily close. If it closes above, bullish confirmed. It if closes below, it means that there will need to be some struggling before higher prices. This struggling can last a few days just as it can extend. Seeing Ethereum and how it is moving straight up, Litecoin is likely to do the same.
Overall, conditions are good for Litecoin on the daily timeframe.
Thank you for reading.
Namaste.
ETH Weekly Recap & Game Plan 20/07/2025📈 ETH Weekly Recap & Game Plan
🧠 Fundamentals & Sentiment
Market Context:
ETH continues its bullish momentum, driven by institutional demand and a supportive U.S. policy environment.
We captured strong profits by sticking to the plan (see chart below).
🔍 Technical Analysis
✅ Price has run into HTF liquidity at $3,750
📊 Daily RSI has entered the overbought zone, signaling potential short-term exhaustion.
We may see a brief retracement or LTF liquidity grabs, which could be enough to fuel a further push higher — potentially to $4,087.
🧭 Game Plan
I’m watching two key downside liquidity levels:
$3,534 (black line)
$3,464
A sweep of either could provide the liquidity needed for continuation toward $4,087.
⚠️ I’ll wait for LTF confirmation before entering a position.
📌 Follow for Weekly Recaps & Game Plans
If you find this analysis helpful, follow me for weekly ETH updates, smart money insights, and trade setups based on structure + liquidity.

Virtual Coin – Technical Outlook & Trade Plan🔍 Technical Analysis
✅ Price has broken and closed above the bearish trendline, indicating a shift in market structure.
✅ It’s currently consolidating above the trendline, and each retest is showing strong bullish reactions.
✅ The bullish daily demand zone is holding aggressively, reinforcing upward momentum.
I do not expect a significant retracement from here until we reach the purple line (2.59). The current structure suggests price wants to seek higher liquidity.
📌 Trade Plan
Entry: Current market (above trendline + demand zone reaction)
Take Profit (TP): 2.59 (Purple Line)
Stop Loss (SL): 1.26 (Daily Close Below)
📊 Bias: Bullish
🕰️ Timeframe: Daily
📍 Invalidation: Daily close below the demand zone and trendline support
💬 Feel free to share your thoughts or ask questions below!

Eth and the Altcoin Season Once Etherum retest and breaks previous cycle ATH and LMACD visits the diagonal traced from previous cycles (white dot). An altcoins season might follow.

Ontology Back Above Final Bottom · Crypto, The Future of MoneyOntology is now trading back above long-term support. Long-term support was established by multiple lows in 2022, 2023 and 2024. In 2025, ONTUSDT broke briefly below this level. This drop ends up being a "stop-loss hunt event." Once the action recovers above long-term support, the market is confirmed ultra-bullish and ready to grow long-term.
Long-term growth is what you see projected on the chart with targets at 1,000% and even beyond 2,000%. Can be higher of course.
A massive rally is expected because of the prolonged consolidation period. The longer the accumulation phase, the stronger the bull market that follows.
If the market was set to enter a new bearish cycle, instead of a recovery above long-term support we would get a rejection and this rejection would lead to lower lows. Instead, ONTUSDT moved below just to recover. This recovery is all we need to go all-in.
Notice we have two full green candles and we are about to close this week. This is the start of very strong, major bullish action.
Good afternoon my fellow Cryptocurrency trader, how are you feeling in this wonderful day?
The altcoins market continues to heat up but as can be seen from this chart, you've seen nothing yet. Yes, some pairs are really advanced and this is only good because we know the rest of the market will follow.
The sequence goes like this: First Bitcoin moves. Then Bitcoin remains high, strong trading near resistance. This signal is taken by the top 25 altcoins and they start to move forward as well. When the top altcoins move forward and remain strong, the medium sized capital projects then start to grow. Finally, the small size and the rest of the market moves forward.
The previous bear market was brutal.
The last consolidation period is the largest and longest ever.
Fundamental conditions continue to improve.
While Cryptocurrency was considered a crazy innovation, technological porn, things are different now. We have laws and regulations coming out in all the major nations of the world supporting the adoption and development of Crypto. Humanity continues to adapt, grow and evolve.
With a new regulatory framework now in place, it is only a matter of time before Crypto takes over the world. We don't use cash anymore... We use electronic transfers and credit cards; these are also coming to an end.
We will say next: We don't use card anymore, we simply make transfers using our computers and phones. It is more efficient, it is easier and we already have a cell phone so we don't need to hold a card or a bunch of paper to buy stuff.
Crypto is free. Crypto is new. Crypto is accessible. Crypto is young... Oh, and it has amazing room still left available for growth. We can become rich through Crypto.
Thanks a lot for your continued support.
Namaste.

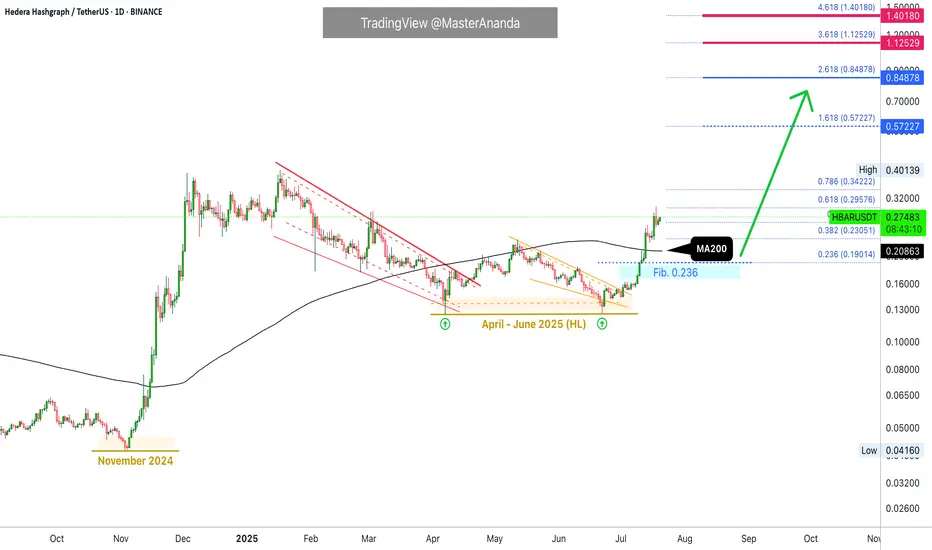
Hedera Update · Keep Holding · No Selling, YetHedera (HBAR) looks awesome. The action and chart right now is one of the best in the market. I love the fact that the candles are moving straight up. This can be equated to how FUN Token (FUN) has been performing in the past month. What one does, the rest follows.
The most interesting signal comes from MA200. Trading is happening above this level and that's all we need to know. When HBARUSDT broke above it, any bullish potential and bullish signals become fully confirmed. It is not a question of "if" anymore but instead a done deal. Growth is expected to happen for a period ranging between 3-6 months once this signal shows up.
This means you can see a strong retrace in a month and still, you remain calm and hold because you know higher prices are still possible. This means that if you see a correction after three months, you can take profits of course but still know that the top is not in. It will take a while before the entire bullish process is complete.
The top is not only calculated based on time duration but also on price levels and marketwide action. Depending on how the rest of the market is doing; looking at Bitcoin and at what price the pair in question is trading can help us confirm if the top is in. For now you just keep on holding.
Each chart/project/pair needs to be considered individually. If your technical analysis ability is lacking, you can always contact me and I will publish an update for you. If you publish news articles, videos, trade-signals or even TA, you can come to me for confirmation, ideas or just inspiration and I will take care of the rest. Once you have your update you can decide what actions to take. It is still early in this game.
The initial portion of the bull market is long gone. Here it started in November 2024, you can see it as the "market bottom." We are on the second portion now in 2025. The year started with a correction and the correction ended in April-June with a very strong higher low. Projects like this one reveal super-strength compared to the rest of the market, it happens with the top 100.
If you consider some of the smaller projects I've been sharing, you see double-bottoms compared to 2024, 2023 and even 2022 and even new all-time lows. Here the low in 2025 is far away from November 2024 and this is good news. That is why I say that each chart/pair needs to be considered individually because conditions are not the same for each project. The market has now thousands of good projects and tens of thousands of trading pairs. It is impossible to say how one will move based on the other because they are just too many and too far away.
The bigger picture and the general bias, yes, bullish all across. Exact resistance and support levels, where to sell, where to buy; should I continue to hold? This is what needs to be considered individually.
Your support is appreciated.
If you enjoyed, please follow.
Namaste.
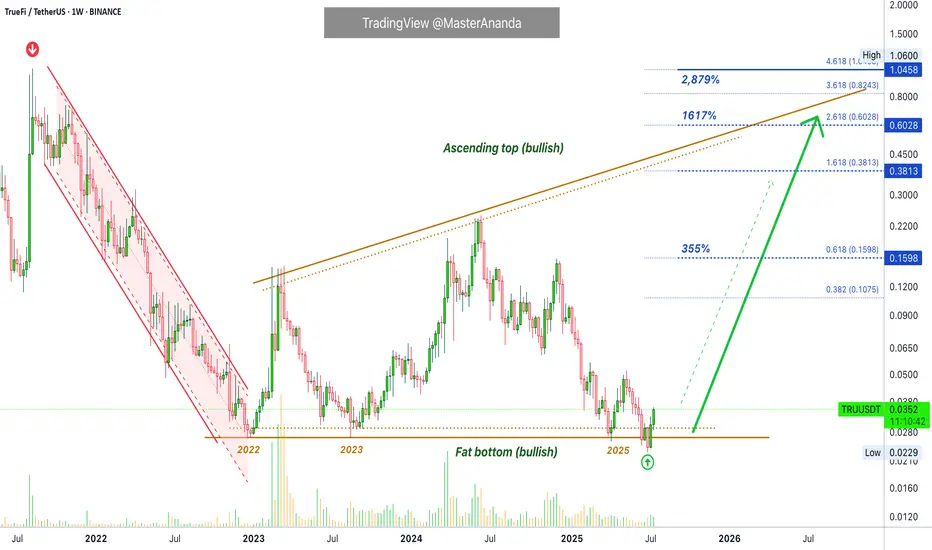
TrueFi · Bitcoin vs the Altcoins · Low Risk vs High RewardsTrueFi is trading at bottom prices. Notice the big difference between this pair and the ones that are trading high, near resistance or at a new all-time high. This is the difference I want to point out to new buyers.
If you are entering the market just now, you should be considering pairs like this one rather than the ones that are already pretty advanced. This is because the ones trading low/near support have more room available for growth, higher profits potential and very little risk. When prices are trading near the bottom, there isn't much room to go lower. When prices are trading high, even with marketwide bullish action, a correction can develop anytime.
We look for pairs like this one to buy and hold.
The second consideration is related to growth potential. While Bitcoin is awesome; Bitcoin is crypto; Bitcoin is great and is here to stay, it is already worth trillions of dollars. If everything goes amazing for Bitcoin, we might enjoy an additional 100% growth before the cycle ends. On an altcoin, in comparison, we can enjoy 1,000%, 2,000%, 3,000%, 5,000% or more. So you need to choose wisely.
A whale can easily choose Bitcoin because of liquidity issues, accessibility, security, stability, accounting, long-term performance, etc. A tiny fish is better off with the altcoins market, they have more room for growth.
Technical analysis
The red channel reveals a downtrend, the previous bear-market. The flat bottom in the following years reveals a consolidation period, long-term. Not a downtrend but creating a base. From the bottom we grow.
TRUUSDT is no longer bearish, moving down, instead it accumulated for years and now that this accumulation phase is over we are ready for massive growth.
We witnessed first a downtrend, then sideways (consolidation) and now comes an uptrend. These are the only three ways in which the market can move. Down—neutral—up.
The logical next step after a downtrend is always a sort of transition period, after this transition the uptrend starts.
We will have an uptrend now, this is what we call a "bull market." Higher highs and higher lows."
If you enjoy the content, you can always follow for more. It is easy and free and you get to receive updates every time I publish a new article.
Thanks a lot for your continued support.
Namaste.
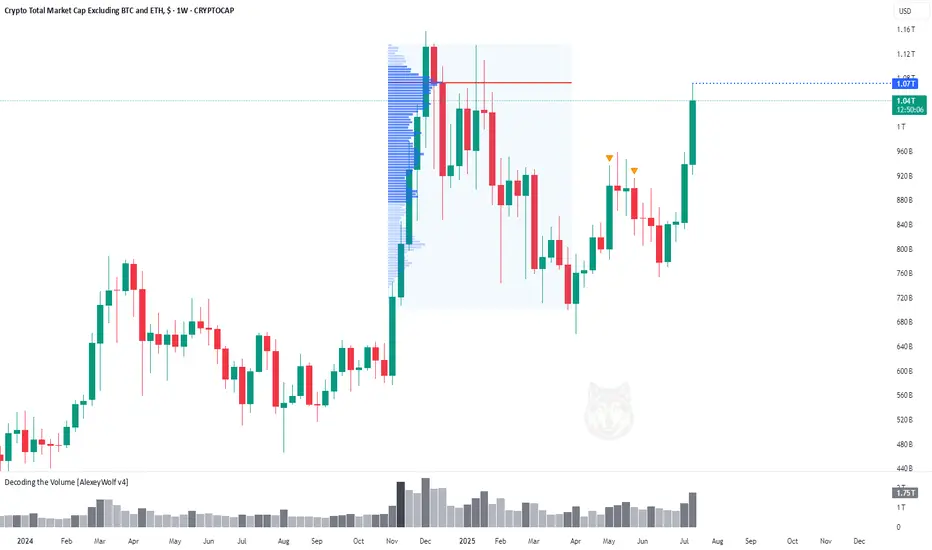
Altcoin Market Hits First Target at $1.07THi traders and investors!
The market capitalization of Total3 has reached $1.07 trillion, marking the first major target for the altcoin market.
This level corresponds to the Point of Control (POC) from the previous bullish rally and the subsequent correction — a key area of traded volume and market interest.
Several factors now suggest the potential for a continued move higher. On the fundamental side, the recent signing of a pro-crypto bill by Donald Trump has boosted overall sentiment in the digital asset space, especially among altcoins. From a technical perspective, many leading altcoins are showing bullish continuation patterns.
Wishing you profitable trades!