Worldcoin · Sudden Strong Jump · Beyond 2,400% Profits PotentialThe stage is now set. Chart and market conditions are perfect for a strong sudden jump. The type of advance that can change your life.
Good morning my fellow Cryptocurrency trader, I hope you are having a wonderful day.
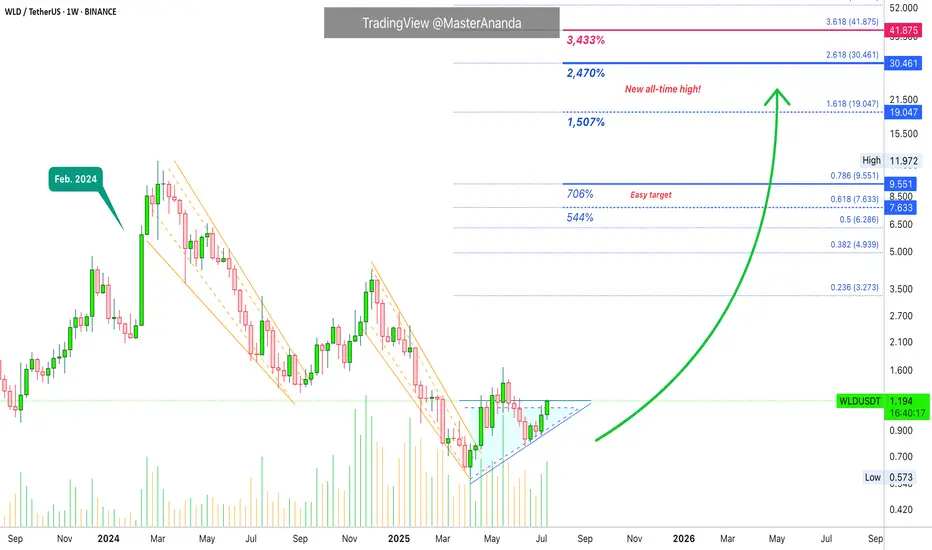
Worldcoin (WLDUSDT) is still trading at bottom prices but with a perfect reversal pattern complete. The action is moving weekly above EMA8/13/21 and this week is closing green. This type of chart signal predicts astonishing growth. Wait is not necessary anymore.
This growth is already happening because we have two full green candles but this isn't it. The last two candles are full green but small. Things will change for the better. We will have full big green candles, something like February 2024 but instead of just one candle and then the action running dry and the start of a correction, we will have many big green candles coupled with sustained growth. It will be the best you've experienced since joining Crypto. Your profits will go through the roof; your capital will continue to appreciate; everything grows.
Volume is starting to rise as well but still relatively low. We have low volume because it is still early. The thing about "early" is that everything changes in a day. A sudden price jump. So today we are seeing prices below $1.20, in a matter of days WLD can be trading at $3 and then higher. Once the bullish breakout happens there is no going back.
We have an easy target first around 500-700% profits potential. The main stop opens up 1,500% and then we have more. Another strong target opens up 2,470% and this should be achievable in the coming months. I plotted just one more target just in case the speculative wave does what it tends to do best, surprise us all.
Just as a bear market can produce new all-time lows, a bull market can produce new all-time highs. Mark my words. Crypto is going up. Bitcoin is going up. Worldcoin is going up. The entire market is about to have the best yet period of growth.
If you are reading this now, you have great timing. Market conditions will be so much different in just two months. What seems normal today, and abnormal today, will be the norm. When it was a strange happening to see a 700% bullish wave, you will be seeing +1,000% across the entire market and many projects doing many times that long-term. It is hard to explain, but it is going to happen —Guaranteed.
The altcoins market is set to grow long-term.
Namaste.
Altcoins
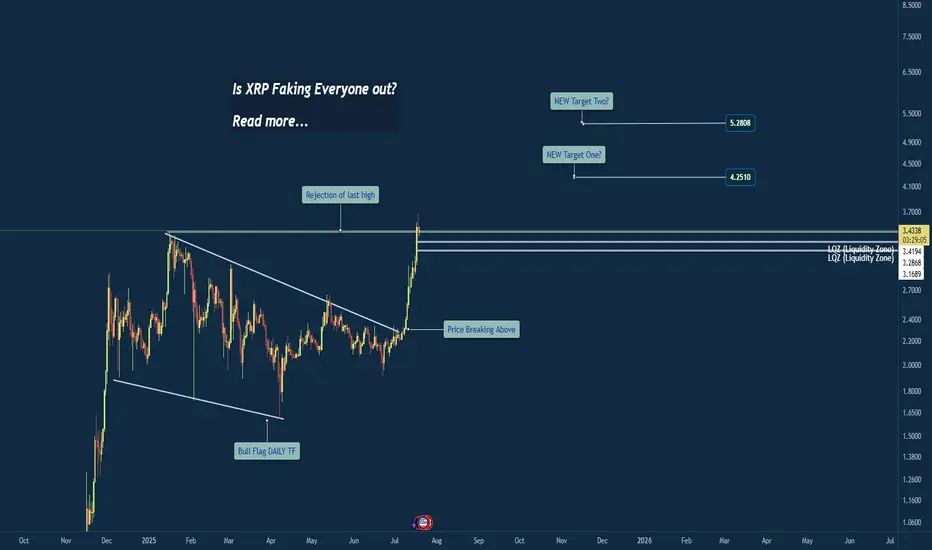
Breakout or Bull Trap? XRP at Critical Weekly LevelWeekly Chart Insight: XRP Closing Above Previous High
XRP has just closed above its previous weekly high—a significant development that could signal a shift in market sentiment. Historically, when price closes above such a critical level on the weekly timeframe, it often leads to continuation, unless a sharp rejection quickly follows.
At this stage, the focus shifts to the 4-hour timeframe for confirmation. An impulsive move above the current consolidation zone could indicate that this breakout is legitimate, potentially leading to another bullish weekly candle.
However, caution is warranted. If the next two daily candles close weakly or fail to maintain structure above the breakout level, it could hint at a fakeout or liquidity grab before a deeper correction.
My Current Bias:
I remain neutral-to-bullish, contingent on:
An impulsive continuation on the 4HR
Strong daily closes above the key range
Price not falling back and closing below the weekly breakout level
If price begins to consolidate and hold this level, that would reinforce the bullish case. But if we see immediate selling pressure and a re-entrance below the breakout, I’ll reconsider the bias based on developing structure.
The SqueezeWhile it is logical to assume that the bulls are the ones about to get squeezed, I am going to be a contrarian and bet on the SHORTs getting liquidated, big time.
Good afternoon my fellow Cryptocurrency trader, how are you feeling this Saturday?
Every now and then, every once in a while the market enters a fight between down and up. When tensions rise, when people become anxious, when greed is strong, that's the time for a market squeeze to develop.
Seeing how good Bitcoin is doing, the strong Ether advance, how the altcoins are moving ahead and the rest, it is easy to rationalize that the market will squeeze all the over-leveraged LONG traders. I will repeat myself again, this is a SHORT squeeze.
Let's wait and see. Prices are going up. 1 Billion in liquidations coming next.
Let the bears run. Let's us start a mini bull-run phase.
Namaste.

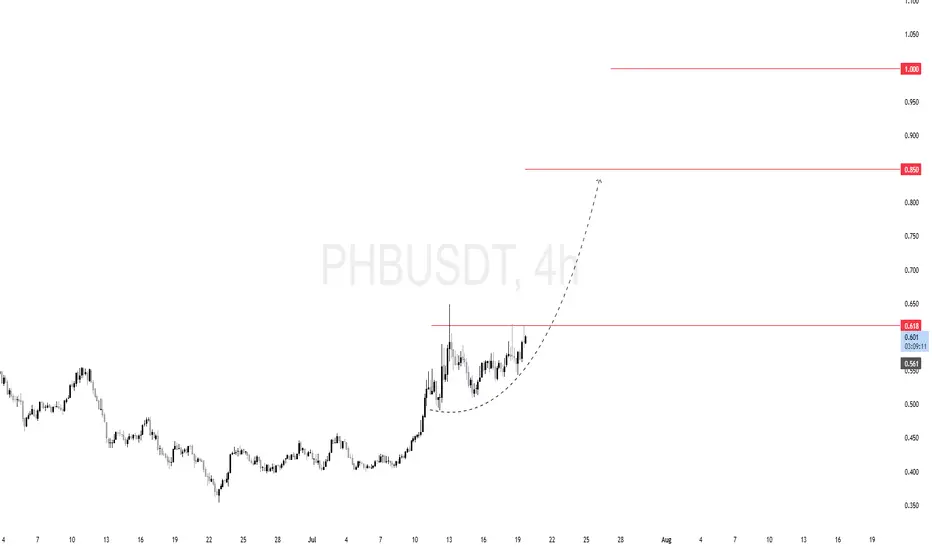
$PHB (PHBUSDT) 4HPrice spent several sessions consolidating below the $0.618 resistance zone. This horizontal level has been tested multiple times, building up buy-side liquidity above it.
We're seeing a rounded base formation — a classic bullish continuation pattern. It signals strong demand and positioning by smart money.
If $0.618 gets cleared with volume, we can anticipate rapid upside movement with the following key targets:
🎯 First target: $0.85
🎯 Final target: $1.00 (psychological level and historical supply)
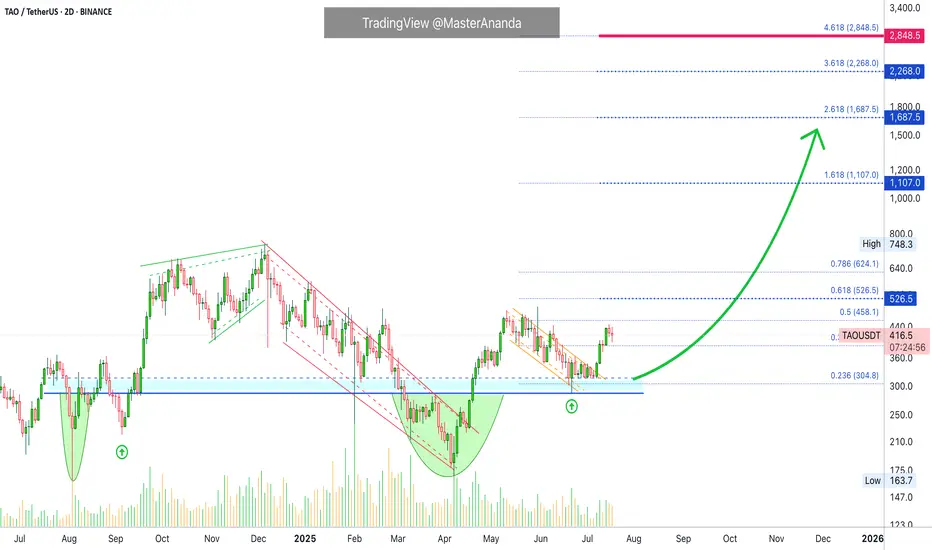
TAO's (Bittensor) True Potential Exposed · How About $3,000?Remember when I kept saying these are "conservative targets"? Why should we look for conservative targets when we know the market will do magic in the coming months? Why?
Let's focus more on realistic targets, optimistic targets, strong targets, good targets, successful targets; higher is better, less is not more.
We've been here many times before. I am happy and grateful to be able to count with your continued support. You can count with my analyses, great entry prices and timing. You can count with a unique market perspective 100% free of outside influences. I am not paid through USAID. 100% independent and everything you see is my mind, my soul, my heart and my spirit. It is my understanding of the market based on thousands of charts, thousands of publications, thousands of successful trades and more than a decade of experience. We are here to win and to trade. We trade to win, make no mistake.
Bittensor's (TAO) bottom is in, a long-term double-bottom; the beauty of TA.
A major low in August 2024. A new low in April 2025. The fact that these two happened at the same price is good news and it is already confirmed. Something as simple as the same level being hit twice helps us predict the future when it comes to the price of this, and others, trading pairs.
With the bottom in we can focus on growth. TAOUSDT is still early considering the bigger picture because the action is still happening below its May 2025 high. But conditions are good, very good I should say, because TAOUSDT is trading daily above EMA55, EMA89 and EMA233, a long-term moving average.
The break just happened days ago. If we are set to experience growth for 3-6 months, minimum, after this signal shows up, this opens the doors for prices much higher to what we've been considering in the past few months.
$1,100 is a good target but an easy hit. Only 30% higher compared to the last major high in December 2024.
$1,687 is the first strong resistance that TAO will face during its bull market bull-run. My bet is that it will break.
Going higher, we can see TAO trading at $2,268 later this year and even higher, just below 3K.
Now, this chart is very young so even while being optimistic we do not have enough data to project higher targets but there is no limit to how far-up a project can go during the price discovery phase. When we enter new all-time high territory and the final fifth (speculative) wave, all bets are off. You can aim for the moon or higher.
Namaste.
Avalanche's (AVAX) $229 & $363 Bull Market Potential ExposedStarting from the December 2020 low, Avalanche (AVAX) grew a total of 5,245% to its November 2021 all-time high. Now, if we take the true market bottom, when trading started back in September 2020 with a low of $0.85, total growth by the end of the bull market amounts to 17,152%.
It doesn't matter how you slice it, both are incredibly strong numbers.
Do you really think Avalanche will consolidate for years only to grow 500%, 600% in its bull market? I don't think so. This prolonged consolidation period was a test. Those that remained true to the market; those that continued to hold; those that continued to develop, to build and to grow within the market; all those people will be rewarded, big time.
Let's consider the true potential for AVAXUSDT in early 2026 or late 2025.
The main target is $229. I think missing a new all-time high is out of the question. We are going for the top as the market has been growing behind the scenes for so long. So much hard work has gone into making Cryptocurrency accessible to everybody and this hard work is about to pay off.
This $229 target opens up 880%. Keep in mind that this coming from current prices. If we were to consider the bear market bottom, this number would be much higher, something around 2,564%.
The next target, a "strong all-time high," is open at $363. This would give us a total profits potential of 1,450%.
As you can see, Avalanche is trading at bottom prices with plenty of room left available for growth. It is still very early if you focus on the long-term.
Thank you for reading.
Your support is appreciated.
Namaste.

Litecoin $1,000 (900%) ExplainedBack in 2020, just 210 days of consolidation led to a 1,623% strong bull market. How much different market conditions we have now. Since 2022, Litecoin has been consolidating. The length of this consolidation is now 1,127 days. More than five times the previous consolidation and then some.
How much higher can Litecoin go compared to a past period?
How much more growth can a project produce when it has been building strength for so long?
LTCUSDT is now trading weekly above EMA55. When this happened back in 2020, what followed was sustained growth. Straight up, literally, for a period of 203 days. No stops.
Back in 2020, Litecoin moved above EMA55 first in August just to be rejected. The second time was the good one. This year the situation is the exact same. Litecoin broke above EMA55 in May and was rejected. The second time is happening now in July and this is the good one.
Litecoin is also trading above MA200 fully confirmed and there is a golden cross between EMA55 and MA200. We are very close to a major marketwide bull-run.
$644 in this bullish cycle is a high probability target for Litecoin, but prices can go higher, much higher because market conditions continue to improve and institutions will gain access to Litecoin through Exchange-Trade Funds (ETFs). This means that a standard price projection would be a disservice to us. We are aiming for $1,000+ on this bullish cycle but it can end up closing higher of course.
After the new all-time high is hit, it is normal to see a correction or even a bear market. This one should be short and small compared to previous ones. See you at 1K.
Namaste.

BONKUSDT 1D Chart Analysis | Bullish Momentum is coming...BONKUSDT 1D Chart Analysis | Bullish Momentum Builds After 0.236 Fibo Pullback
🔍 Let’s break down the BONK/USDT daily chart, focusing on the latest price action, strategic moving averages, RSI convergence, and volume dynamics for a complete bullish scenario setup.
⏳ Daily Overview
BONK is showing strong upward momentum, printing consecutive higher highs (HH) in both candles and RSI—a clear bullish trend indicator. After an explosive move, price is currently staging a healthy pullback to the key 0.236 Fibonacci retracement level (0.00003142), which commonly acts as a support platform during aggressive uptrends.
📈 Technical Convergence and Trend Structure
- 3SMA Support: The 7, 25, and 99 SMAs are all trending upward and stacked correctly, with price sitting comfortably above them. The 7SMA acts as immediate dynamic support, reflecting trend strength and buyer interest at every dip.
- RSI Dynamics: RSI just bounced from the 69–70 zone, confirming convergence with price action. The indicator made its own higher high in tandem with the candles, and now, as price pulls back, RSI is reentering the overbought territory—which often precedes renewed momentum.
- Volume Confirmation: Notably, volume surged as the trend accelerated, and is now tapering off during this corrective phase. This is a classic bullish volume signature, showing profit-taking by early longs but no major selling pressure, suggesting trend continuation likely after consolidation.
🔺 Bullish Setup & Targets
- First target: 0.00005376 — retest of the last all-time high (ATH).
- Next resistance to watch: 0.00003920, followed by the ATH region.
- Long-term target: 0.00009710 — an upside of 170–180% from current levels, mapped by technical extension and price discovery zones.
📊 Key Highlights
- Price holding the 0.236 Fibo retracement signals a shallow, healthy correction.
- 3SMA alignment confirms long-term bullish bias—actively supporting every dip.
- RSI and price are convergent, reaffirming uptrend strength; RSI’s move back into overbought could ignite the next price surge.
- Volume decreasing on corrections and rising during rallies—bullish confirmation.
🚨 Conclusion
BONK/USDT remains technically poised for further upside. The blend of higher highs, support at the 0.236 Fibonacci retracement, positive 3SMA structure, and RSI convergence all point to bullish continuation. Watch for renewed momentum as RSI reenters overbought territory and volume confirms the next breakout. Next targets: 0.00005376 (ATH), with a long-term projection toward 0.00009710.

Drop Your Token – I’ll Do The AnalysisHey everyone! Hope you’re having an amazing weekend !
Want me to analyze your favorite token ? Just drop your request in the comments using this format:
Request Format
Project Name: Bitcoin
Token Symbol: BTC( BINANCE:BTCUSDT )
Important Notes:
I’ll pick and analyze only the first 10 tokens requested .
One request per person — so choose wisely!
I’ll reply directly under your comment with the analysis.
If you find this helpful, don’t forget to Like ❤️ and Share this post with your friends!
Here’s to your success — health, wealth, and great trades! 🚀

Sushi Turns Bullish, Major Support Zone Left Behind · $105 Next?A major support zone from November 2020 has been left behind. The launch pad for Sushi's previous bull market. Let me explain.
Right after SUSHIUSDT became available for trading late August 2020 it started a strong decline. This decline found support at a low point November 2020. To this day, this low remains the strongest and most important support for this pair and it has never been broken on a weekly close, not even once. The level was tested three times: In 2025, 2024 and 2023 and each time it gets tested a bullish wave develops.
From November 2020 through March 2021, 126 days, SUSHIUSDT went ultra-bullish, total growth amounting to 4,864%.
The bullish waves in late 2023 and 2024 were something minimal, whales buying nothing more as there was no continuation. The situation is different today.
Sushi has been accumulating for years and is ready for a full-blown bull market. This week it started trading above EMA55 on a full green candle, coupled with really high volume. This is it, the major bull market cycle and wave. It ends in a bull-run phase.
The November 2020 support is now being left behind. Sushi is preparing and has the possibility of hitting a new all-time high in late 2025. It can happen that the action goes beyond this year and into 2026.
Some pairs can produce an entire bull market bullish wave in 3-4 months. Other pairs can do so in 6 months exact. Some others go for longer and last 8 months while a different set can take 12 months or more. Some pairs have been in bull market territory (higher highs and higher lows) for years... Let's hope the entire market decides to produce long-term growth.
The low in June this year is a higher low compared to April. Here you can see the market variations. Some pairs produced lower lows and others, like this one, produced a higher low. Lower low or higher low makes no difference when it comes to the bigger picture, this is simply a technicality.
We are now entering a massive, marketwide bullish phase. You just need to be prepared for what is coming because this will be the opportunity of a lifetime. While there will always be new bear markets and bull markets, the prices we are seeing now will be forever gone. Crypto will grow so fast and so strong, that the next correction bottom will be really high compared to the most recent major low. Cryptocurrency is going mainstream and is here to stay for the long haul.
Namaste.

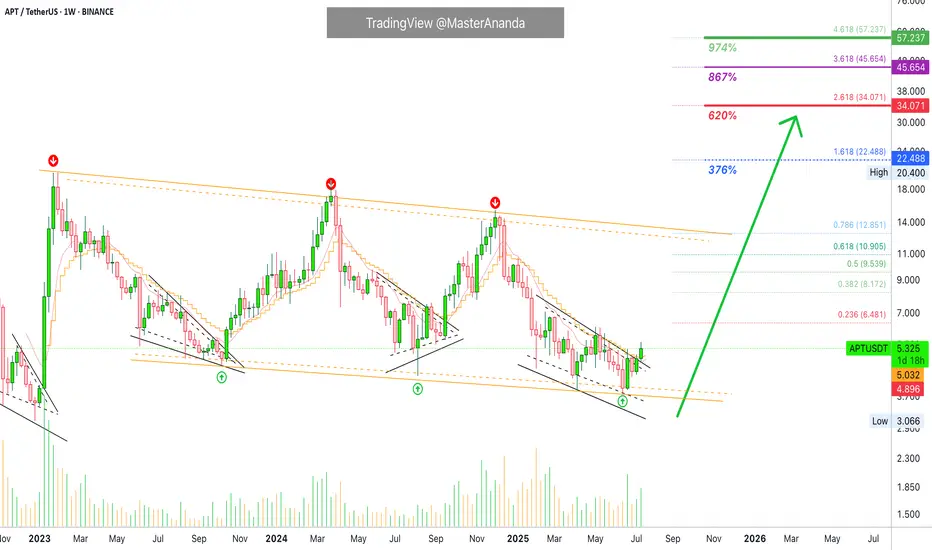
Aptos Bullish Bias Intensifies · Moving Above 2 EMAs WeeklyLast week APTUSDT (Aptos) closed above EMA8 and this week it is trading, and set to close, above EMA13. The bullish bias is becoming stronger; notice the bullish reversal pattern in black. Each time this type of pattern showed up Aptos turned bullish. This is the fourth time and it won't be different. It will be different only in the sense that the long-term consolidation descending channel will break. Instead of resistance being found and confirmed at the upper-boundary of the channel, APTUSDT will produce a new high, a higher high and a new all-time high. You are witnessing the start of the 2025 bull market cycle. Growth potential goes beyond 800%. Total growth from bottom to top can reach 1,000% or more.
Thank you for reading.
Namaste.
Ethereum · No Reason To Stop · Will Continue RisingEthereum will continue rising. Remember Ether is number two and it is awesome, to start, and it follows Bitcoin like darkness follows the light. There is no reason for Ether to move down. There is no necessity for ETH to stop its major advance, in fact, it has been lagging behind and it needs to catch up. Bitcoin is waiting and will continue waiting but it won't wait forever so Ethereum must wake up and is waking up. We are going up.
Ethereum has grown 165% since its 7-April low. This is more than XRP and its capital is twice as much. Boom! The best part? Ethereum will continue growing straight up for weeks and months. It needs to be trading at a new all-time high as soon as possible just so that the market can feel at ease and know, once again, that Crypto is here to stay.
What has been suppressed can't stay suppressed forever. Crypto went through a fight but challenges only made us that much stronger. We are now happy and grateful for everything that we went through because we know that we can take anything the world throws at us.
The chart. Green, green, green straight up. Two months of consolidation. That's the key. ETHUSDT went sideways for almost two months and this reveals what comes next. The advance outside the consolidation range has been happening for 8 days. 60 days of sideways can support at least an entire month of growth. When the entire month is consumed, we can expect a retrace, nothing more, followed by additional growth.
In short, Ethereum will continue rising. If you see a shakeout, know that growth will always resume in a matter of days. If you see a drop, know that this is a bear-trap, the bulls now own the game. If you are in doubt, come read my articles and I will publish something that you will understand and agree is right, so you can continue holding until you can reach the big prize.
The time to sell will come, but it isn't now. Right now is the time to hold strong. Not only Ethereum, but Cardano, XRP, BTC, Dogecoin, Solana and the rest of the altcoins. This is only the start.
I expect Ether will continue rising. $8,000 now looks like such an easy target...
Very good indeed. If you enjoy the content, follow me.
Namaste.

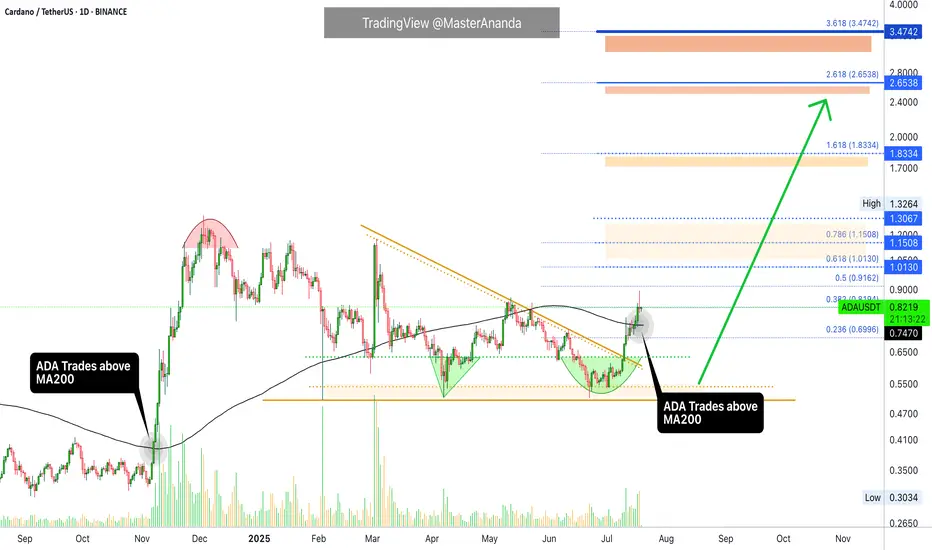
Cardano Update · What Happens Now?I am going to assume that you read the XRP update I just published. While these are different pairs, my updates and publications are all related because I look at the entire market—for you—as a unit.
The situation with Cardano is different to XRP. Why? Because XRP already broke its previous bullish wave high while Cardano hasn't. This first tells us that Cardano has more room for growth and has less risk from a buyers standpoint. It can also be seen as Cardano being weaker or lagging behind in someway but I wouldn't give credit to this interpretation. The truth is that the market moves in unison but not at the exact same time.
May's high, reached first from the 7-April bottom, has been challenged but confirmed as resistance. This won't last long. It has been confirmed as resistance and we can easily see it by yesterday's red candle. This is normal. If you look at 14-July and 12-July, these days were also red yet Cardano continued growing. You can expect the same.
We can have one day red, two red days, three red days and nothing changes. The market is set to grow, is growing and will continue to grow in the coming weeks and months. Long-term growth and even beyond months. There is the possibility of growth extending to years similar to Bitcoin.
When a huge wave develops, we get a half year strong correction, a major higher low compared to the start of the phase followed by additional growth.
Let's get back to today and what is happening now.
ADAUSDT managed to break above MA200 16-July, just three days ago. This confirms a long-term growth process; it is now confirmed. This means that Cardano is on track to grow for 3-6 months minimum.
What we are seeing now is only the start of a major advance and the continuation—on a long-term basis—of the move that started in late 2024.
You can rest easy, sleep easy while you watch your profits grow. Cardano will continue growing, it will do great; you have my word.
Thank you for reading.
If you enjoy the content leave a comment just for this one, I will be sharing updates for you now, today, yesterday, tomorrow and for years to come.
Namaste.
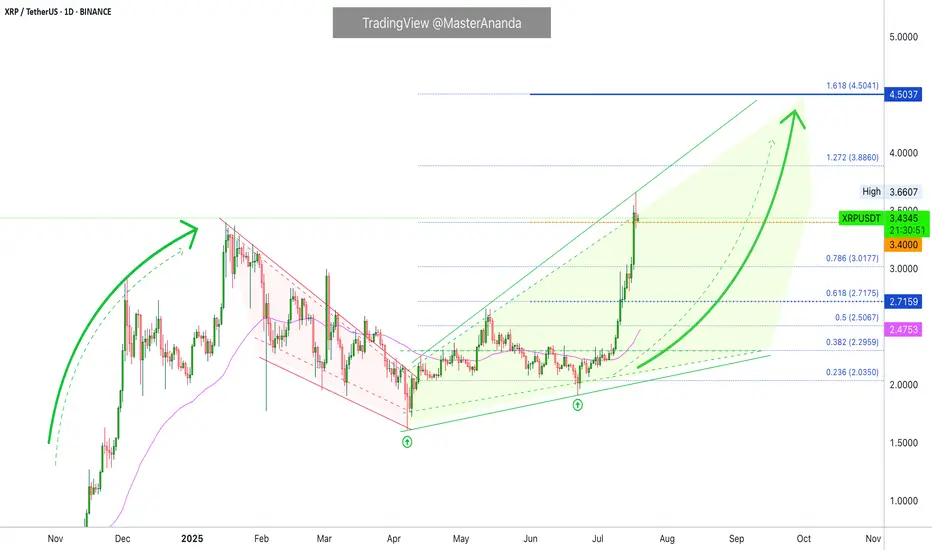
XRP Update · What To Expect Short-Term (Now!)XRP just hit a new all-time high and this is truly awesome if you hold this pair, if you were bullish before the breakout, if you bought LONG, etc. It is also good if you are an analyst looking for clues that will tell you what will happen to the Cryptocurrency market in the near future.
Remember that XRP moved early to start this cycle and it moved strongly. Right now, it is moving early and strongly again in comparison to many other pairs. This tells us that the rest of the market will follow.
I saw very strong bullish action across many pairs but I also saw many pairs staying behind; below their April's high. Now, what happens next?
XRPUSDT made a stop after moving beyond its 16-January 2025 high. This is pretty normal behavior. After a strong rise, there is always a stop, retrace or correction. We do not expect a correction to develop now because the consolidation period was very long, strong and prolonged. So we don't have to worry about that one.
A retrace is possible but having one would be small and short-lived. Finally, a pause is the most likely scenario. A pause can range between 3-9 days. That is, that amount of time before additional growth.
The final possibility is the market moving straight up. Since we have a 126% rise since the 7-April low, we don't give much credit to this scenario. The top choice is a small pause before additional growth. The important part is "additional growth." This is what will happen. This is what comes next. XRP will continue growing. Boost if you agree.
Namaste.
Synapse Short-Term Trade, To Move Next · 309% Profits PotentialLet me give you another pair that is ready to move, just in case you want to make some quick profits for the weekend (next weekend).
Good evening my fellow Cryptocurrency trader, how are you feeling in this wonderful day?
Everything we were expecting is now becoming all true. The altcoins market is bullish and moving up. We have long-term and short-term charts. Here you have a little bit of both.
Synapse will grow long-term of course, but we will focus on a sudden jump that will be happening next. Can be tomorrow, in a few days or a week or so maximum. The chart is bullish now.
Many pairs are moving past their April's high, I take this as a very strong bullish signal. Many pairs are still trading below. I take this also as an opportunity, it means that we can buy them before the breakout and enjoy fast, easy growth. The choice is yours.
Trading above EMA8/13/21/34.
Yesterday's candle is interesting and the really high volume 8-July. Remember, high volume at low prices with marketwide bullish action and you need no more. We are bullish, bullish now, bullish later—may profits come. Thanks a lot for your continued support.
309% potential profits is the next high. A minor stop and then higher.
You can cap your earnings even sooner at 124%, 226% or wait for the full 300%. Whatever you choose is up to you. Easy win with low risk when trading spot; you can't go wrong.
Thanks a lot for the follow, the trust and your continued support.
-----
The chart also shows a rounded bottom as a lower low. The lower low is a bullish signal because all weak hands were removed. When support is pierced on a broader bullish bias this is bullish. The action is happening back above the 7-April low and this works as confirmation of the move that I am predicting now. The pierce of support is not a bearish impulse/wave but rather a stop-loss hunt event.
Namaste.

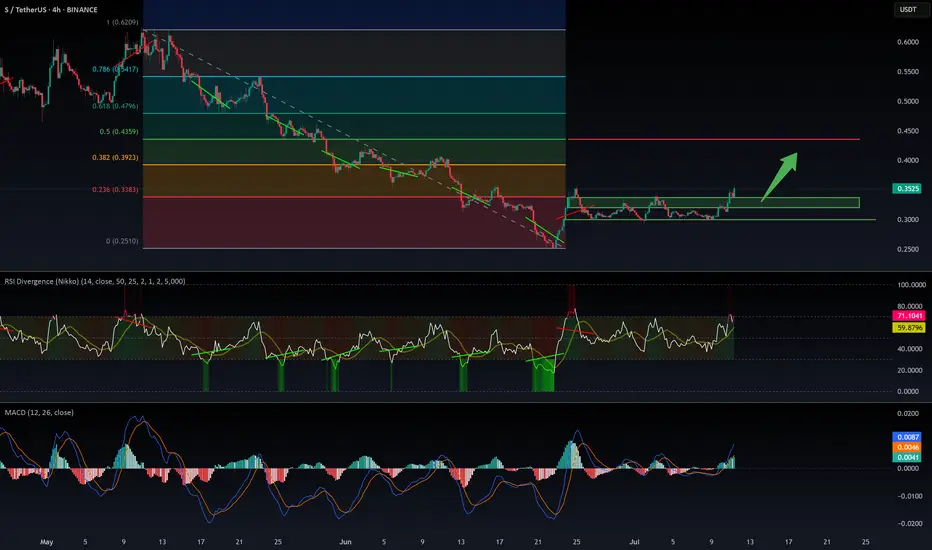
$SUSDT (or S , ex FANTOM): good entry for a long setupCrypto Market Outlook
The overall crypto market is in a clear uptrend.
The money printer is running, and USD dominance is dropping — all signs pointing to a potential continuation of the rally in the coming months.
Unless a black swan event hits, it's not too late to position yourself if you’re still on the sidelines.
⚠️ Always manage your risk with a proper stop loss — altcoins move fast and can reverse just as quickly.
One interesting setup: $S
✅ Relatively new
✅ Didn’t pump too hard
✅ Broke out of its downtrend
✅ Found solid support
The Fib levels offer good targets for take profit zones.
🔍 Ideal entry: within the green box or lower.
Let the pump cool off — it could offer a perfect entry opportunity. Be patient and wait for a good position.
If $S pumps from here without retrace:
→ Jump in with a tight stop loss
→ Or look elsewhere for a better risk/reward setup.
DYOR.
#Crypto #Altcoins #Bitcoin #ETH #Trading #CryptoMarket #TechnicalAnalysis #RiskManagement #DYOR
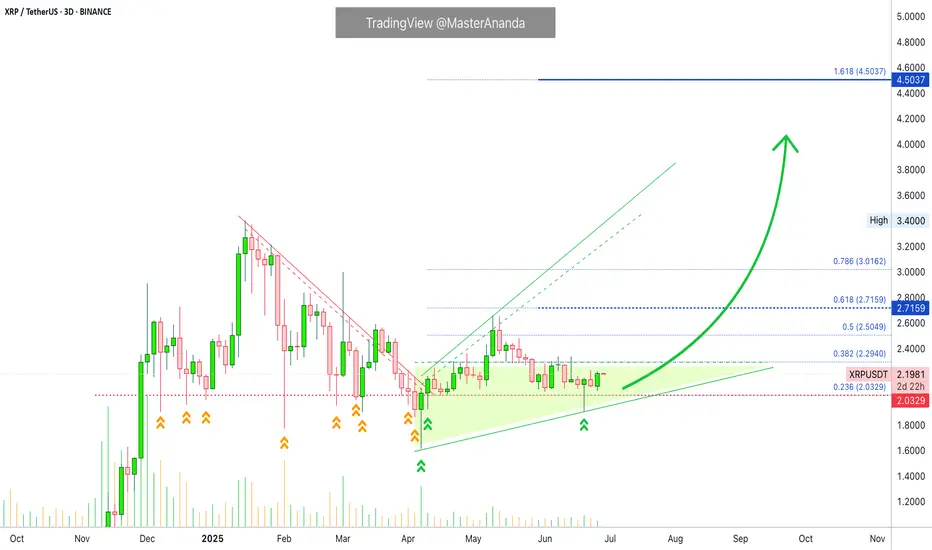
XRP Support Holds After Being Tested 12 Times...Everything below $2 is quickly bought. No crash is good news. Not having bearish action and bearish follow up on sellers pressure is bullish. XRP is bullish and has been consolidating for months. The longer XRP trades above $2, the stronger will be the bullish wave that follows. We are getting very close.
Good evening (morning) my fellow Cryptocurrency trader, I hope you are having a nice day.
The same level has been tested over and over and over since December 2024 and it continues to hold. XRP managed to wick below $2 more than twelve times, this support continues to hold. When prices move lower, buyers quickly show up.
Look at this, before 7-April XRP was moving below $2 very often. After 7-April, only twice. Big difference. This reveals a bullish bias. When the market was bearish, this support was tested more often than not. As soon as XRP turned bullish, it was tested only once recently and once after the 7-April bottom.
This little dynamic here shows that the bulls have the upper-hand and this is all we need to know. Knowing that the bulls have the advantage, when the market breaks it is going to break up. A bullish continuation. It is confirmed and it is only a matter of time.
How long? Only the market knows but it is not far away. The longer it takes, the stronger the bullish wave that follows. Strong growth is likely to develop within days.
Namaste.
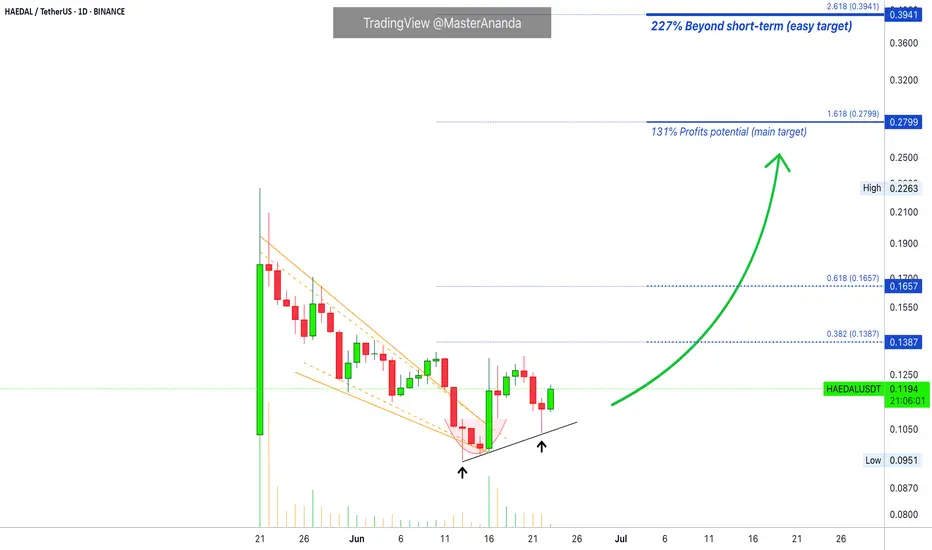
Haedal Protocol: Trading Young Charts Short-Term (~125% Profits)Remember the "young charts"?
"Not enough data."
We now trade the young charts as well but always keep it short-term. Our aim is a maximum of 130-120%.
Here I show higher targets but normally that's the range. We go for 10% the first target, more or less, to 120-150% the last target.
And of course, short-term for us means one month (30 days). For some people and trading styles this is a very long time and I understand.
Technical analysis HAEDALUSDT
» We have the falling wedge pattern. Automatically when the action breaks out of this pattern we have also a broken downtrend and downtrend line.
» Here we have a rounded bottom, a higher low and a bullish hammer candlestick.
» 16-June produced the highest volume and this day marks the end of the downtrend and bullish breakout from the falling wedge.
All these are bullish signal. We are aiming up while aiming higher. Higher high, higher heights, new all-time high and beyond in the coming weeks and months.
Namaste.
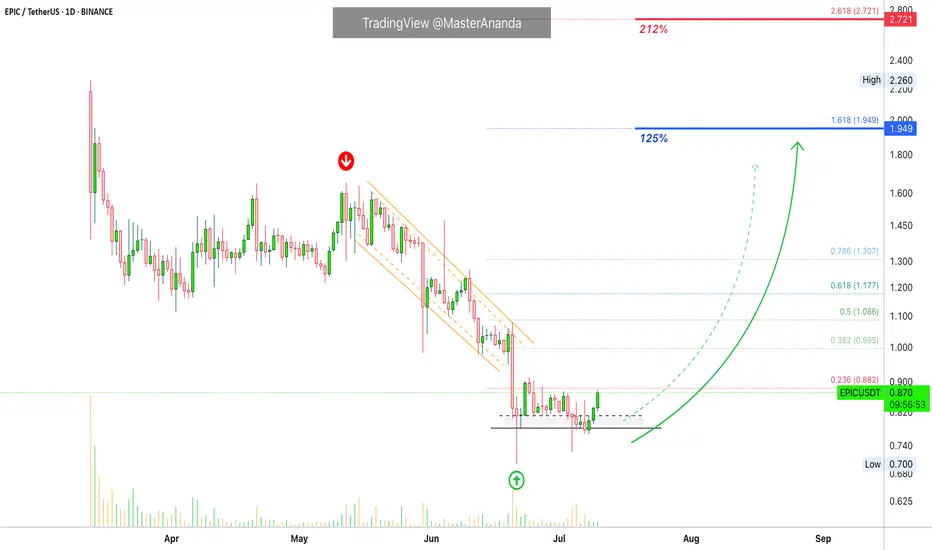
Epic Chain 212% Move Mapped —The 2025 Altcoins Bull MarketThe altcoins market bull market is fully confirmed and this confirmation comes as soon as Bitcoin hit a new all-time high. When Bitcoin is strong, bullish yet sideways, the altcoins market tend to grow. The altcoins are growing now, some pairs growing three digits within hours and that's because Bitcoin continues to consolidate near resistance. This same dynamic will only strengthen and is set to continue for months.
Epic Chain (EPICUSDT) already hit bottom and is ready to grow. Here we have a very easy 125% target, a fast, strong and easy bullish wave. It is likely to go way beyond this target but this is based on the short-term. It will go beyond because the altcoins are producing over 50% in their first hour or two of the initial bullish breakout. More than 100% within days and the potential for the entire bull market will be 20-30X on average.
You've been warned. This is a friendly reminder.
Prepare and maximize profits. Do whatever it is necessary to make the most of this opportunity, it only happens once every four years. This is the 2025 bull market bullish momentum building up. Just as promised. You will be happy with the results.
Namaste.
SOL/USDT Technical Outlook – Breakout Holding, Eyes on 175+Solana has successfully broken above the key resistance zone at $155–157 and is currently testing it as new support. If the level holds, this breakout could extend toward the next major target around $175–178.
📌 Key Insights:
Clean breakout followed by a potential SR flip
Watch for confirmation of support before continuation
Target aligns with previous swing high
Invalidated on breakdown below reclaimed level
🟢 Bias remains bullish as long as price holds above the breakout zone. A confirmed retest could provide a high-probability long setup.

Wings of Opportunity: LINK’s Harmonic Setup Unfolding🦋 Title: A Butterfly on the Edge – But Only with Confirmation
On the 2H timeframe, a Bullish Butterfly Harmonic Pattern is unfolding. The wave structure (X → A → B → C → D) aligns closely with harmonic principles, and point D lies above X, within the 1.27 to 1.618 Fibonacci extension of XA — reinforcing the pattern’s validity.
📌 No entry has been triggered yet.
We are currently waiting for price to break and hold above the key resistance at 13.60 to confirm the bullish scenario.
🔹 Bullish Scenario (our primary and preferred outlook):
Given the strong reaction around the 12.74 demand zone and the harmonic structure completion, we are primarily focused on a long opportunity, if and only if confirmation is achieved above 13.60.
📥 Entry Zone: 13.05 – 13.65
🎯 Target 1: 17.94
🎯 Target 2: 18.76
🛑 Stop-Loss: Below 12.74 (structural invalidation)
🔻 Alternative Bearish Scenario:
If price fails to break 13.60 and instead loses the 12.74 support, the bullish setup becomes invalid, and the market could enter a deeper correction phase.
Potential downside targets in that case:
📉 11.80
📉 10.90 – 10.30 (if bearish momentum continues)
📊 Risk Management Notes:
Position sizing should not exceed 1% of total capital
Avoid early entries before confirmation
Prefer partial entries after breakout and retest
Stick to the invalidation level strictly
📈 While both scenarios are on the table, we are currently favoring the bullish setup, as long as price action supports it. Discipline and patience are key — confirmation first, trade second.
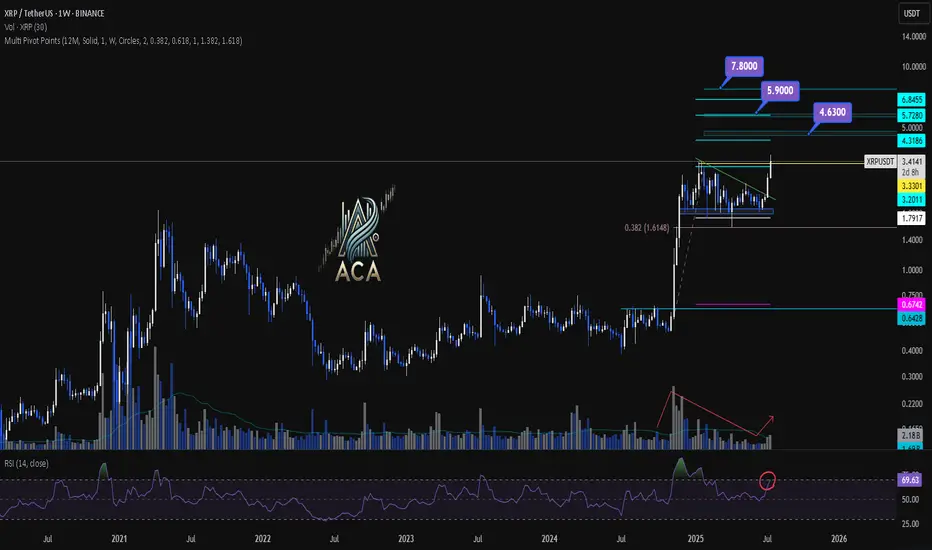
XRPUSDT Weekly Chart Analysis | Next Bullish MoveXRPUSDT Weekly Chart Analysis | Major Resistance Levels Align for Next Bullish Move
🔍 Let’s break down the XRP/USDT weekly setup, highlighting key technical signals and major upside targets for the next rally.
⏳ Weekly Overview
The weekly chart shows consolidation just below a major resistance, with price action tightening and preparing for a breakout. A recent correction found support near the 0.382 Fibonacci retracement level, which has acted as a springboard for renewed momentum. Notably, the R2 pivot point level aligns closely with this area, strengthening its importance as a decision zone for bulls.
🔺 Upside Targets & Confluences:
- First Target: $4.63 — This coincides with the R2 monthly pivot point and aligns with key Fibonacci extension targets, offering strong confluence for a reaction zone.
- Second Target: $5.90 — Our most realistic medium-term target, also backed by cluster resistance from both pivot analysis and fib projections.
- Final Target: $7.80 — This is the major Fibonacci extension level, marking the highest projected upside if momentum persists.
📊 Key Technical Highlights:
- Pivot Point R2 & Fibonacci Confluence: The R2 level reinforces a critical resistance, overlapping with the $4.63 Fibonacci target.
- Fibonacci Retracement: Price respected the 0.382 retracement during the latest correction, signaling healthy trend continuation.
- Volume Confirmation: An uptick in volume confirms that buyers are stepping in, supporting the bullish momentum.
- RSI Signal: RSI is entering the overbought zone, which typically indicates a strong surge in buying pressure and can mark the start of a momentum move.
🚨 Conclusion:
XRP is setting up for a major breakout as key technical levels align. Watch for a sustained move above $4.63 to unlock the $5.90 area, with a final potential push towards $7.80 if bulls maintain control. Volume expansion and an overheated RSI are both classic signs of an incoming momentum wave—keep your eyes on these levels for validation of the setup.
ETH 1D Overview Finally we are seeing altcoins regaining lost ground on Bitcoin and the second largest crypto by market cap is rallying strong.
Since ETH has such strength currently the opportunity to short is quite slim with high risk, however I think it's important to see where ETH may find some resistance or if a pullback was to happen, where would it come from?
The first level is the bearish orderblock level that has just been tapped as of writing. This area previously began the sell-off at the end of 2024 by confirming a new lower high. Naturally this area will present problems for the bulls and so a potential pullback could be initiated from this level. I would like to see a sweep of the stop loss positions just above the area and then a SFP to confirm the pullback is in motion.
Should the bearish orderblock fail the next clear level is the daily local top around $4000. A big even level and the area that started 5 months of downtrend. IMO the most likely level where longs will take profit. I do think if we see any form of consolidation between the bearish orderblock and the local high the bulls will look to carry the rally on, shallow pullbacks maintain momentum
Ten out of the last eleven days have been green candles with the only one day being red just above a key high, I expect if we are to get a pullback that bullish orderblock area ($2900-3000) to be retested as support. Therefor if any of the above areas initiate a pullback this area should provide support and therefor a long entry.
To clarify I am in no way bearish about Ethereum, this is just a plan for different eventualities.
