3/ Altseason: Live - My System: Cut Losses, Let Profits RunIntroduction: The Whole Truth About Trading
The "Altseason: Live" experiment is in full swing. Before we continue, I want to show you something important. Not just the wins, but the complete picture.
This is real trading. With big wins and unavoidable losses. And this single screenshot contains my entire philosophy.
My Core Strategy: Cut Your Losses, Let Your Profits Run
My main job as a trader comes down to two simple rules:
Hold my winning positions for as long as possible.
Cut my losing positions as quickly as possible.
Look at the screenshot again. The losing trades on SAGA (-90) and PUMP(−595) were closed fast.
The moment I realized the setup wasn't working, I got out. No hope, no emotions. This is the cost of doing business.
Now, look at MAV (+4,302) and RONIN(+3,254)
I let them run because they were following the plan. These two trades brought in +$7,556 in profit, more than covering all the small losses and securing a great overall result. This is how the system works.
The Winner's Psychology: The Battle with Euphoria
After a series like this, it's easy to get a "winner's high" and believe you're invincible. That's a trap. That's why, after the first wins, I deliberately cut my position size for the next trades by four times. To tame that euphoria and remember that discipline is more important than overconfidence.
My main principle remains : Fear losing more than you fear missing out.
The Hunt Continues: The Current Position
This system isn't a theory from the past. It's working right now. As of this moment, I have one open position in :
GETTEX:WOO , which is already showing over 2121 in unrealized profit.
I plan to manage this trade by the same rules and will likely close it within the next 1-3 days.
What's Next?
I'm not looking for dozens of trades. I'm looking for a few high-quality setups where I can apply my system. I use limit orders to enter on pullbacks, and I always use a stop-loss.
The experiment continues. You can follow it all in real-time on my streams, where I broadcast my trading terminal.
Thank you for your attention. The hunt for Trade #3 has already begun.
Best regards EXCAVO
Altcoins

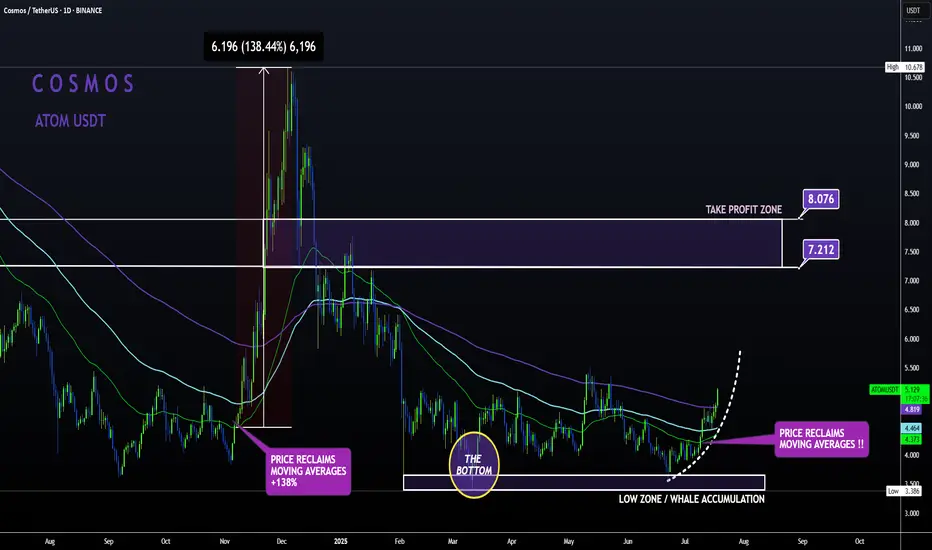
ATOM Sleeping GIANT ALT | Moving Averages BULLISH like NOV24'ATOM is slowly but surely making a turn up towards the first Take Profit point.
From the bottom, Cosmos has already increased a whopping 52% , with even more room to grow:
In my previous update, the 4 was still bearish when looking at trend lines and moving averages.
However, this has flipped to bullish from the 4h upward, with the price trading high above the moving averages in the 4h and in the daily timeframe:
4H:
Daily:
Note how previously, the big increases started as soon as the price regained the moving averages as support.
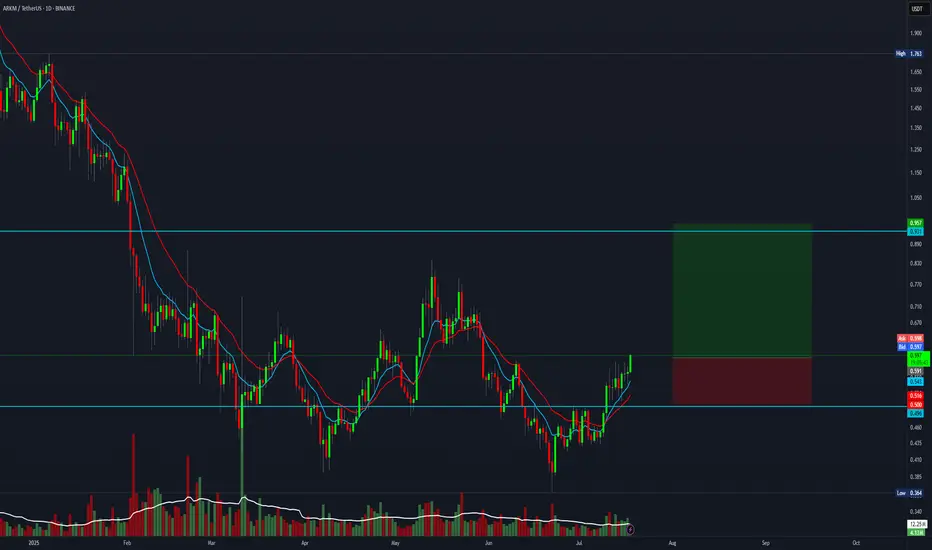
4:1 R:R trade setup for ARKMEverything is pumping right now, and this one also offers a 4:1 R:R setup.
Entry: 0.596
Stop Loss: 0.500
Target: 0.950
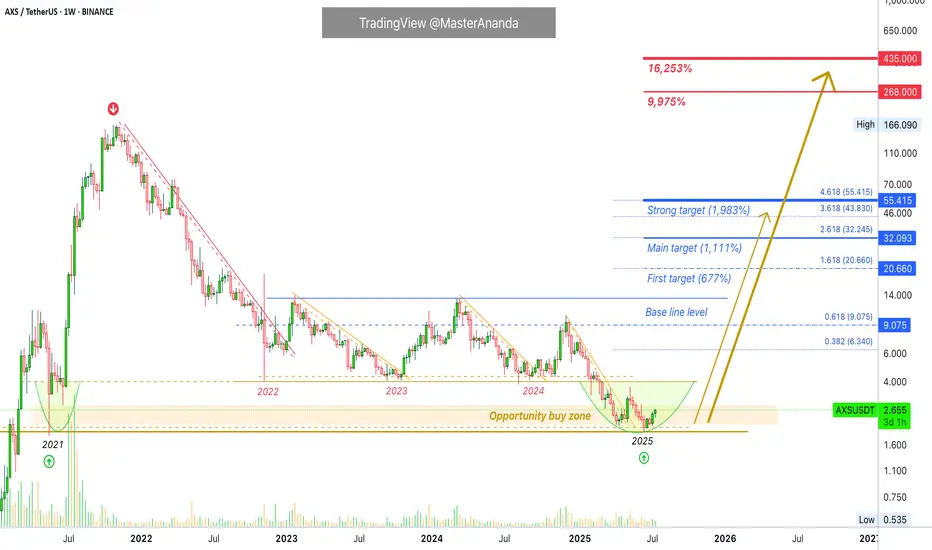
Axie Infinity Trades Within Opportunity Buy Zone · (PP: 16,253%)Right now Axie Infinity is trading within the "opportunity buy zone," this is a level just below the support zone from 2024, 2023 and 2022. It is trading in this zone searching for liquidity. Once this move is over, AXSUSDT will never be available at these prices in the future. The lowest will be the long-term support zone from 2022-2024.
Can Axie Infinity hit a new all-time high in 2025 or 2026? It is possible. But, in this chart setup and analysis we are focusing on high probability conservative targets.
"Back to baseline" is the very easy target. The first target after that sits around $20 for 677%. The main target goes higher, $32 for 1,111%. A strong target is $55 and this one opens up 1,983% profits potential.
A new all-time high can be $268 & $435. Really huge numbers. Just to give you an idea, the second one would be equal to 16,253% profits potential. The first one, $268 would be equal to 9,975%. This is theoretically possible so I don't want to commit to it but is good to keep an open mind with market conditions improving at the speed of light. If we can say there is such a thing.
Technical analysis
The bottom in 2025 matches the mid-way stop of the 2021 bull market. So this is an interesting and valid zone for a reversal.
We don't need to go any deeper in looking for reversal signals because a marketwide bullish bias is already confirmed. We've been bullish since 7-April 2025. Some pairs move first others later though and that's why some are already very high while others are very low. This is good because it gives us time to adapt to the market. If everything were to move together at the same time on the same date, it would be too late to buy anything low. Because the market cycles through different sectors, groups and pairs, we can buy the ones that are low now knowing that they will eventually move ahead. Everything grows. Everything will grow. The 2025 bull market is already confirmed.
Thanks a lot for your continued support.
Namaste.
SOLANA SOL 1WThis coin is showing very interesting development, and the market maker seems to be painting clear structural patterns.
🔷 Macro Structure: Rising Triangle
On the higher timeframes, we can clearly see a rising triangle formation taking shape. If this pattern breaks out to the upside, the potential measured move suggests a target of up to ~2,500% from current levels.
📊 Chart Overview
Wide zones = key support and resistance
Former resistance often becomes support after a breakout
All target levels and zones are clearly marked on the chart
⚠️ Risk Warning & Realistic Scenario
Be mindful of market behavior:
Often before a bullish breakout, we see a fake breakdown — a trap to liquidate early longs — followed by a return into the triangle and a strong move upward. Don’t rush. Let the pattern confirm itself.
💡 Plan Accordingly
If you're already in, consider protecting your position with a stop-loss
Don’t overleverage, and take profit partially on strong levels

Altcoin Market Structure Outlook | ETH/BTC Rotation AnalysisThis chart outlines a cyclical framework I'm using to anticipate a potential bottom in altcoins heading into Q4. Currently, ETH is outperforming BTC, and altcoins are following its momentum - though many continue to make lower lows relative to ETH.D but as long as eth rallies I see Alts keeping up.
Historically, we've seen altcoin capitulation phases follow a two-stage structure: an initial local bottom in June/July, followed by a final sweep or structural low into October (Q4), as observed in both 2023 and 2024. Given this repeating seasonal pattern, I expect ETH to potentially retrace against BTC in Q4 making a higher low, which could set the stage for altcoins to make a lower low and retest their key range lows — particularly near the 0.25 ETH/BTC level.
Should ETH maintain a higher low and resume trend afterward, it would likely mark a rotation point where capital begins flowing into higher-beta altcoins. Coupled with potential macro tailwinds like rate cuts or dovish policy pivots, this scenario could trigger a strong altcoin rally from Q4 into Q1.
This chart aims to visualize that rotational capital flow and position sizing opportunity across the cycle.
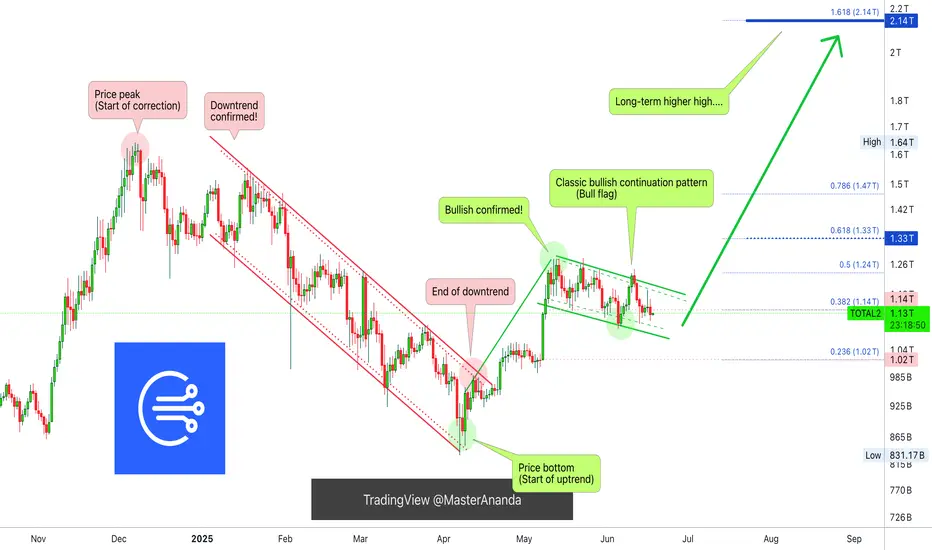
The Correction Is Over! Bull FlagThe bull flag is a popular pattern. Everybody who has seen a chart is familiar with this pattern. It is a continuation pattern.
When I say that the correction is over I am not talking about the short short-term, I am talking about the bigger picture.
Yes, bullish action is expected to start and intensify within weeks, no!, days. But still, with thousands of projects, it takes lots of time before energy (money) reaches all sectors of the market. Allow for strong variations but the correction is over which means growth.
The correction is over means that the low is already in for most pairs and will be in, in the coming days for all remaining pairs.
The correction is over means that everything will grow, just as it did after the 7-April bottom low. The difference is that this new wave will be many times bigger and stronger than before.
TOTAL2 produced an advance from early April until late May. The retrace produced a bull flag continuation pattern. The pattern has run its course, it will resolve with a new phase of growth. It won't take long. It will be obvious in a matter of days. No need to pray, Crypto is going up.
Namaste.
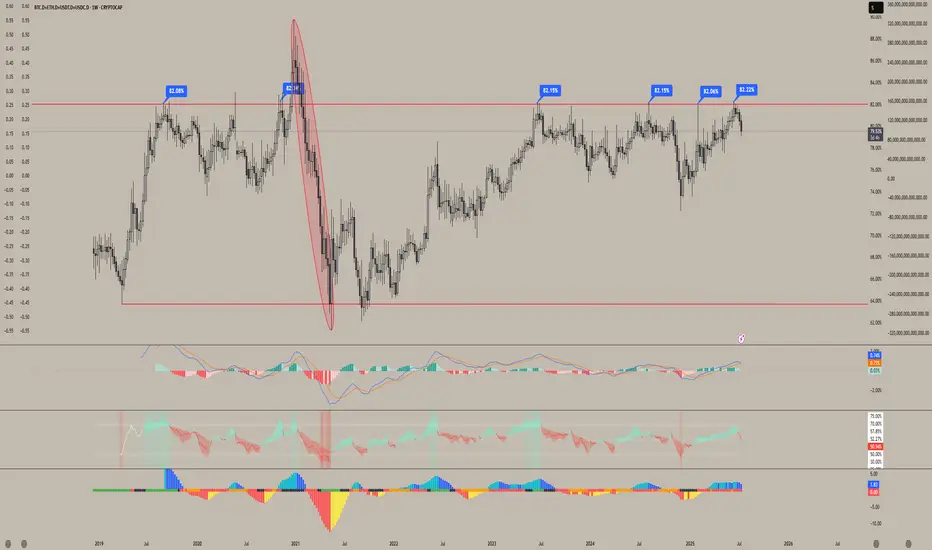
When will Altseason start?So with ETH.D sweeping its all time low I feel very confident that eth has made the low for this cycle as well as BTC.D retracing providing further confluence that this is the case and we will see eth start to outperform bitcoin but I begun to question where altcoins stand currently stand and when we will start to see them outperform both BTC and ETH as they currently bleed to them as Both ETH and BTC make higher lows while altcoin pairs are making lower lows. I feel like until we see a run above this trend line above the .82 lvl we will see altcoins bleed against ETH and BTC.
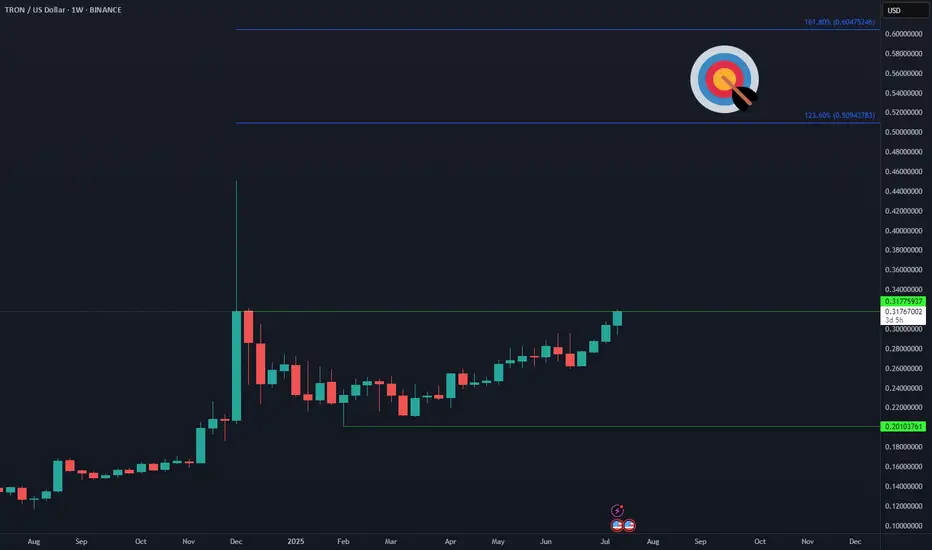
TRON TRX Eying New ATH📈 After 6 months of sideways accumulation, CRYPTOCAP:TRX is finally picking up momentum. A weekly close above $0.317 could trigger acceleration toward the next targets at $0.50–$0.60 🚀
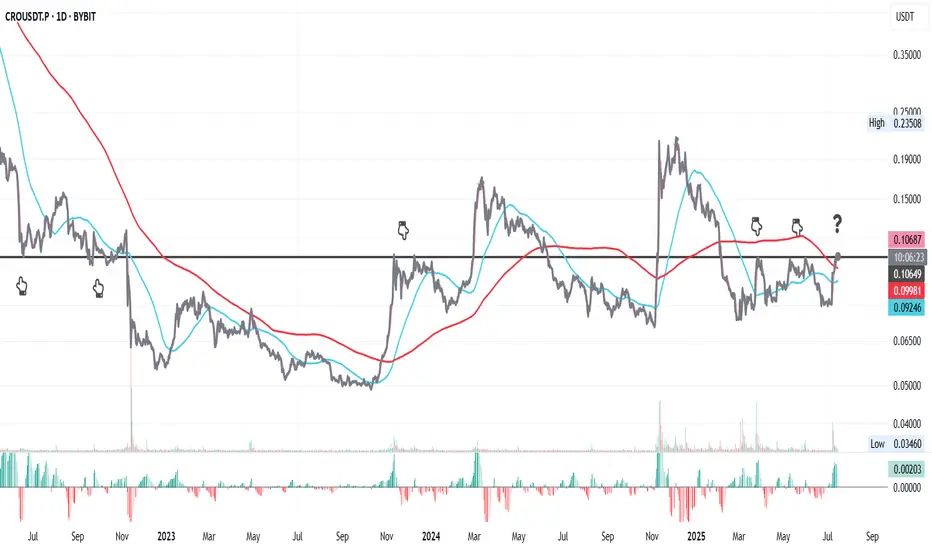
CRO at a Turning Point ?This is CRO on the daily chart.
Price has interacted multiple times with the key resistance at **0.10649** (black line). It’s now testing that level again, and there's a real possibility it flips it into support.
On top of that, CRO is attempting to reclaim the 200MA, while the 50MA is starting to flatten out—potential signs of a longer-term shift.
That said, this process might take some time and could be volatile. CRO’s relatively small market cap of \$3.33B and this week’s major macro events (starting today with CPI) could add pressure in both directions.
Always take profits and manage risk.
Interaction is welcome.
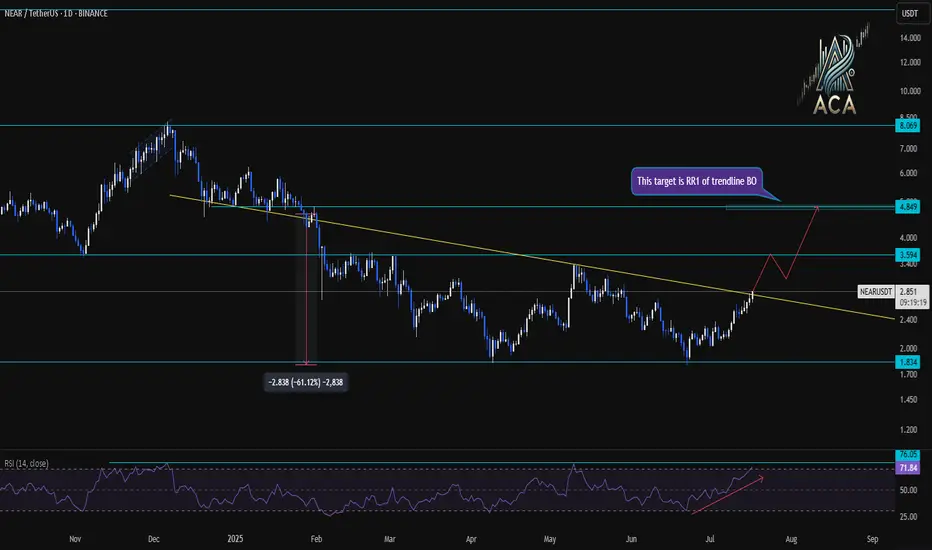
NEARUSDT Daily Chart Analysis|Strong Breakout & RSI ConfirmationNEARUSDT Daily Chart Analysis | Strong Breakout & RSI Confirmation
🔍 Let’s break down the latest NEAR/USDT daily chart, spotlighting critical resistance, target levels, and momentum signals.
⏳ Daily Overview
NEAR has confirmed a bullish breakout above its long-term descending trendline. This move comes with a surge in price and a strong daily candle—clear evidence of renewed bullish momentum.
📊 Momentum & RSI
RSI has surged to 76 (overbought zone), higher than the typical overbought level of 70. This spike reflects strong buying pressure, but also signals the possibility of near-term pullback or consolidation.
RSI-Momentum Convergence: The RSI uptrend is in lockstep with price action, confirming that bullish momentum is genuine and backed by increasing strength—not a divergence.
🔑 Key Levels
- First Resistance: $3.59—watch this closely as the next hurdle for bulls.
- Breakout Target: $4.85, which corresponds to the measured move (RR1) from the trendline breakout and aligns with the next horizontal resistance.
- Extension Target: $8.01 if momentum persists and price sustains above $4.85 in the coming weeks.
📌 Highlights
- Clear trendline breakout validated by strong RSI convergence.
- RSI has entered the overbought zone (76), backing momentum—watch for either breakout follow-through or brief cooling.
- Key levels: $3.59 (first resistance), $4.85 (breakout target).
🚨 Conclusion
Momentum is with the bulls after the breakout. Eyes on $3.59 as the near-term test; a clean move above opens up $4.85 and potentially $8.01 if momentum continues.
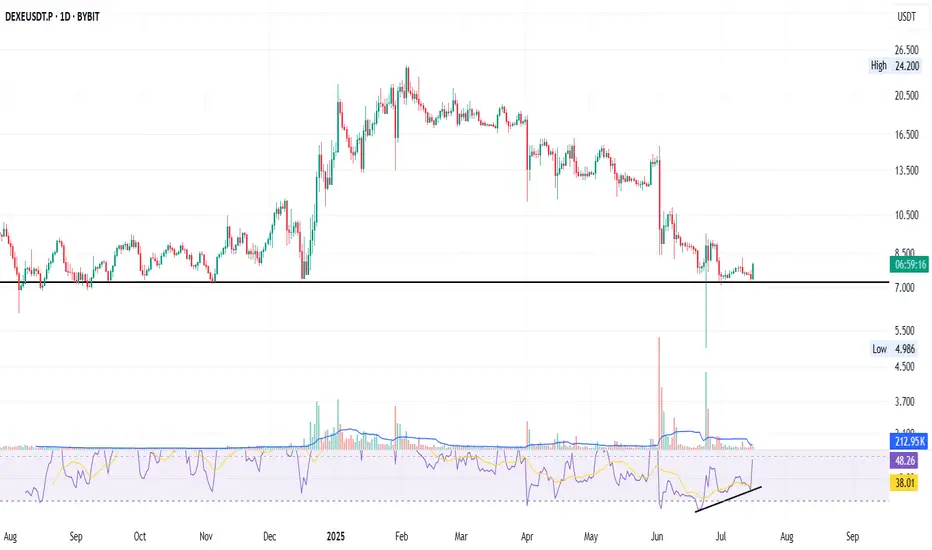
DEXE: Bounce + RSI Divergence + DeFi Strength
DEXE on the daily just bounced off an 11-month-old support - the key black line.
A strong bullish divergence on the RSI has been building for over a month — now confirming with momentum.
That long green wick under support? It’s signalling buyer interest and possible accumulation.
Fundamentals:
DEXE powers decentralized governance (DAO) with AI + DeFi alignment.
It enables transparent on-chain decision-making and sustainable DAO growth.
Backed by real partnerships, aiming for fair, merit-based participation.
I’m long: not financial advice.
Always take profits and manage risk.
Interaction is welcome.
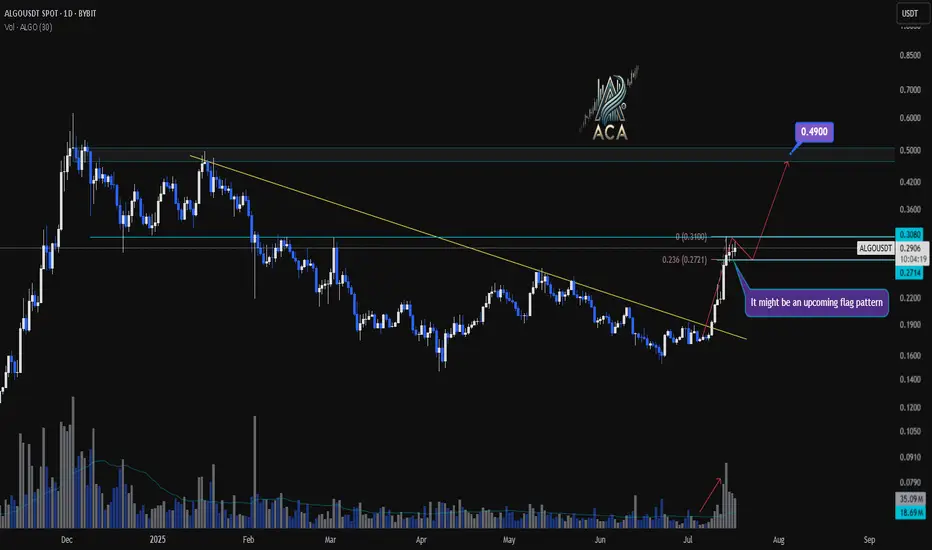
ALGOUSDT Daily Chart Analysis | Continuational patternsALGOUSDT Daily Chart Analysis | Momentum Picks Up on Higher Timeframe
🔍 Let’s break down the latest ALGO/USDT daily chart, highlighting a shift in market structure and key bullish signals.
⏳ Daily Overview
A decisive breakout above the long-standing descending trendline has flipped the narrative for ALGOUSDT. Increased volume during the breakout points to robust bullish momentum, suggesting buyers are regaining control at this multi-month inflection point.
🔔 Flag Pattern & Chart Structure
- Bullish flag pattern is emerging after the recent breakout, as price consolidates in a tight range—a classic continuation formation.
- Former trendline resistance is now acting as support, confirming a notable shift on the higher timeframe.
📐 Fibonacci & Target Levels
- The 0.236 Fibonacci retracement at $0.2771 is providing immediate support, with price consolidating above this anchor level.
- Upside targets:
- First resistance at $0.3080, which aligns with horizontal supply and previous pivot highs.
- If the flag pattern resolves upward, the next Fibonacci extension points to $0.4900, marking a significant confluence and potential for further gains.
📊 Key Highlights
- Strong daily candle and surging volume confirm momentum shift.
- Watch the developing flag pattern for breakout confirmation.
- Major trendline break on the daily signals structural reversal.
- $0.3080 is the immediate target; $0.4900 is the extended objective from the flag/Fibonacci alignment.
🚨 Conclusion
ALGOUSDT is setting up a compelling bullish scenario—keep a close eye on price behavior at the flag and $0.3080 level. A breakout may trigger the next impulsive move toward $0.4900.
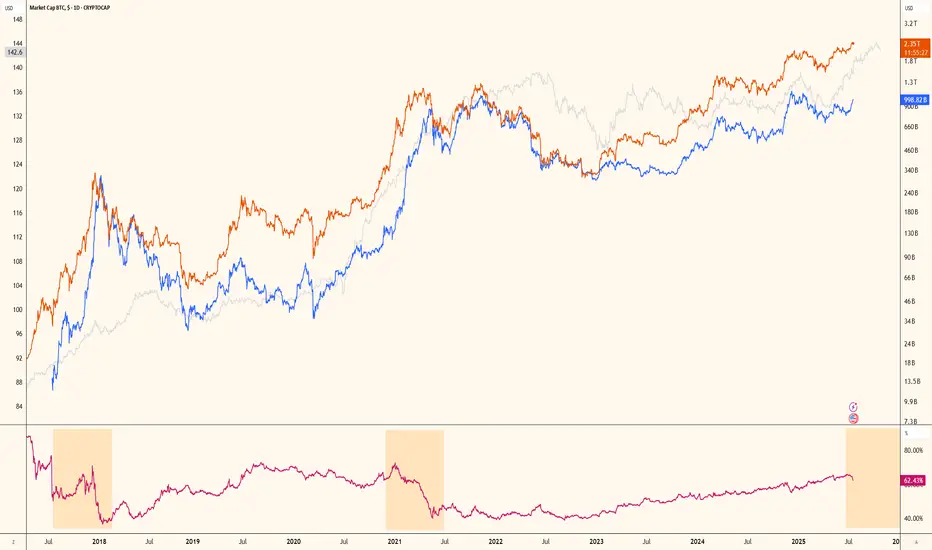
The Final Turn Before the Altcoin RotationAs Bitcoin continued its rise, altcoins couldn't keep up. This isn't the first time; the market has experienced this many times. The general pattern is as follows:
1. Global liquidity increases, providing a kind of spark to the market.
2. Bitcoin catches fire, and a bull market begins. If global liquidity increases during this time, great.
3. For various reasons, altcoins don't rise at the same pace as Bitcoin, and therefore Bitcoin's dominance begins to gradually increase.
4. When the market reaches saturation, dominance declines, leading to a rotation into altcoins.
5. The altcoin market capitalization equals Bitcoin's, and the bull market begins.
We're currently at a stage where Bitcoin's dominance has peaked and liquidity is still rising. The beginning of a decline in dominance will trigger a market rotation. This will trigger a capital flow into altcoins, bringing their market value equal to Bitcoin's.
Therefore, we're at the final plateau before entering a bull market. A further rise or hold in Bitcoin is expected. I'm currently buying altcoins, but I'm holding Bitcoin. I don't have a sell mindset at the moment.
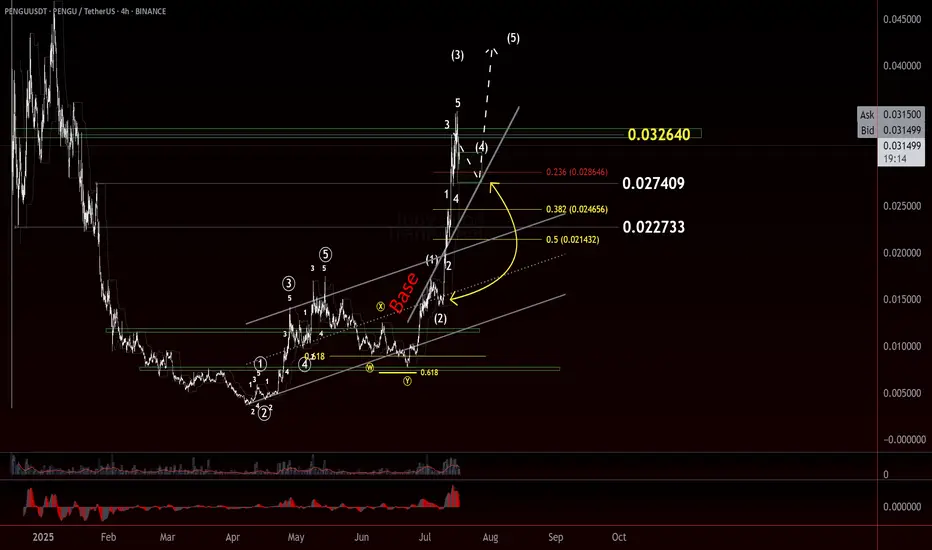
$PENGU Taking a Breather? CSECY:PENGU Taking a Breather? Wave 4 May Be Brewing
After a strong move, CSECY:PENGU looks like it might be pausing for breath. The recent action suggests we may have just wrapped up a small-degree Wave 3, with price now struggling to clear a key resistance level from earlier in the structure.
That hesitation could mark the early stages of a Wave 4 correction...Conservatively.
Here’s the zone I’m watching for a potential W4 pullback:
- .236 to 50% retracement of Wave 3, measured from the Wave 2 low
- Most Likely Target (MLT) sits right around the .382 fib
- Keep an eye on time symmetry—Wave 4 may offset the time duration of Wave 2
- Price could react off the base channel as a support guide
If this is a W4, it could give us a clean continuation setup into Wave 5—provided it holds structure and doesn’t overlap the Wave 1 territory. Stalking the pullback as it plays out, and am ready to react if we see support step in at the expected fib levels or the base channel.
Trade Safe!
Trade Clarity!
Solana Update: Miss This Analysis, Miss the Next Leg!Hey, I’m Skeptic! 🩵 Solana’s recently kicked off a strong uptrend momentum , and there are solid triggers waiting to activate that could bring good profits. In this analysis, I dove into Solana on weekly, daily, and 4-hour timeframes, and checked SOLBTC and BTC.D too, to get a grip on the current liquidity flow.
💬What’s your trigger on Solana? Drop it in the comments, and if you want an analysis on a coin, write it for me so I can check it out.

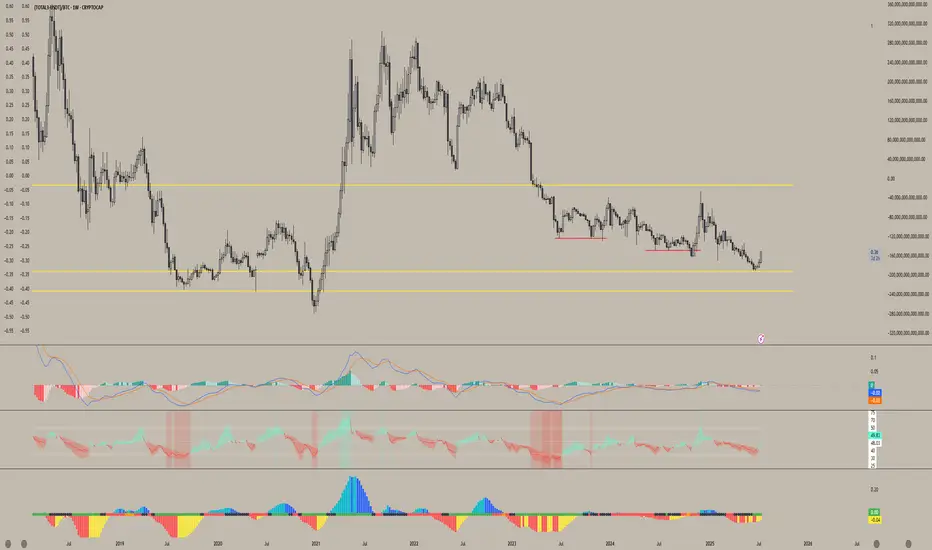
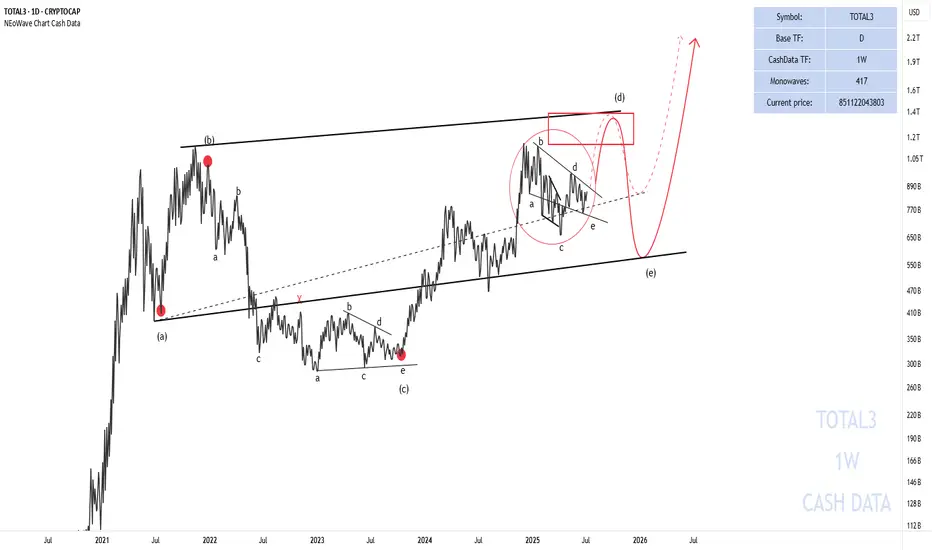
Has the Alt Season Started?Total 3 seems to be forming a neutral triangle (marked with a red circle) and will soon move towards the red box to complete wave-(d) of the higher degree triangle.
The price path is marked for you on the chart.
Good luck
NEoWave Chart
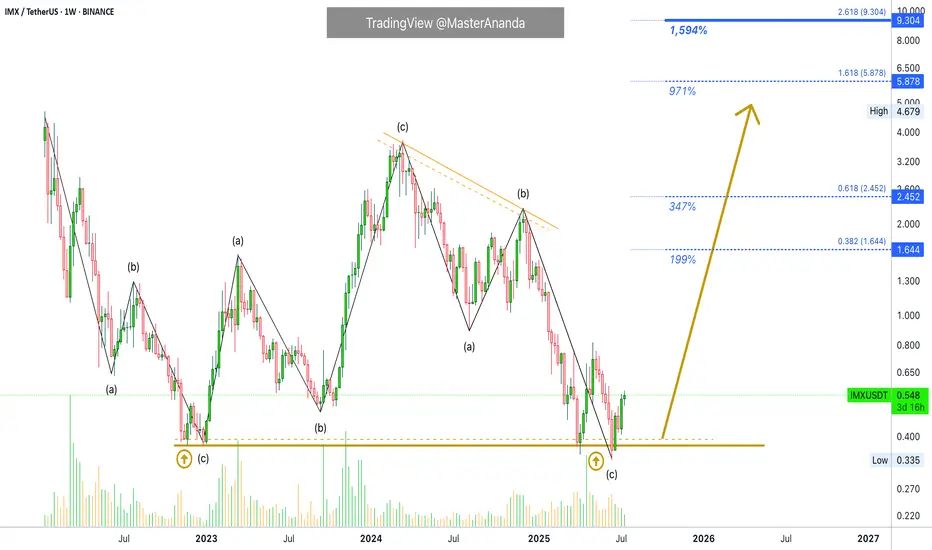
A New All-Time High Guaranteed for ImmutableX (1,600% PP)IMX produced a strong bullish cycle between December 2022 and March 2024. The entire bullish wave was corrected beyond 100%. This means that IMXUSDT hit a lower low. It went below the starting point of the last bullish wave. This is good in several ways.
The last move being deleted in its entirety opens the doors for a new bullish cycle with unlimited growth potential. We also know that all weak hands have been removed. Anybody who wanted to sell had more than a year to do so with all profits erased from the previous cycle. A total flush, a full reset.
The last bullish cycle produced more than 850%. We now know that this much is do-able so it becomes very easy. Last time market conditions were mixed to say the least, but not extremely bullish nor the best possible.
If IMXUSDT can grew this much in a mixed market, how much can it grow in a favorable market, in a bull market?
So, we aim for a strong higher high, a new all-time high. This opens up $5.9 an $9.3 as target for this newly developing bullish phase.
Thank you for reading.
Namaste.
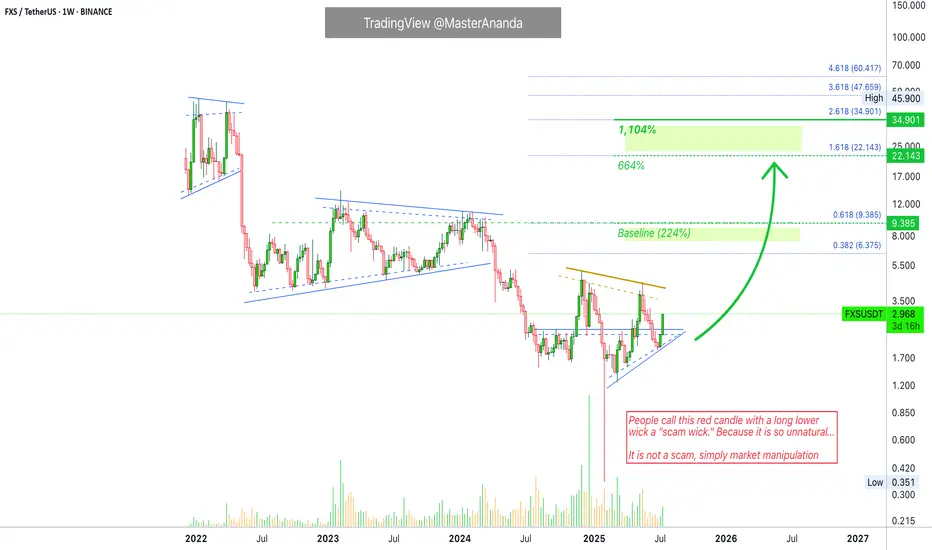
Frax Share 1,104% Target Explained · Scam Wick & MoreFrax Share is starting to recover with strong bullish momentum. The low for this pair was set 3-February with what many people call a "scam wick." Higher lows since. A higher low in March then again in April and June. Only a few pairs completed their lows in February and this is good.
The scam wick was so strong that you can be certain there is no need for prices to go lower again. From now on, we can witness sustained long-term growth.
The "back to baseline" level opens up an easy 224% potential profits. This is the level where you can say, "Ok, I want to triple this Bitcoin with very low risk." And it works like a charm because the action will end up much higher. This is the kind of move that cannot fail. We use spot of course as the whole strategy becomes a simple wait —buy and hold.
The next target gives us 664% and requires the highest prices since May 2022, more than three years. This one is good but some resistance will need to be conquered to get there.
The final target that is mapped on this chart opens 1,104%. This is a strong target but is also do-able. When all is set and done, we can end up with an even higher target. These are only conservative projections and hard to miss. I cannot say with a high level of certainty how far up Frax Share will go, the chart is a bit strange, but I can say with 100% level of certainty that we are entering a major bullish wave. 500% to 1,000% growth is an easy guess. Anything extra is welcomed and accepted.
Thank you for reading.
Namaste.
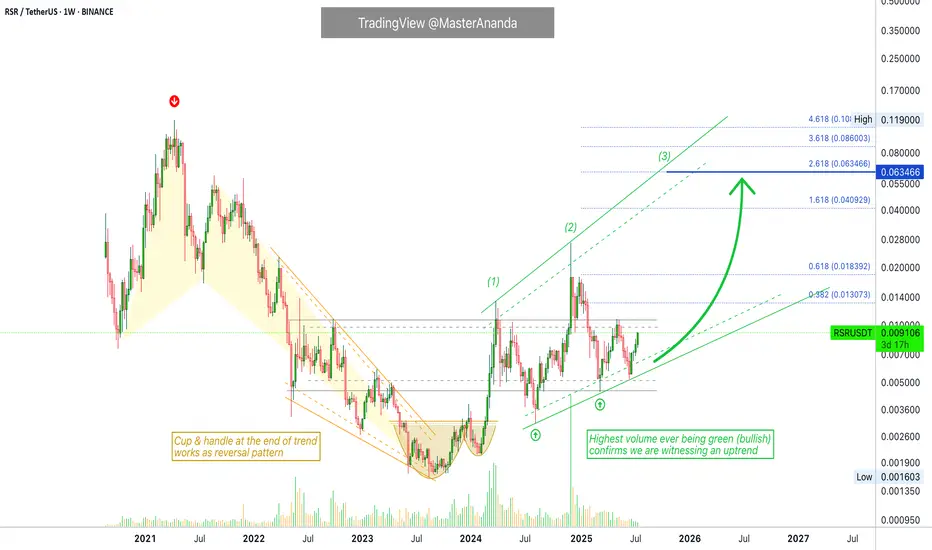
Reserve Rights · A Rising Trend · New ATH Potential in 2025I took my time drawing this chart for you showing all the different stages of the market cycle.
We are looking at Reserve Rights (RSRUSDT) on the weekly timeframe.
Full chart
» A bear market ends with an ending diagonal pattern and final bottom.
» The reversal forms as a classic cup and handle pattern.
» The market transitions from bearish to bullish and turns green.
» Price action changes from lower highs and lower lows to higher highs and higher lows.
» RSR creates a rising channel.
» We are witnessing the start of the next advance.
» Reserve Rights is ready for a higher high and the highest prices in four years, since 2021.
Current price action
» RSRUSDT is on its fourth consecutive green week.
» In early 2024, it produced 7 consecutive weeks closing green as a minor advance.
» The correction that followed was brutal but ended as a higher low in August 2024 than a new advance, this time a total of 17 weeks rising but not all green.
» We are set to experience the last and strongest bullish wave for this RSRUSDT bullish cycle.
» It should be many times stronger compared to last two.
2025 New all-time high
» The final target for this wave can be many times higher than what is shown on the chart.
» On the chart I am showing only a very conservative target.
» I expect higher prices.
» Looks like a good pair based on TA.
Thank you for reading.
Namaste.
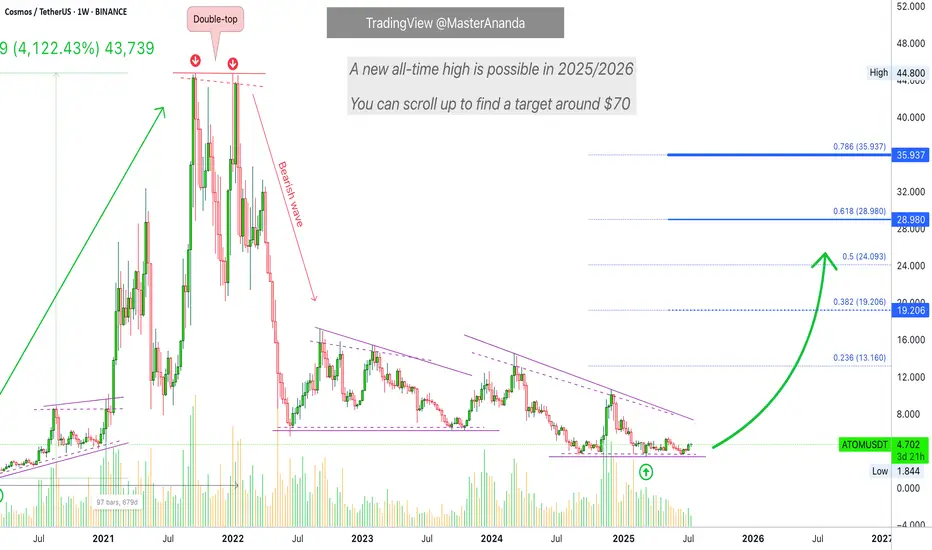
Cosmos (ATOM) Trading At Bottom · Bear Markets End ForeverCosmos is still trading near its market bottom, the "opportunity buy zone" as I call it. This is nothing more than great news.
Remember how I mentioned that some pairs are really advanced, trading already very high and this is risky if you want to go LONG? Well, when projects are trading near the bottom of the range; support, all-time lows, this is great news because there is little room for lower and plenty of room for prices to grow. ATOMUSDT is now in this highly desirable situation.
This a trading pair that is "yet to move."
It is awesome.
Potential for growth goes beyond the chart, literally. The chart you are seeing here now does not show the potential ATOMUSDT has for growth. The size of the candles should tell you everything you need know.
Bullish waves, corrections, bullish waves and corrections and see how small the candles are. Compare to the action in 2021 and you know we are looking at a true bottom. This opportunity does not repeat often and with the market evolving as it is evolving now, this might be the last chance in the history of Cryptocurrency to buy this low.
This is because we are entering an extended bull market that will last for years to come. When a new bear market develops, a long-term correction, it will be nothing like before. Instead of down, down, down forever, we will have some sideways then down, a strong swing followed by a recovery and additional growth. Just like Bitcoin. Look at Bitcoin since November 2022, that is how most of the big altcoins projects will evolve.
The wild-wild west of Crypto is going to an end. Think of it this way, Cryptocurrencies credit application has been approved.
Remember how the bear markets became shorter and the bull markets longer when the Federal Reserve came into the picture in the early 20th century? That is because with credit easily available, there was no more need for the companies to crash nor take a long time to recover from a major downturn. Here the situation is the same.
With the Cryptocurrency market now being accepted as the amazing technology that it is, we have access to credit. Instead of long and wild crashes, we will have short-term corrections. In short, demand will be too strong for the market to stay depressed for too long.
There will always be corrections of course, night and day (market cycles), but from now on, these will be short.
Namaste.
Pepe's Bullish Bias Intensifies · 217% PP = 1085% 5X Lev.The bullish bias for PEPEUSDT is starting to intensify, still early of course. It is still early on this one because the action is still lower than the 19-May high. There are many projects that are already trading above their last high. So it is good news to find a pair that is moving below because we know that soon it will be moving above. In the coming days.
While the 19-May wick high reached 0.00001632, the weekly close happened at 0.00001361. As you can see from the chart, the current price is already higher than the highest weekly close and this gives us a strong bullish signal.
Notice again how the action moved above EMA89 back in mid-April. When the retrace happened, May-June, the recovery happened above this level. A signal of strength.
PEPEUSDT moved briefly below EMA55 only two recover and this is the second week above this level. Trading weekly above EMA55 & EMA89 means that the bullish bias is fully confirmed. A fully confirmed bullish bias means we are set to witness a higher high, and a higher high means prices moving above 0.00001953, short-term. In a matter of days.
The main target for this move is 0.00004264 giving us a nice 217%. With 5X leverage, relatively low risk, that would be beyond 11X (1,085%).
In a matter of days, the entire altcoins market will be bullish and moving higher. Make sure you are fully invested by the time everybody is rushing to buy. That is, you should be all-in now. It is not too late.
Thank you for reading and for your continued support, it is truly appreciated.
Namaste.

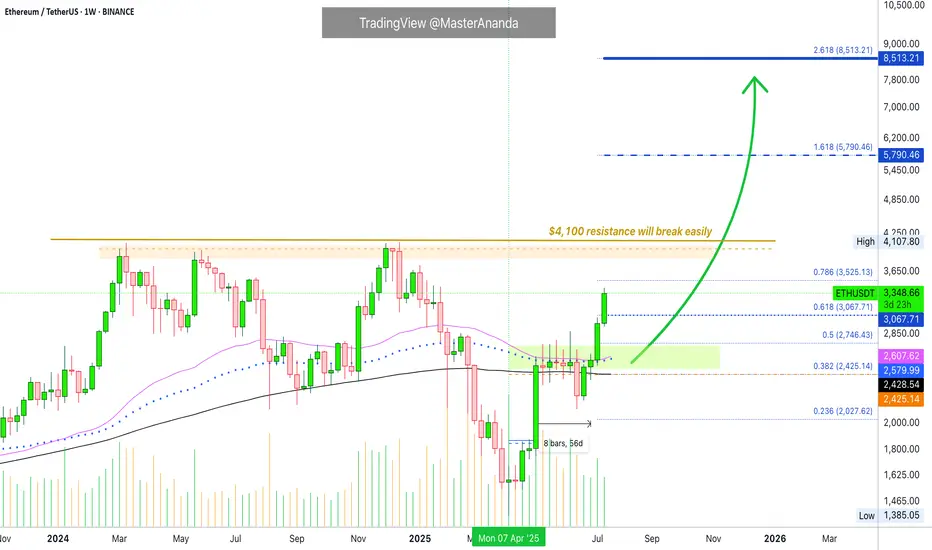
Ethereum · Going beyond $5,790 · $8,513 Next TargetThe eight weeks of consolidation, 56 days, happened as compressed (sandwich style) action right in-between MA200 and EMA55/89.
The EMA55/89 duo worked as resistance while MA200 worked as support.
Before a major move the market always tends to produce a form of shakeout. Sometimes it is call a bear-trap, a shakeout, a liquidity-hunt or stop-loss hunt event, a failed signal, etc.
Here Ether (ETHUSDT) closed below MA200 one week just to recover the next. In this case, we will call it a failed breakdown but we know this is a way to liquidate over leveraged long-traders, also a way to catch unsuspecting bears ready to short. The conclusion is simple, Ether recovered the next week above MA200 and the following week above EMA55/89 which worked as resistance for six weeks. With these levels behind us, the market is full green.
Notice the last two candles, big huge green candle. That is because resistance is no more.
With no resistance to stop prices from rising, Ethereum started to grow and we are now in full blown bullish mode.
The last major high sits at $4,107. This is an easy target, the minimum. Once support is tested the action moves toward resistance and this is where we are headed.
Some people will wonder if resistance will break or hold. Some unsuspecting bears, again, will even short at resistance thinking this is the logical move, they will lose all.
The truth is that this resistance and major high will break easily, we know this based on marketwide action and Bitcoin, Bitcoin is hitting new all-time highs every other day. In this way, we know that Ethereum will soon catch up and do the same.
Many altcoins are moving forward and growing, and some already conquered their December 2024 high price. This is another indication that shows Ether will not stay behind.
Whatever you do when Ethereum goes up, do not short. You can short if you are going to close the short after just a few hours or a few days, but instead of shorting a bullish trend, go LONG and enjoy maximum profits on the way up.
» Ethereum will break $6,000 and move toward $8,500 and beyond in the long-run.
You read it here first.
Thanks a lot for your continued support.
Resistance will break and the altcoins market will continue to grow. Not only for a few months but for a very long time.
When correction time comes, it will last a few months, we will get higher lows and then additional growth. Think of the pattern that came up on Bitcoin but with the altcoins; long-term growth.
Namaste.