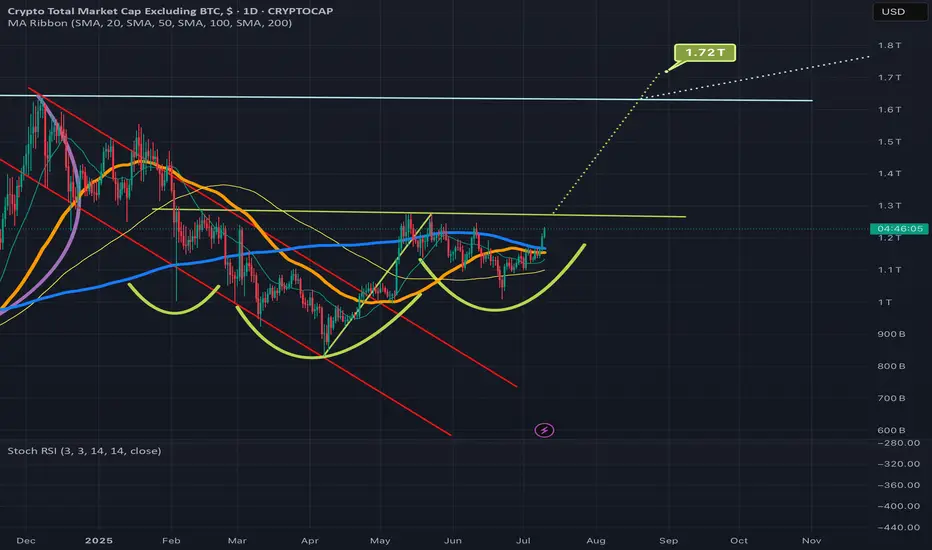
The daily chart for total2 to look at the impending golden crossWanted to also post a daily chart tie frame of my previous idea. I first posted it in weekly to fit the entire cup and handle breakout target in the frame, but wanted to also post the daily time frame to provide both a close up of the inverse head and shoulders pattern as well as the impending golden cross on the daily time frame. Loos very likely that alt season may finally be approaching here. Gonna pay close attention to both this chart and the bitcoin dominance chart btc.d to know for sure. *not financial advice*
Altcoins
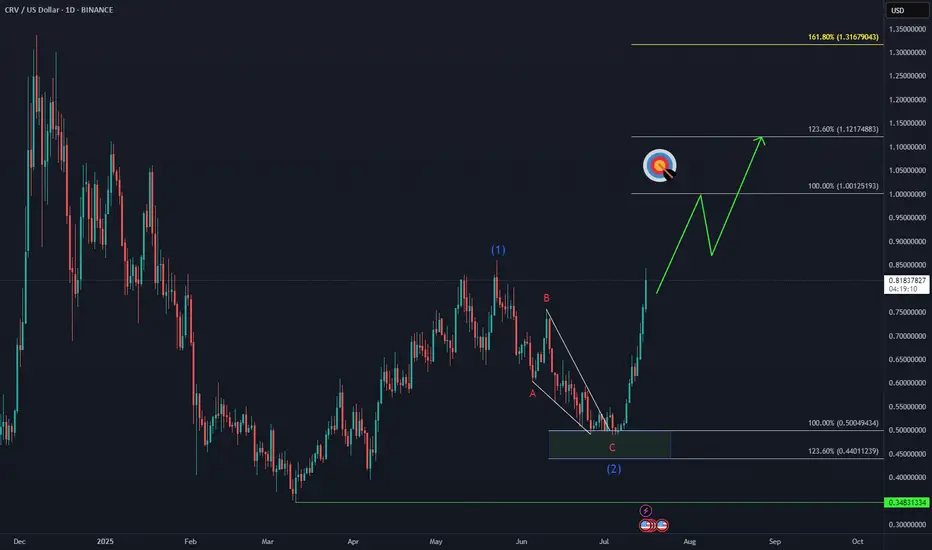
CRV Marching Toward Target📈 CRYPTO:CRVUSD is approaching a key breakout level, with bulls aiming to surpass the May peak and reach the $1.00 initial target.
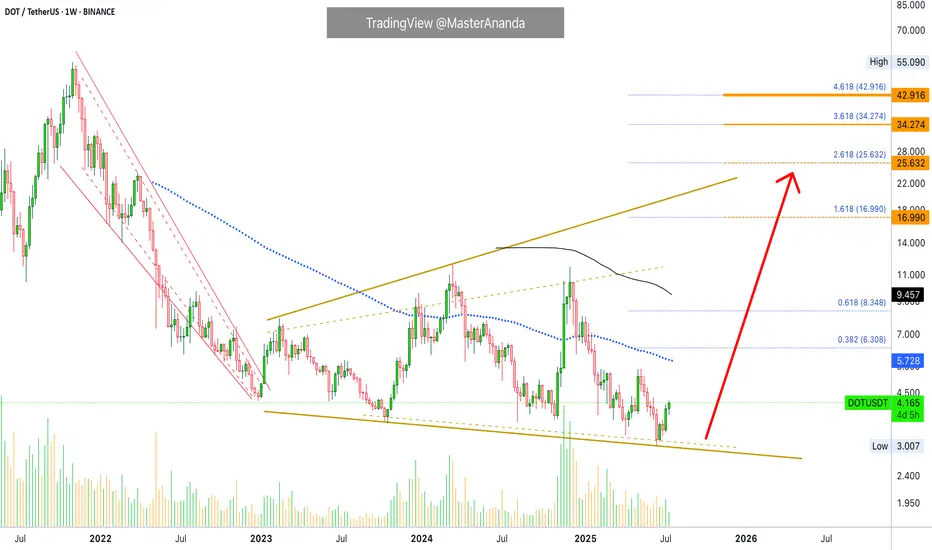
Polkadot Opportunity Buy Zone · Near Bottom · 2025 Bull MarketThis is what I mean: Opportunities are endless in this market. Compare Polkadot to say, Solana or Cardano which I shared just recently. Can you notice the huge difference?
First, Polkadot is still trading below EMA89 and MA200 weekly. Not to be taken as a bearish signal but instead to be interpreted as the pair being very early in its bullish cycle.
While Solana is trading ultra-high, super-strong, one of the strongest pair, which is bad if you want to go LONG (high risk with a small potential for reward), Polkadot is trading within the opportunity buy zone, very close to its bottom (low risk vs a high potential for reward).
I am a buyer. I am a Cryptocurrency fan. I am a bull.
So I want low prices and that is why low prices are good.
This is an opportunity, DOTUSDT. It is trading low now but it won't be trading this low for long, not even weeks. It is likely to start advancing within days. Once the bottom is gone it is gone forever. These altcoin projects will be the new tech giants and they will rise long-term. This is your chance. This is your opportunity for long-term trading success. Once you catch the bottom, you can't go wrong.
The chart is showing a long-term broadening channel. This is part of the transition period, from bearish to bullish, the consolidation phase. While the channel looks pretty big, the swings, if you activate the linear chart you can see the truth. Perspective. You will see a true bottom on the chart. From the bottom we grow.
When the action challenges the lower boundary of the channel, support; the market reverses, in this case Polkadot will start to go up. It is already growing. Several weeks rising. The upper boundary is the minimum giving us more than 425%. But we are not aiming for the minimum, we want high in the least, we want the maximum, so let's go for a new all-time high or just below the last one.
Namaste.
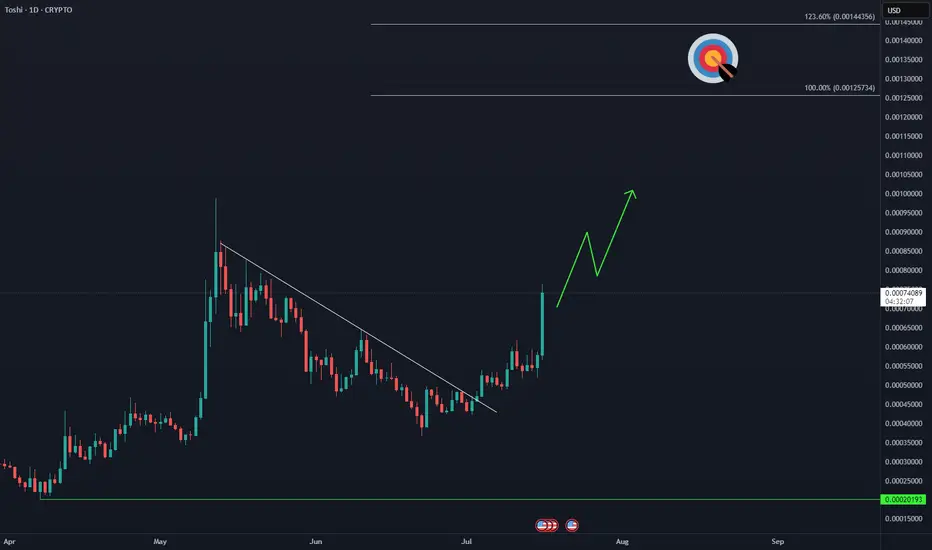
TOSHI Bulls on the Move🚀 COINBASE:TOSHIUSD is showing signs of acceleration, aiming to break above the May peak and extend toward the $0.0012 target zone.
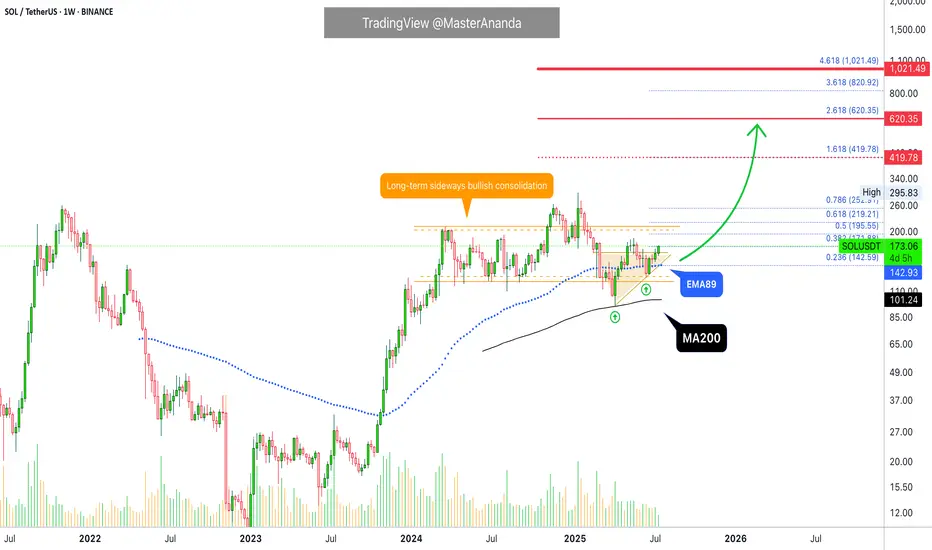
Solana Ultra-Bullish Above MA200 & EMA89 · $1,000 ExplainedOne guy was saying Solana was set to move lower because it already produced a "3,000% bullish wave." What nonsense... Solana is ultra-bullish. We don't do an analysis based on some unintelligent assumption rather, we focus on the data, the signals, the indicators, the chart.
Solana corrected and found support perfectly, exactly at MA200 in April 2025. Boom! It never went below so it was never bearish to start. A true long-term bull market a la Bitcoin.
And more recently, on the 16/23-June weeks, it traded briefly below EMA89 just to recover and later start rising. This is a strong bullish signal on its own. The fact that bears tried to push prices lower and failed; bullish. The fact that there is a strong higher low between the test of MA200 and EMA89. The fact that we can make mistakes with our interpretations but the chart is never wrong.
The fact is that Solana is going up with the next easy but strong target being $420. It can reach, later down the road, $620 and even higher to peak at $1,000+. Can you see what I see? Crypto is going up.
Bitcoin is going up. Solana is going up. Ethereum is going up. Cardano is going up. XRP is going up. Dogecoin is going up. We are going up. The new financial market is growing. It is not just these projects but Cryptocurrency will replace the old financial system, this is another fact. The older system will be left behind because Crypto's market cap. will grow so strong and so fast, maybe a 10 years long bull market will do the trick, we will start with four.
If you want to be high more forever rich, buy Crypto. Solana is a good choice.
Thanks a lot for your continued support.
Namaste.
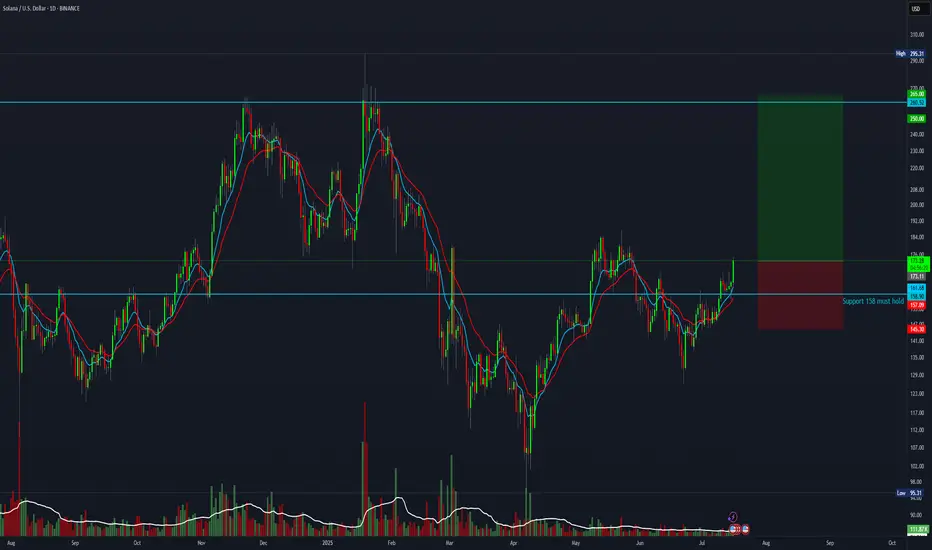
SOL trade setup with a 3.3:1 risk-to-reward ratioThis trade setup offers a 3.3:1 R:R
Entry: 174
Stop Loss: 145
Target: 265
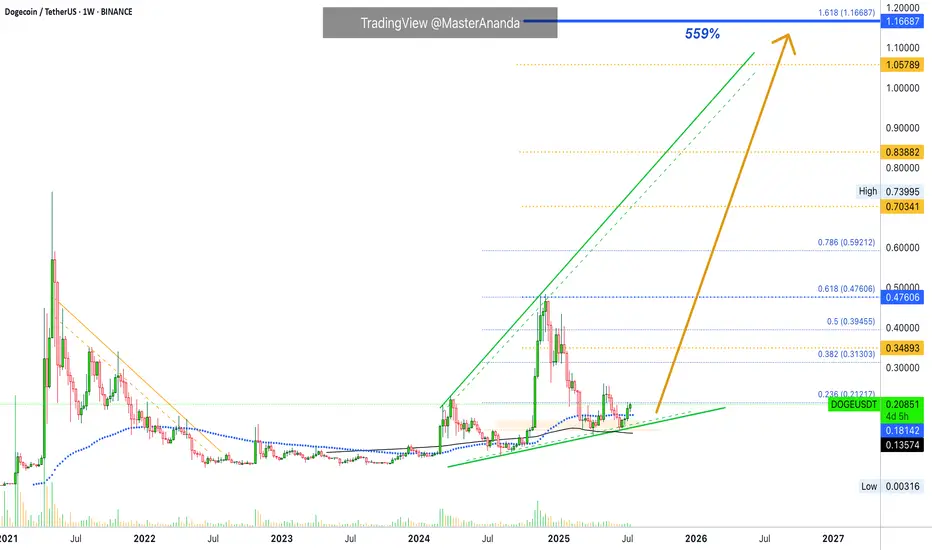
Dogecoin Mid-Term & Long-Term Targets · Advanced Trading TipsNotice here the same price dynamics we just saw with Cardano, the exact same:
» Dogecoin is now on the fourth consecutive green week.
» Dogecoin closed last week above EMA89 on a full green candle.
» Dogecoin is in a rising trend since August 2023 but the market bottom happened in June 2022 rather than 2023. A small variation compared to Cardano but these projects are in the same group, big capitalization, and they tend to move together. What one does, the rest follows.
The situation right now is really really good for this pair. Notice that Dogecoin is not only trading above EMA89 but also above MA200. This confirms that we will experience growth long-term.
The yellow targets are the intermediary targets while the blue ones are long-term. The minimum price Dogecoin will reach in this rise is $1.16. This is based on the long-term, the last all-time high, the previous bull market and the broader cycle. Now, it can definitely move much higher but we start with a strong target that has a high probability of success. Depending on how this level is handled, we can aim higher.
For example: I will always be here sharing charts. If at one point the market goes nuts and you need an update, just leave a comment or send me a message and I will look at the chart and share information based on the present day. Market conditions can always change.
Right now we have to make some wild speculations, still educated guesses but as the bull market is more advanced, we will know with a high level of certainty how far up each pair will go. That is because certain pairs tend to move ahead of the pack, look at FUNUSDT as a good example. It has been moving straight up.
An interesting bit of data. 5-May DOGEUSDT produced its last peak. Some altcoins are already trading above their May's high. This simply means that related pairs, those that move in a similar way, will do the same. This signal works as bullish confirmation, it means Dogecoin will continue to grow, with a high level of certainty, we know this based on price action, the chart and marketwide action.
You can use leverage on this setup even now as long as your liquidation is below MA200 to be safe. Very low leverage because it is already moving. If you do higher you are gambling. If you want to gamble that is also ok but we prefer trading: Low risk vs a high potential for reward and high probability chart setups.
The next leg up is already confirmed. We are moving up within days. The bullish action is already happening, it is already live; four consecutive weeks going up/green. Knowing this, we know the 5th, the 6th weeks and so on are composed of major bullish momentum.
Adapt now. Do whatever it takes, whatever you have to do to maximize profits. Opportunities are endless of course.
While it still early for this and many other pairs, there are some that have even less risk, trading at true bottom and the market will continue to have variations for all types of traders.
You can do great in this cycle.
Never take action on an impulse.
If an idea cannot wait a few hours to be implemented or a few days, then just let it go.
A true, valid and valuable idea will be valid even after the initial rush. They tend to come when everything is calm. If you get impulses when excitement is building up, hype and all that, sit, watch and relax, a shakeout can develop. If you feel like going in now hard, then go ahead, right now nobody is excited and nobody is hyped-up, this means that the market is rising and the bullish bias is confirmed. Only when we are approaching a crash everybody will start talking about forever more. When the market is good and low, nobody cares... If you do, you are already an expert.
Namaste.
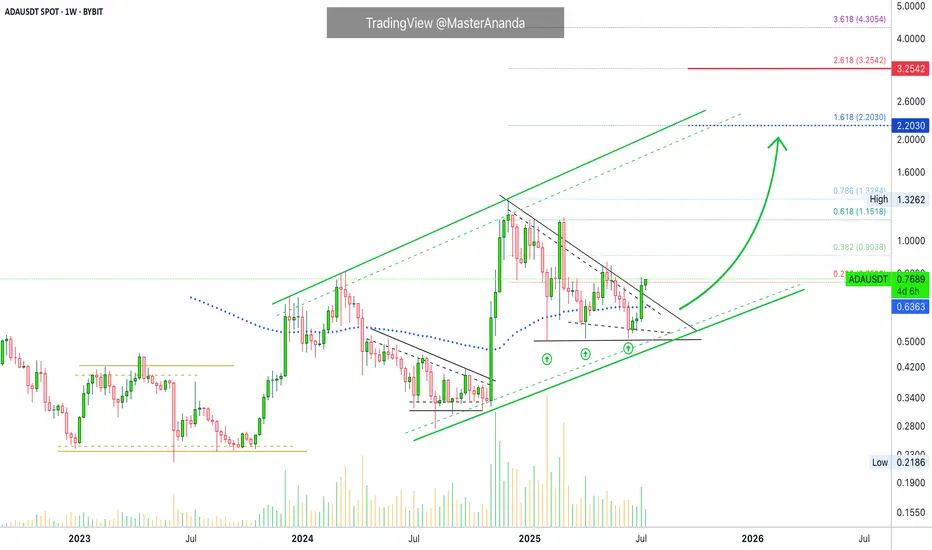
$2.2 Followed by $3.25 · Cardano Trend-Based Fib ExtensionCardano is a on a clear, and very strong, ascending channel rising since June 2023. We are clear, safe and confident about the bigger-broader market trend. An uptrend within a long-term bullish cycle.
After the peak in early December 2024 Cardano struggled to stay above EMA89—the blue dotted line on the chart—but this isn't the case anymore. After a triple-bottom, shy higher lows, last week ADAUSDT managed to break decisively above this level with a full green candle. This confirms the resumption of the late 2024 bullish wave.
Last week resistance was found at 0.236 Fib. extension. The weekly session closed right below it and this is shown as a thin tiny red dotted line on the chart. The current week is halfway through and ADAUSDT is now trading above this level. The bullish signal comes from the fact that the action is happening at the top of the candle; this is the fourth consecutive green week; the bullish bias is fully confirmed.
That is all there is. I just wanted to share a small update in support of our bullish bias based on chart data. You can rest easy knowing that the market will continue to grow.
Next target is $2.20 for 188%. Followed by $3.25 for 325%.
We use leverage on the big projects so the potential for profits can be multiplied by 5, 6, 7, 8, or 10X. The risk is higher of course, but so is the potential for reward. High risk vs a high potential for reward. You can always approach the pair spot if uncertain. If you lack experience but still want to join the ride, enjoy the rise, make money and have fun, you can buy spot, that is, buy and hold. The market will give you money if you are patient enough. This is the period where everything grows. Thanks a lot for your continued support. If you enjoyed the content consider hitting follow.
Namaste.
2/ Altseason: Live - My Coin-Picking StrategyThe "Altseason: Live" experiment has unofficially begun. While many are debating if altseason will happen at all, I prefer to act. We may not see a classic, market-wide surge across all coins. The market has changed. But I believe that targeted, explosive opportunities always exist.
In this post, I won't be giving signals. I will share something much more valuable- my methodology for selecting coins for this final push. This is the exact approach I'm using right now.
Principle #1: Finding the 'Right' Cycle
I've long observed how major players profit from altcoin cycles. In every asset that shows exponential growth, I almost always see three distinct phases: Pre-Pump, Pump, and Super-Pump.
This isn't chaotic growth; it's a managed process. We've seen numerous examples over the past year. Let's look at the RSR chart as a textbook example of such a cycle.
My task is to find coins that have completed their accumulation phase and are now in the "Pre-Pump" stage.
Principle #2: Detecting the 'Footprints' of a Major Player
How can you tell if a major player is in a coin and ready to make a move? I look for what I call "candles with long wicks."
When you see an abnormally long lower wick on a chart with increased volume, it often means one thing: someone is trying to buy a large amount, but there isn't enough liquidity in the order book. The price drops, they sweep up everything available, and the price snaps back up.
For me, this is a clear sign—there's a "whale" here. They are defending their level and continuing to build a position to distribute at much higher prices.
Principle #3: Risk Management and the First Trades
Based on these two principles, I've gone through my extensive watchlist and selected my first targets. My choice fell on MAV and RONIN. On their charts, I saw the exact patterns I was looking for.
I want to be perfectly honest: this is aggressive trading. To achieve my ambitious goal, I will be taking risks. But I am only risking an amount that I am mentally prepared to lose. You have to understand: this is the crypto market, these are altcoins, often with low liquidity, and this is all happening on centralized exchanges. The risks are maximal.
What's Next?
The goal is set. The first steps have been taken. I will try to act carefully but decisively.
I'm documenting every step of this experiment. You'll be able to see everything with your own eyes, including my real PnL and open positions, on my regular livestreams.
Thank you for your attention. Fasten your seatbelts; we're taking off.
Best regards EXCAVO
ETH to $4K ? Whales Accumulate as ETFs Break Records🕞 Timeframe: 4H
.
🟢 Bias: Bullish
1. 🧭 Fundamental Overview:
📈 Massive Institutional Inflows:
Ethereum ETFs have recorded over $1.2 billion in net inflows this July, with $908M just in the week ending July 11. This strong demand from institutional players (notably through ETHA and Bitwise) has pushed ETF AUM above $13.5 billion.
🏢 Corporate Accumulation:
Companies such as SharpLink Gaming have begun adding ETH to their balance sheets. SharpLink's 10,000 ETH (~$49M) purchase highlights growing corporate adoption of Ethereum as a store of value and strategic reserve.
🛠️ Ecosystem Resilience:
Ethereum continues to lead in network upgrades (e.g., Dencun), institutional DeFi, and tokenized assets—strengthening the long-term fundamentals of the chain.
2. 🧠 Sentiment & On‑Chain Metrics
🏦 Institutional Sentiment:
Ethereum ETFs have seen 12 straight weeks of inflows, outperforming Bitcoin in institutional allocation growth (ETH: 1.6%, BTC: 0.8%).
🐋 Whale Activity & Exchange Flows:
Declining ETH balances on exchanges suggest accumulation and reduced sell pressure. Whales and smart money are taking positions.
📊 Public Sentiment:
Bullish expectations remain strong amid price consolidation above key levels and positive ETF momentum.
3. 🔼 Key Levels:
Support: $2,770 and $2,500 (major trendline and psychological level).
4.🎯 Price Targets:
Short‑term (2–4 weeks):
If ETH breaks above $3,150: next targets at $3,400 and $3,750.
Medium‑term (by end of Q3 2025):
ETH could reach $3,500 with potential upside to $4,000.
.
.
.
⚠️ Disclaimer: This analysis is for educational purposes and not financial advice. Please do your own research and risk management.
.
✅ If you like this analysis, don't forget to like 👍, follow 🧠, and share your thoughts below 💬!

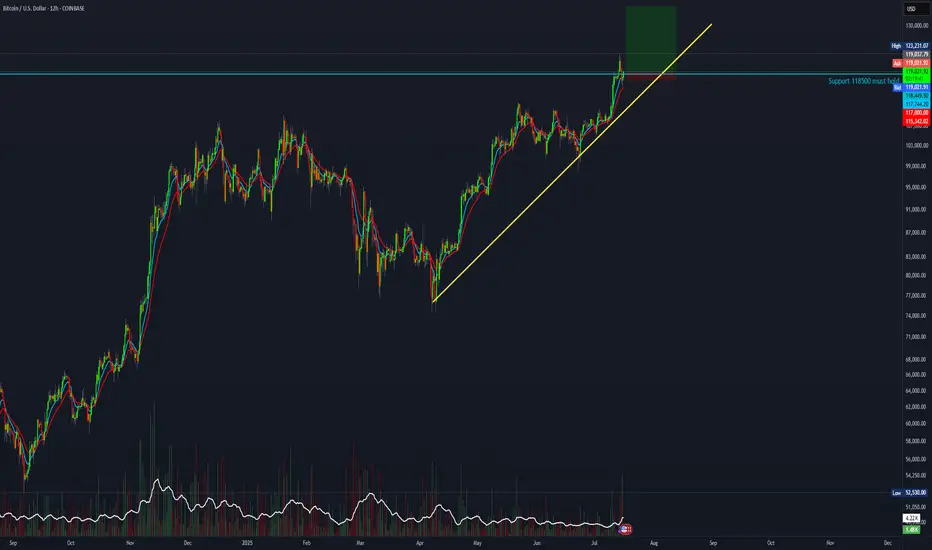
Bitcoin Ranges While Altcoins Rise — Follow the Liquidity TrailHeyy traders, it’s Skeptic from Skeptic Lab! 💙 Dropping a red-hot update on Bitcoin and the crypto market to catch the next big wave. We’re diving into the Daily timeframe and market dynamics to track where the money’s flowing. here’s the play:
✔️ Daily Timeframe
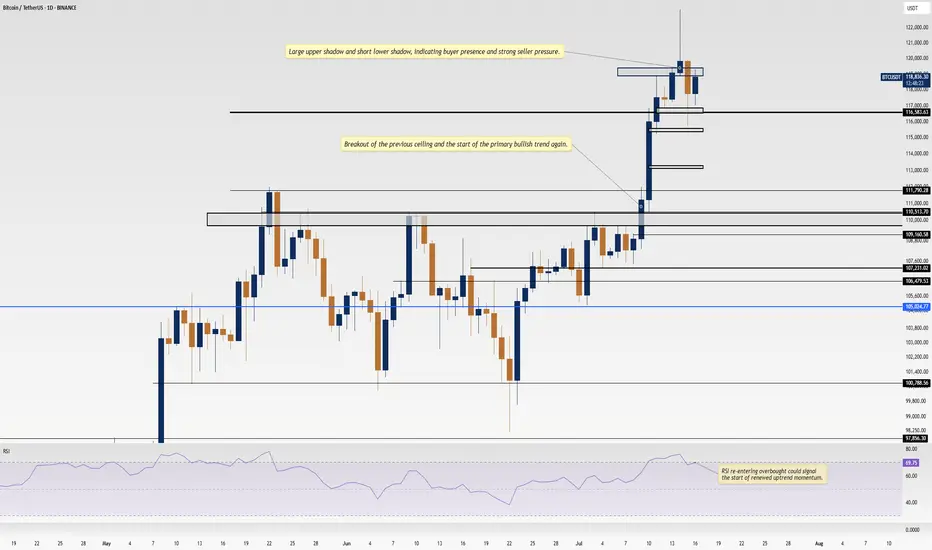
As we flagged in my last Bitcoin chart, the $ 120,000 level is a liquidity magnet with heavy action. The July 14 candle tried breaking it but failed, leaving a downward shadow showing strong seller presence at this level. Plus, last week we hit the 4-week pivot point on the Weekly , and as expected, we’re now ranging around $120,000. Does this mean we ditch crypto? Big NO.
📊 Bitcoin Dominance (BTC.D)
Let’s zoom in on BTC.D —it’s gone sharply bearish, with yesterday’s candle screaming capital exiting Bitcoin. Traders who profited up to $120,000 are locking in gains and moving funds elsewhere. So, what’s the story?
Bitcoin broke its ceiling after 168 days, surging 10% to $122,000. Buyers took profits, pulling liquidity out.
Where’s the money going? Let’s test two theories:
USDT? Nope. USDT.D is also bearish.
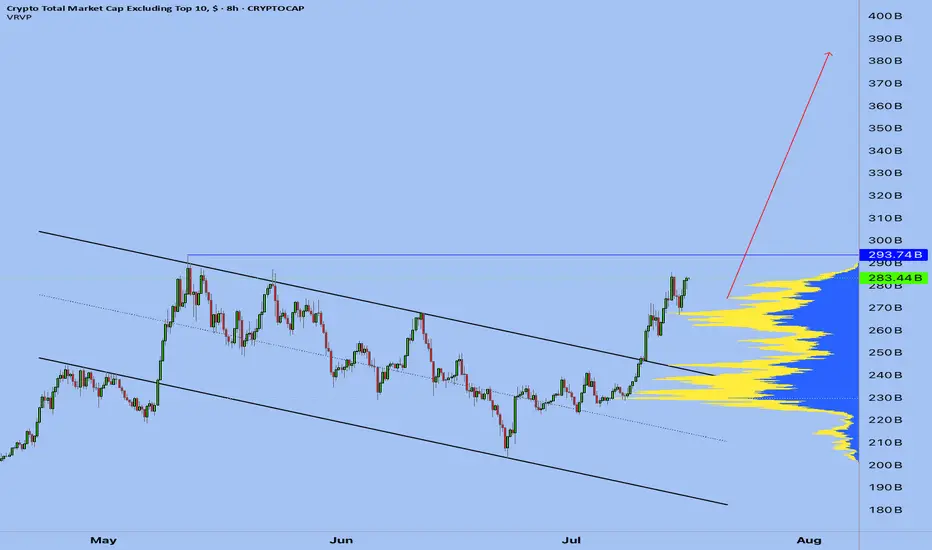
Altcoins? Bingo! TOTAL2 (altcoin market cap) smashed its Daily resistance at 1.34 after months, signaling liquidity flooding into altcoins.
📉 Which Altcoins? Here’s the trick: check pair/BTC ratios . For example, to pick between Solana or Ethereum, compare S OL/BTC and ETH/BTC . The one with a stronger uptrend is soaking up more liquidity from Bitcoin.
🔔 Key Insight: This liquidity flow game is a game-changer for crypto traders. Want a full dominance tutorial? Let me know —it’ll show you how to track where the money moves and which coins get the most action.
🔼 Key Takeaway: Bitcoin’s ranging at $120,000, but altcoins are heating up as BTC.D drops. Hunt for altcoins with bullish pair/BTC charts to ride the liquidity wave. Risk management is your lifeline—cap risk at max 1%–2%. I’ll catch you in the next analysis—good luck, fam! <3
💬 Let’s Talk!
Which altcoin are you eyeing? Hit the comments, and let’s crush it together! 😊 If this update lit your fire, smash that boost—it fuels my mission! ✌️
1INCHUSDT - fear zone, return to the channel, growth potential1inch - is a decentralized exchange (DEX) aggregator that combines multiple DEXs into a single platform, aiming to provide users with the most efficient routes for swaps across all platforms.
📍 CoinMarketCap : #160
📍 Twitter(X) : 1.3M
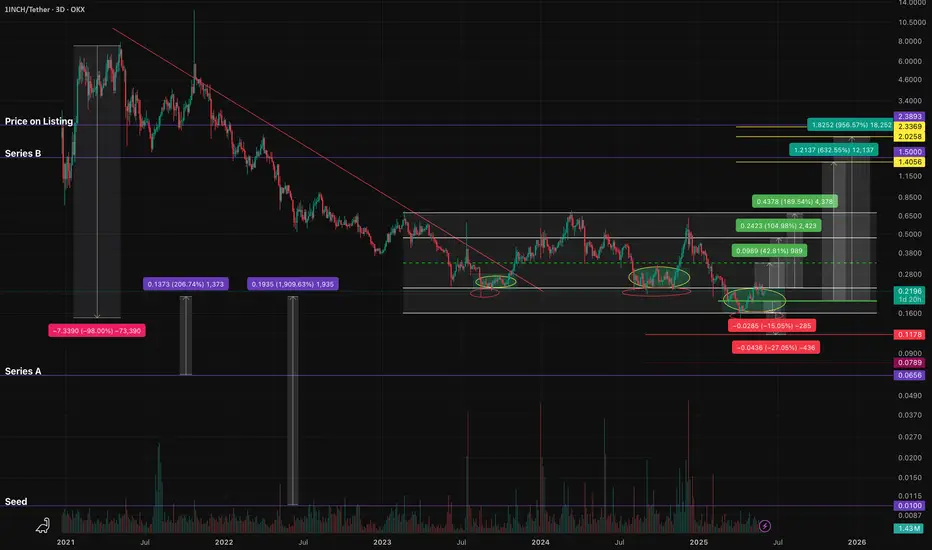
The coin has already been listed on exchanges during the distribution phase of the cycle and was partially sold off in waves. Then, in line with the overall market, it declined to more reasonable accumulation prices, shaking out small investors and those who entered positions on positive news.
The price has been moving within a horizontal channel for a couple of years, and the channel’s percentage range reflects the coin’s liquidity. Currently, the coin is in a fear zone, at its lowest price levels. In moments like this, very few people have funds left to accumulate positions, as they’ve already been trapped by optimistic bloggers and a positive news background earlier.
Many were wiped out recently due to a breakdown and consolidation below the previous support of the inner channel, and now there's emptiness and fear below. What’s happening now is an attempt to return back into the inner channel. If this zone holds, the channel targets may be realized.
Resistance zones where the price may react are marked on the chart. Potential final downside wicks are also indicated. It’s important to allocate funds wisely for position building and use proper percentage distribution, according to your own experience!
______
📌 Not financial advice. Observing structure and recurring phases.
Operate within your strategy and with an awareness of risks.
7:1 R:R setup for BTCIt looks like BTC has completed its pullback and is now continuing its uptrend. This trade setup offers a 7:1 R:R with a target of 135K
Entry: 118,900
Stop Loss: 117,000
Target: 135,000
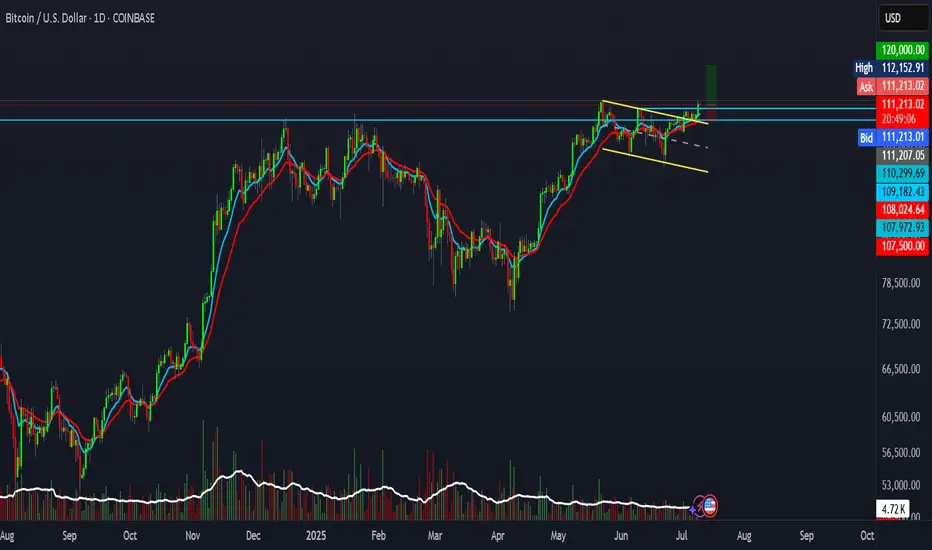
BTC setup with 2R R:R.BTC is showing signs of a real breakout.
This setup offers a 2:1 risk-reward ratio.
Entry: 111,207
Stop Loss: 107,500
Target: 120,000
Not financial advice.
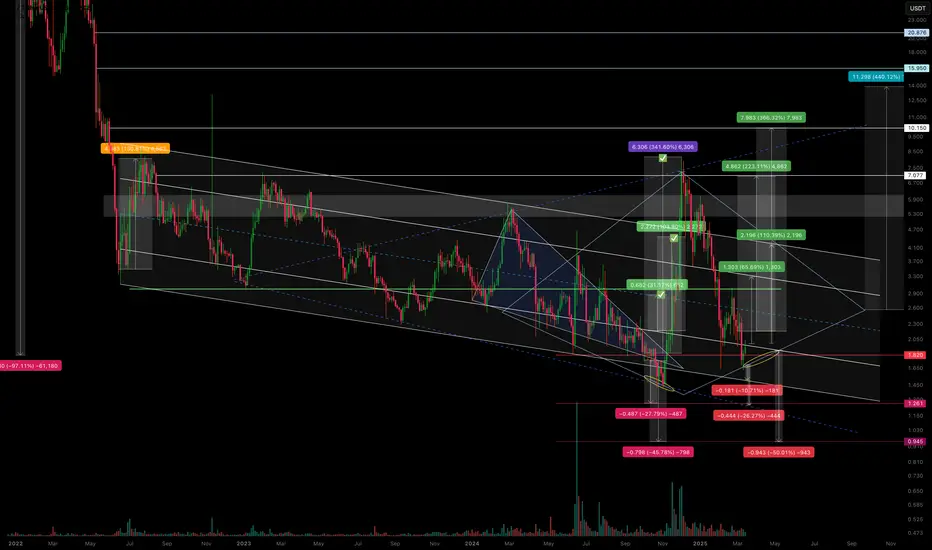
CVX/USDT – Is the scenario repeating? Continuing to work.The previous trading idea has played out with 3 out of 4 marked zones reached.
We saw a false breakout from the descending channel, followed by a pullback in line with the overall market—returning to the channel’s support zone.
I’ve noticed a potential formation of either a diamond pattern or an expanding triangle, but we’ll see how it plays out further.
Regarding declines and support zones:
-10.71% drop to the support of the descending channel.
-26.27% drop to the anticipated support of the expanding triangle.
-50% drop, likely as a squeeze under extremely negative news.
Regarding growth and resistance zones:
+65% rise to the resistance of the internal channel.
+110% rise to the resistance of the external channel (and if a diamond pattern forms, then its boundary).
+246% rise as a second attempt to break out of the descending channel.
+440% rise as a potential realization of diamond pattern pricing (if it forms).
All of this should be factored into your trading strategy, even the less likely scenarios.
I'll share the execution of the previous trading idea in my TG. I've also marked it on the chart.
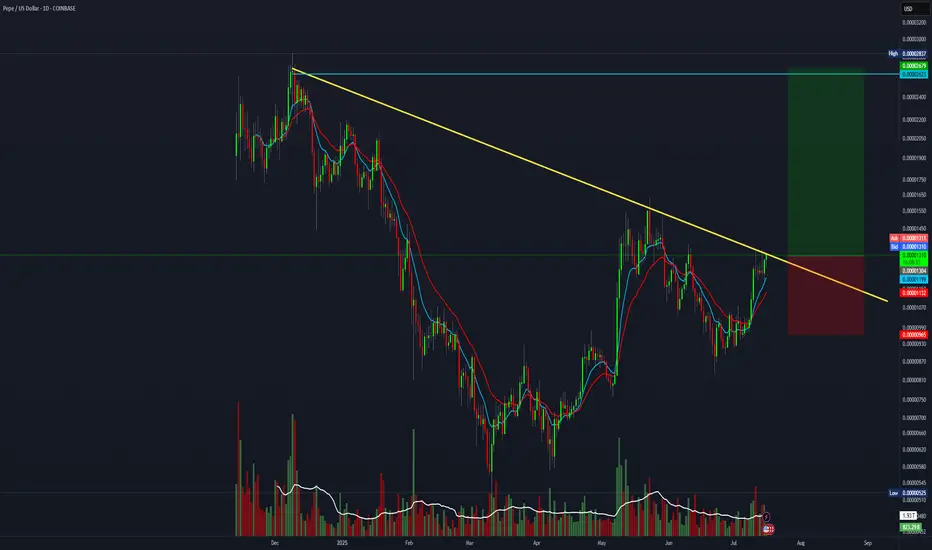
4:1 R:R trade setup for PEPEAre you a fan of memes? This trade setup offers a 4:1 R:R
Entry: 0.00001308
Stop Loss: 0.000009649
Target: 0.00002679
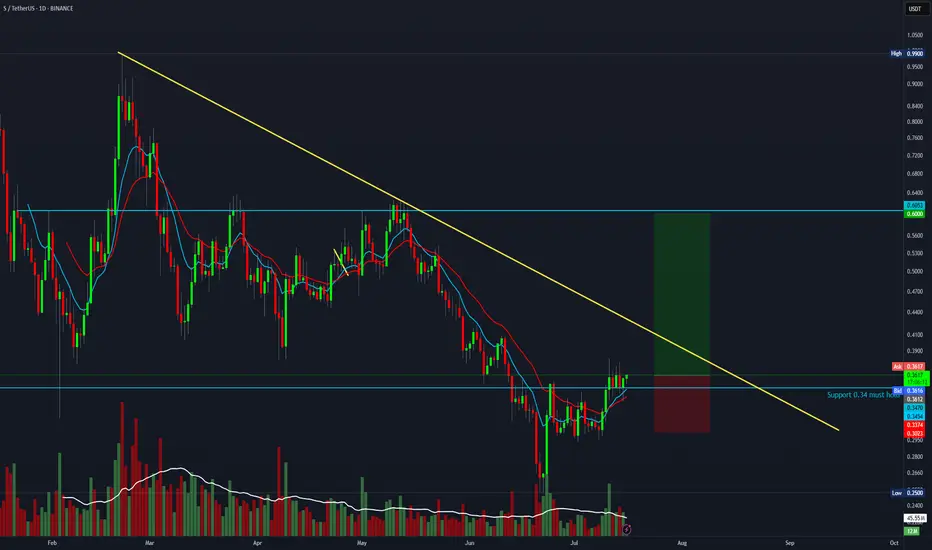
Trade setup with a 4:1 R:R for S (formerly FTM)BTC is likely about to continue its move toward 135K — if you're a bull, this is a solid setup with a 4:1 R:R.
Entry: 0.36
Stop Loss: 0.30
Target: 0.60
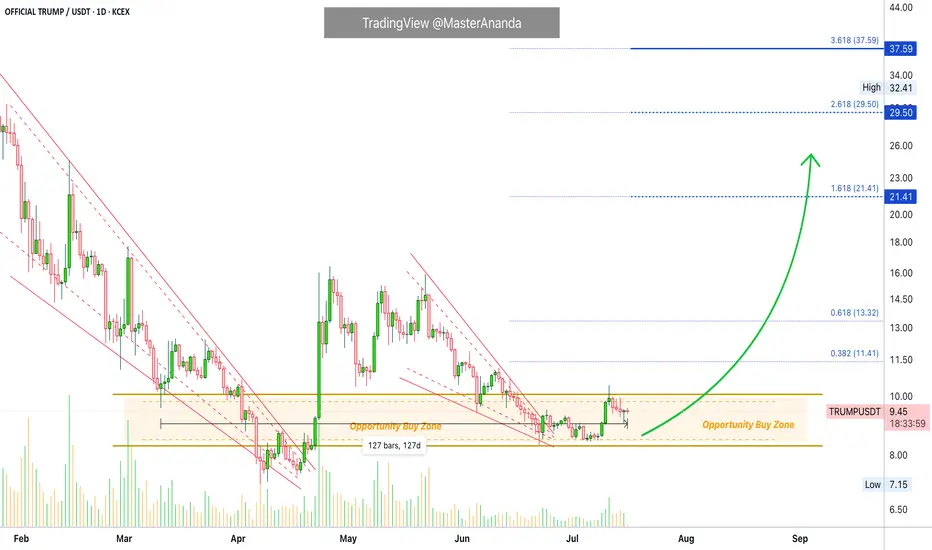
OFFICIAL TRUMP Trading Within Opportunity Buy Zone—About To ExitThis is the last chance to get OFFICIAL TRUMP (TRUMPUSDT) within the opportunity buy zone, the best possible entry prices before a major bullish wave.
Good morning my fellow Cryptocurrency trader, this market has endless opportunities to offer. There is always a second chance; it is never too late.
This "Opportunity Buy Zone" has been available only once briefly before the current period. The first three weeks of April. The second entry into the opportunity buy zone within a higher low happened in June and has been active for 41 days. Time is running out.
Since 11-March, when the current zone was activated through present day, we have more than four months. That's four months of consolidation, sideways... The market can remain neutral only for so long, and it isn't bearish anymore.
The downtrend ended with the 7-April low, the big red falling wedge. After this date the market started a recovery and then we have a retrace—the small falling wedge—and within this retrace market conditions remain bullish based on a higher low.
The main low and market bottom happened 7-April 2025 and the higher low 22-June 2025. This means we are already on the bullish train.
The higher low will lead to a higher high which simply means higher prices. Let's skip the technical analysis and move to the good part.
Maximum growth
How do you see the market right now? How do you see TRUMPUSDT?
It is not going to be the same forever actually, we are expecting big change.
All those days going sideways, down, boring, the market retrace; when it changes it will be so much different. Imagine, visualize, 100%+ in a single day. Then repeat this process over and over. Still some swings and corrections, but that is how you get to 1,000%+ or even 2,000% growth in 30 days.
The meat of the bullish move can happen within 1-2 months. It can also take 4-6 months. What happens is that the start date is not the date when prices start to rise fast but the date the market hit bottom. This means that we are already three months in (100 days) into this bullish wave. Why? Because the low happened 7-April. When you get a strong bullish breakout and the market peaks after two months, total duration of the bullish cycle wouldn't be two months but five months.
We are already on the other side. Now that the next low is in, TRUMPUSDT will be moving to produce a higher high.
Patience is key. The best is yet to come.
Hold strong; rest easy... You will be happy with the results.
Namaste.
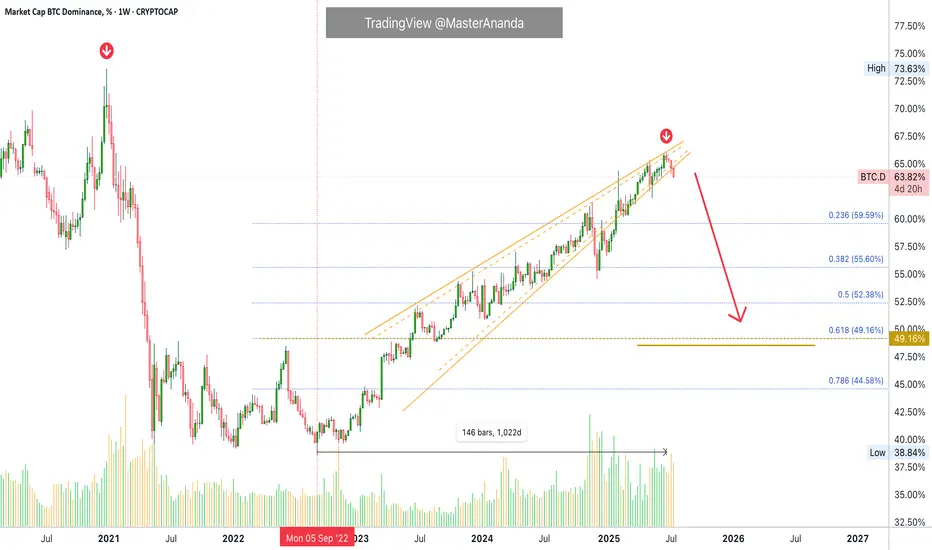
Bitcoin Dominance Long-Term · 1,000 Days Long Uptrend BreaksBitcoin Dominance Index (BTC.D) has been on an uptrend since September 2022, an uptrend more than 1,000 days long.
This uptrend produced a rising wedge pattern and this pattern is as bearish as it gets. During the entire time, from September 2022 until June 2025, BTC.D never ever produced more than 3 consecutive weeks red. Now, in July 2025, we are witnessing the fourth consecutive red week, a major bearish signal. The start of a new downtrend.
The last time BTC.D went bearish was December 2020. The index, as Bitcoin grew to new all-time highs, produced a drop from a high of 74% to a low of 39%. Reflecting strong demand for the altcoins and a very strong rising altcoins market. We are about to witness something similar, better or the same.
As Bitcoin Dominance moves down, the entire altcoins market will move up. Bitcoin will grow together with the altcoins. Everything—Crypto—will grow.
Namaste.
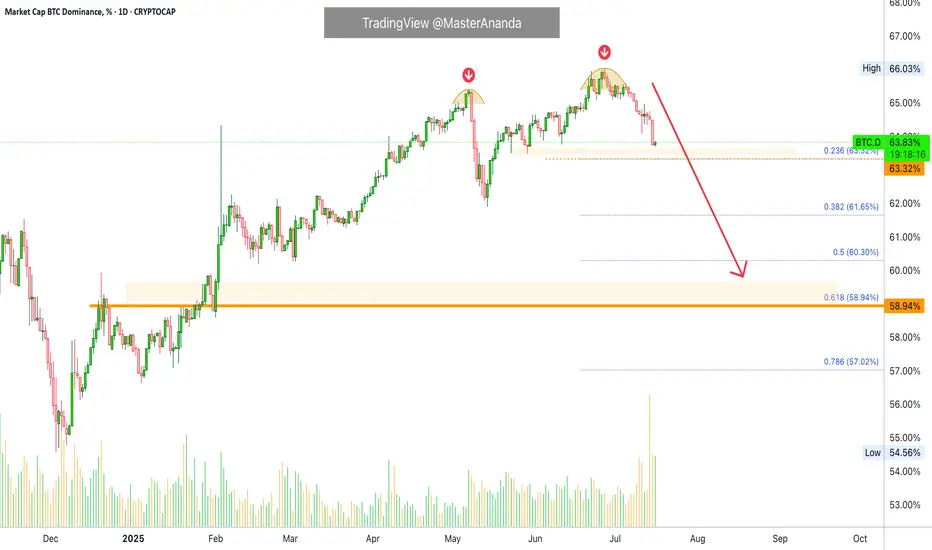
Bullish Altcoins · BTC.D Highest Bearish Volume Since Feb 2021The altcoins market is about to have its strongest and biggest bullish cycle since 2021, or possible ever. We are entering the strongest altcoins season in the history of the Cryptocurrency market.
Good morning my fellow Cryptocurrency trader, I hope you are having a wonderful day.
Bitcoin will continue growing, that's old news but let's start by getting this out of the way.
The altcoins are already waking up from major lows and all-time lows and what follows is something hard to comprehend. The hottest bull market ever for the altcoins. Bitcoin is already far ahead.
On the 14th of July BTC.D (Bitcoin Dominance Index) produced the highest volume bar in more than three years, since February 2021. This happened after a double-top and only after a drop was already confirmed. In this way this signal carries extra-strength. The 14th of July session ended up closing red.
We all know that Bitcoin Dominance Index goes down only when the altcoins move up. The fact that we have the highest volume in years on a daily basis signals the start of the altcoins market major bull-run. Sustained growth for months and months and months.
Get ready and be prepared. The confirmation is already in place.
The altcoins market is heating up. Crypto is going up.
The wait is over.
Namaste.
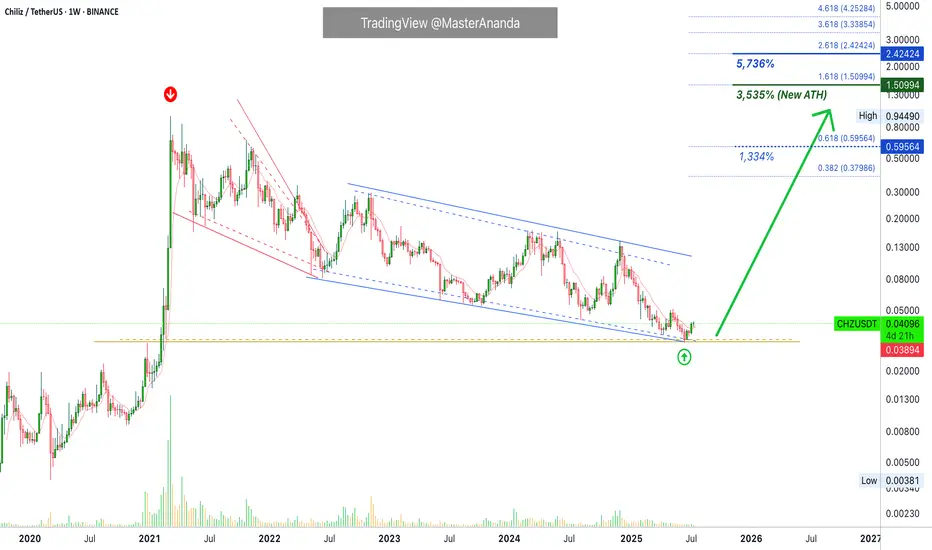
Chiliz Hitz Bottom · Opportunity Buy Zone (PP: 3,535%)Chiliz is trading at a true bottom right now after producing the lowest price in more than three years. The lowest since February 2021. No need to worry though, an early recovery is already happening and we are sure the bottom is in.
The past three weeks have been green while CHZUSDT managed to close above EMA8. This means that the trend is changing or is about to change and we know it will change because we are right in front of the 2025 altcoins bull market. Chiliz will not stay behind, it will also grow. We don't know how strong but there is plenty of room for rising prices. You will be surprised by what the market does.
What the market does is to condition you in some way. First, you become conditioned to seeing higher prices, unlimited potential and that's the start of the bear market, long-term a downturn. But this isn't the end.
When you are conditioned to seeing the market go down, more down; down, down, down, forever more, then it changes suddenly, as if by surprise and prices start to grow. The growth feels strange because it is something not seen in a while and we wonder, will it last? I don't know.
That's the first answer if you don't have access to years of data and this amazing chart.
Seeing the chart long-term coupled with marketwide action and what Bitcoin does, yes, the market growth will last a long time because an uptrend means higher highs and higher lows.
Right now we are looking at the best possible entry prices, an opportunity buy-zone. Buying now can result in incredible gains in the coming months.
Thanks a lot for your continued support.
Namaste.
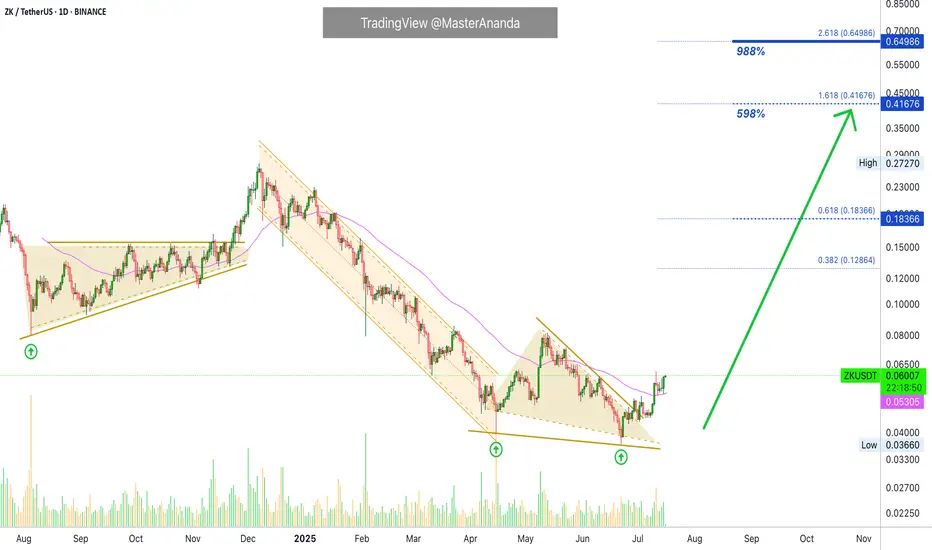
zkSynch · 988% in the Coming Months · 2025 Bull MarketHere is another pair that is safely trading above EMA55. Notice that after this level was initially conquered 10-July what followed was a retest. Two red candles pushed prices lower and the level held as support. With this, EMA55 is now confirmed and zkSync can easily grow. Mid-term.
When the trading goes above EMA89 we say the long-term bias is active, and only when the close happens above the next EMA (or MA) we can say the long-term bias is confirmed. Just some technicalities but please, follow me.
We can theorize about the bottom low, the correction & retrace or, we can go straight to just what you want to know. Let me guess... How far up can ZKUSDT (zkSynch) go? Right? Of course!
The new all-time high targets, conservative targets, sit at $0.41 (598%) and $0.65 (988%). There is an easy target before reaching a new ath at $0.18 for 208%. You can use this one if you like to trade more based on the short-term but if you want higher profits you need to aim higher. You have to wait.
The wait is not long because bullish action is already on. It is already happening and will continue to happen; growth will intensify; momentum will grow. Market hype, prices shine, aiming high, ride the ride of your life to a new all-time high.
The timing is right you can't go wrong. There is nothing better than buying today and tomorrow seeing your portfolio 100% up, that's only the start. Expect 20-30X grow by the time the bull market is set and done.
2 months only? I don't think so. Crypto is set to grow long-term.
Plan now, prepare now and reap the reward. Persistence, perseverance and consistency pay. Work hard and smart. Do you what you want. You are blessed and you deserve the best.
Namaste.
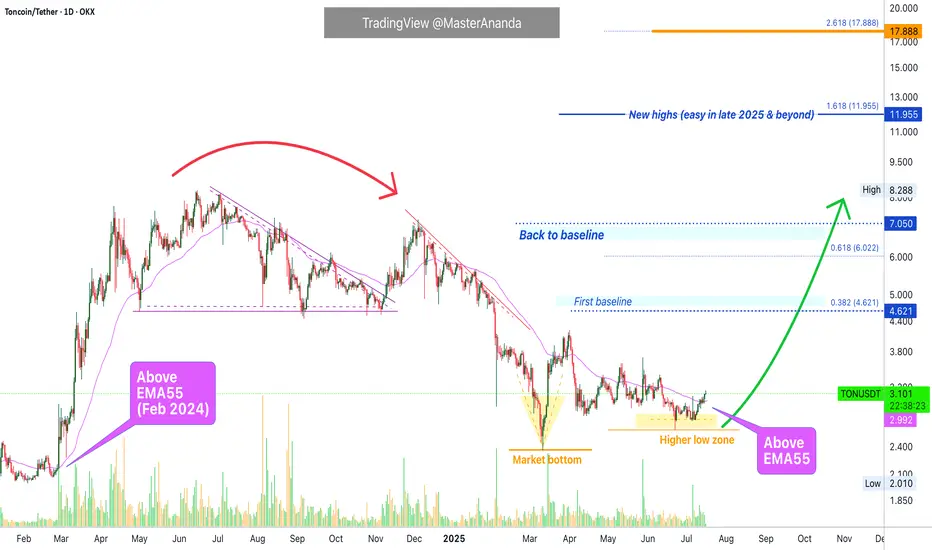
Toncoin Update v2.0 · How To Trade For Maximum ProfitsI am keeping the same chart drawings for simplicity. We continue to move forward on Toncoin and this is one of the trio we track and trade: Notcoin, Toncoin & Dogs.
Daily TONUSDT is now trading above EMA55. When this happened back in February 2024 Toncoin produced its biggest advance ever. The same is likely to repeat multiplied by ten.
(I just updated the targets for your convenience. $12 & $18 have been added to the chart.)
» July 2024 TONUSDT moves daily above EMA55.
» EMA89 is now sitting at $3.10. This resistance level is also about to be conquered. This simply means that the bullish bias is fully confirmed.
» MA200 is still a bit further away but once TONUSDT moves above this level, currently at $3.59, we can expect long-term growth. That is, six months or more. Can be 8, 9, 12, 14, 16, etc. Just beyond six.
"Toncoin will move straight up," this is just a way of saying things. There will always be some days red, some days green, some red some green but the trend, tendency and bias is bullish.
When you see prices rising and you start to enjoying higher profits do not be scared by sudden drops. These are shakeouts and only meant to scare you. Hold strong.
Toncoin can turn red 2 days, 3 days, even 6 days or 9 days and still remain 100% bullish and as soon as the retrace ends you will get additional growth.
It is all fine and great in the Crypto market.
Thanks a lot for your continued support.
Namaste.