APT - HUGE POTENTIAL (130+% SPOT) You probably forgot about this altcoin but it is justified. Downtrend since 2023 and lower highs, lower lows but....
If we look more close and use tool fixed price volume we can see that price is above VAL (Value area low), we had break through but price returns..Also good reaction of FVG (Fair value gap).
Now, we can try buy this coin and have some stop lose. Price is in range 172 days and all people forget abut this coin. Analysis is right only if we close daily candlestick about 6$.
Stop lose can be below 4.4$ which is 6-7% of losing.
Second entry is monthly level at 3.3 and stop lose should be below the lowest low 3$.
For me is great opportunity because risk reward is excellent.
Ivan
Altcoinseason

Opening A Small Position In FARTCOIN HereGood Morning Trading Family,
I may be a little early here, but at $1.00, I can't resist. I am picking up a small position in FARTCOIN here. I have three targets above. Each will eventually be hit IMO, but for now, I will only be shooting for TARGET #1. I may sell half at that point and let the rest ride.
Now, here are the technical reasons for making my entry here without waiting for my indicator to signal.
First of all, there are three trendlines, all significant, all converging at this one particular point, making this a powerful area of confluence!
Secondly, we broke to the topside of that descending trendline but never really came back to kiss mamma goodbye. Today we are doing that! This is a patent technical move that indicates healthy price fluctuation and is exactly what I have been waiting for.
Third, the VRVP indicates a ton of volume in this area (mostly buyer), which will be tough to break below without significant FUD, which, of course, is always a possibility.
Finally, all of my lower indicators show this thing is starting to get oversold: RSI, MACD, Chalkin MF, HA.
If we do dip lower, I will simply increase my position unless I hit my SL first. My SL is around .78 with my projected first target at 1.66 for a nice 1:3 rrr.
Good luck, all!
✌️Stew

Sui chance for +60% on this zoneSui continue to grap liquidation but on the monthly and weekly timeframe we are still bullish.
I just saw good zone for trade. At 3.15 we have daily EMA + fibonacci 0.64 + Daily FVG.
I will suggest to add some leverage because invalidation is close to 2.9.
In this mid term bull market of altcoins we can see that SUI has good performance.
Ivan

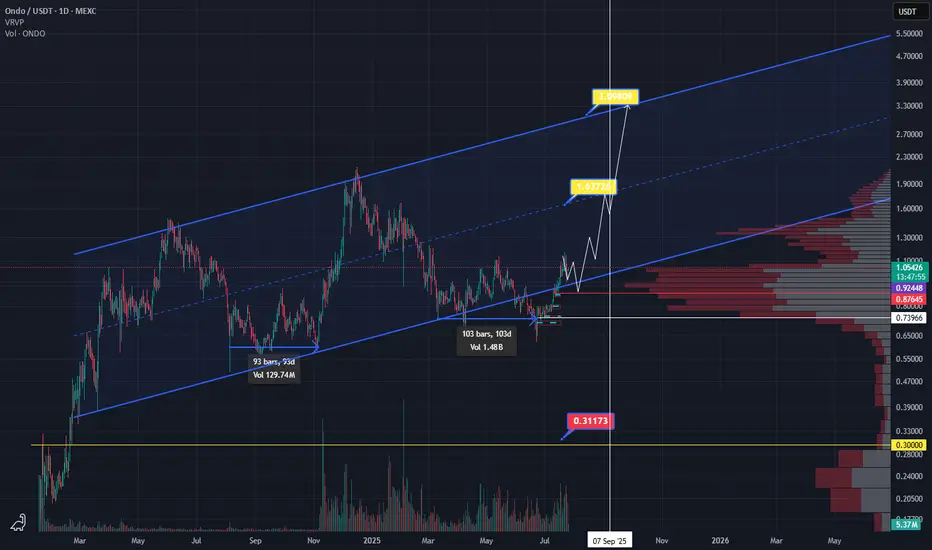
ONDO Bullish structureOndo is back to bullish scenario. We can see long accumulation more then 100 days. As you can see price 0.9 is back and then bullish coming. So 0.85 and 0.9 have to hold and we can buy the dip.
Keep in mind if Ethereum start to attack ATH, Eth ecosystem will grow much higher. So watch this level in next couple weeks and months.
Long GODS - Target 17 Cents - 1:3 RRRTrading Fam,
As I continue to gain experience with my AI-created indicator, I am learning to remain patient and wait for the perfect setups. We have one here on GODS. You can see that we've returned to the bottom of a larger triangle and are using it as support. Additionally, we are within a favorable liquidity block where buyers tend to accelerate the volume. My indicator gave the BUY signal 2 weeks ago, and there has been plenty of sideways accumulation since the signal flashed. Probability suggest that GODS will pump soon.
I'll be targeting 17 cents with a SL at 10 for a 1:3 RRR.
Let's go!
Stew

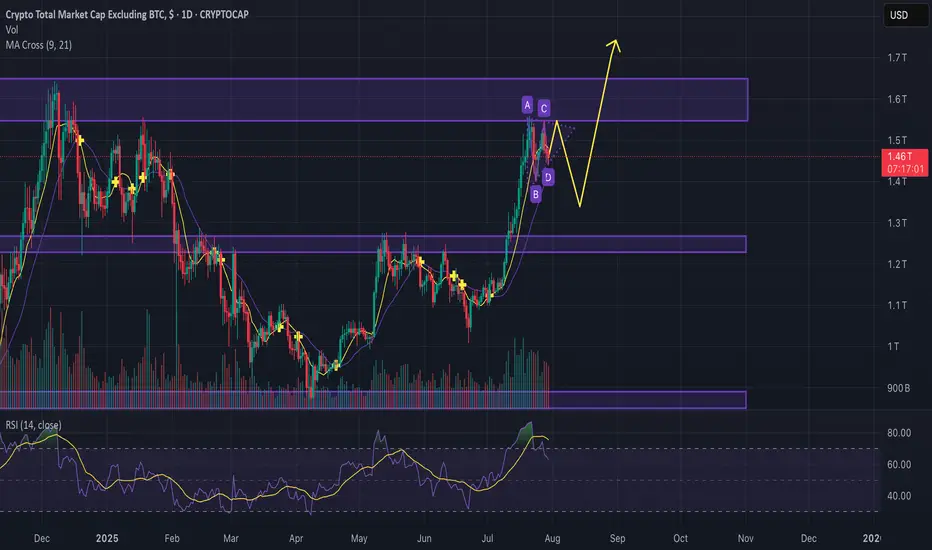
Is altcoin season over before it even started?Guys,
Gonna break down the situation on the chart to see where we can go next with the altcoins.
We see the key resistance levels and now we moving in kinda bullish pennant, but considering descending volumes we can easily test the support line and go back to the 1.25T. (maybe even lower)
After that, seems like we can try to go back and break the 1.64T resistance zone and previous ATH.
Anyway current market is going to be way more different from previous cycles, because huge institutions can feel nice only in hyper volatile, so divide your strategy between short, mid and long term investments to take profits.
Good trades and share your thoughts down to see what others think.
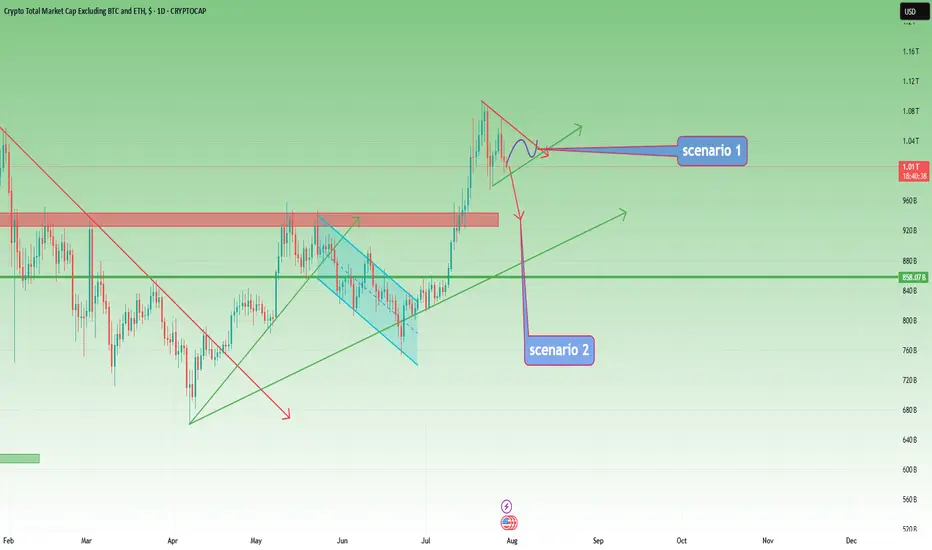
TOTAL3 – Still Bullish, But Waiting for Clarity
In my previous analysis on TOTAL3, I mentioned the high probability of a correction, but also noted that I didn’t expect the 925–940B zone to be reached.
And indeed, price reversed early — finding support around 975B before moving higher.
However, after a push up to 1.07T, the market has started to pull back again.
📊 Current Outlook – Two Scenarios I’m Watching:
Bullish Triangle:
Price may continue to consolidate into a symmetrical triangle, then resume the uptrend from there.
Deeper Pullback into Support:
The market could retest the 925–940B zone, a key support area, before bouncing back up.
⚠️ Bearish Reassessment?
Of course, if price breaks back below 925B and stays there, we’ll have to reconsider the bullish case.
But for now, the trend remains intact, and there’s no technical reason to panic.
📌 My Plan:
I already hold a bag of alts, and I’m not adding for now.
I’ll wait until the pattern becomes clearer — whether it’s a triangle breakout or a dip into support.
Until then, I’m sitting comfortably on what I already hold.
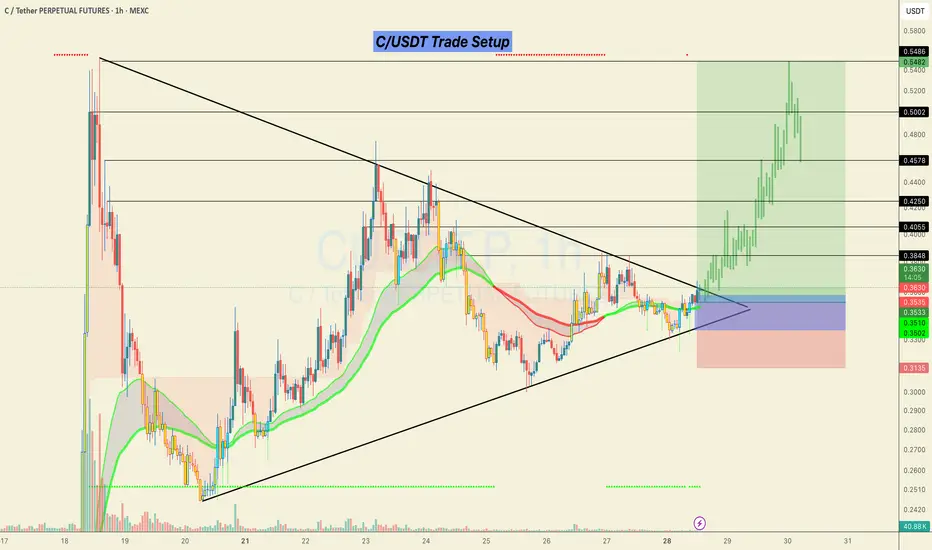
#C/USDT Looks ready for a 50% bullish move.C/USDT Trade Setup 📉
Currently forming a strong breakout structure after a long consolidation inside the triangle.
📌 Accumulation Zone:
0.3350 – 0.3580
🎯 Targets (Black Horizontal Levels):
0.4055
0.4250
0.4578
0.5002
0.5486
🛑 SL: Below 0.3135 (previous structural low)
Price broke out with solid momentum and retested the breakout zone. As long as we hold above the EMAs and the structure remains intact, continuation toward higher levels is likely.
This is a low-risk, high-reward setup as long as the risk is managed properly.
> Not financial advice. Trade at your own risk.
Do hit the like button if you want me to post more of these setups here.
Thank you
#PEACE
OP - Chance for +70%After weekly close we can see the volume coming in. On the chart we have resistance which if we break through then we can expect price 1.4 which is +70% from now.
If I have some advice for leverage trading I think its better to wait for daily close and then hunt retest if happens.
Rotations of money started already and I don't think is it a case for long run. We need to act, take profit and watch something else.
Like if you like analysis and idea.
Ivan

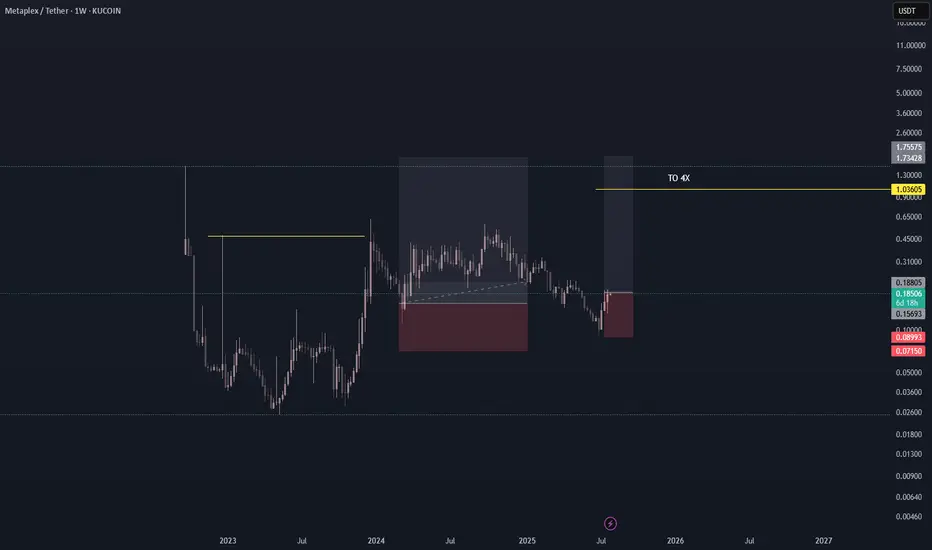
METAPLX/USDT BUY LONG FOR 4XCRYPTO - METAPLEX/USDT
EXPECTED RETURN TO 400-500%
** Crypto investing is highly volatile, you may lose all invested money, please keep it in mind and invest what you can lose and be ok.**
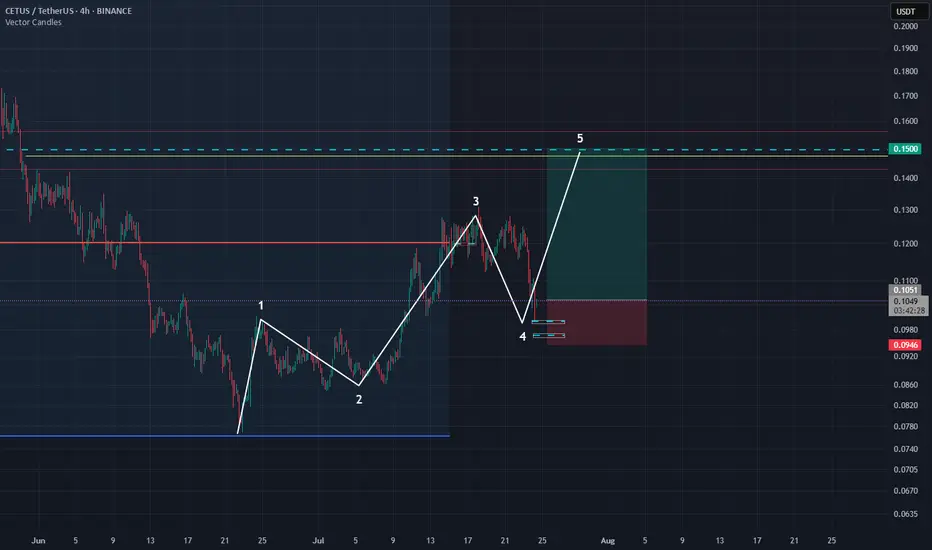
Cetus long setup, RR 4 There is big chance for leverage 3-4 if you want to try this coin. Invalidation is bellow if we looking based on Elliot wave theory.
Be aware if Bitcoin try to corrective more we will have deeper retracement.
We have one more zone bellow so if you want to try second zone, invalidation is the same but you can take much higher leverage
Ivan
Now We WaitTrading Fam,
In my last video, I mentioned how I had been learning to trade more patiently, giving myself those high-quality, high-probability winning trades. This is a perfect time to illustrate that strategy.
With our altcoin market overheated, I am expecting more rest, accumulation, and pullback in many of our alts. The selection of even decent entries is very slim. It's time for us to sit back, wait, and let the trades come to us again.
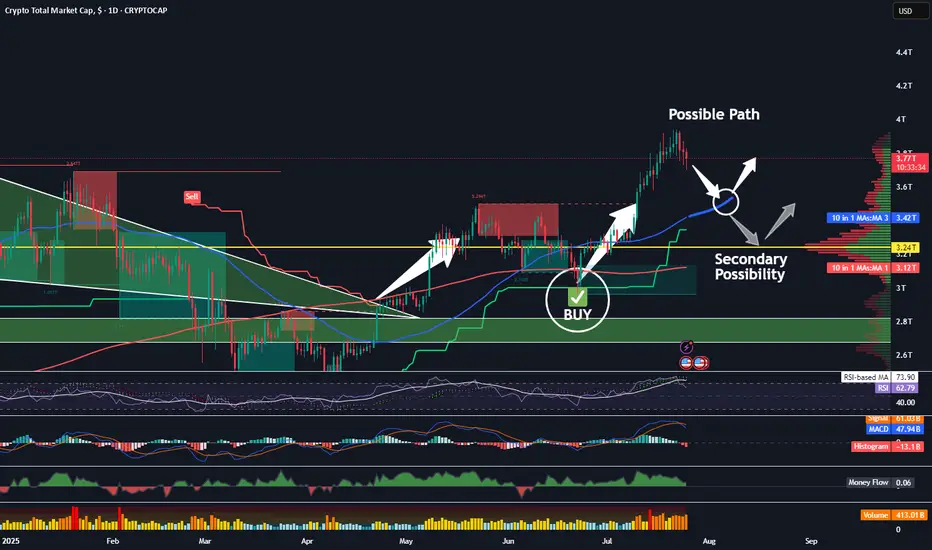
The TOTAL chart shows us more clearly what may occur. Let's discuss a few important indicators on this chart.
First of all, we see my indicator popped a BUY signal right around 3T. We had a safe bet at that point; we were going to see quite a bit of buying action in the altcoin space. Indeed, we did. The altcoin market increased by about 25 percent and went all the way to 4T, at which point the sellers came back in. Now, we are in the middle of a little bit of a pullback, and I think there could be more to come. I am expecting at least a touch of that rising 50-day SMA, currently at 3.4T.
Supporting my thesis here are the crossover of the RSI to the downside of its 14-day MA, the MACD cross, the Chalkin money flow decrease, and the HMV indicating high volume during these sell-offs. Leverage is being liquidated. This is healthy!
It is possible that the total market cap could drop even further, all the way down to that 3.24T PoC on the VRVP. That is where we see most of our volume in alts has occurred. Keep these two targets in mind. Once hit, I will begin looking for more trade entries once again.
✌️Stew
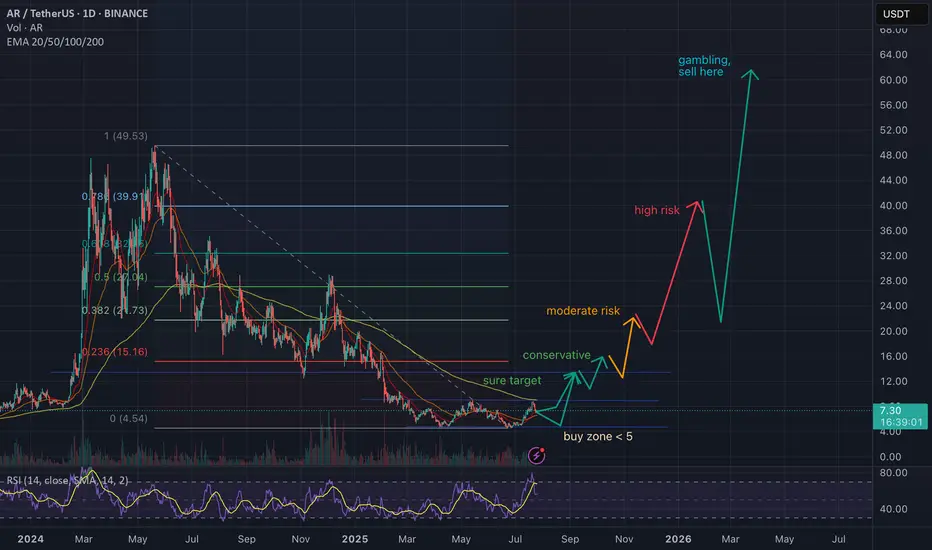
ARUSDT: Crypto Summer Game PlanBINANCE:ARUSDT
RWA + AI coin, two narratives that will be hot
Not inflationary, 99% supply circulating
People really use it for permanent storage
Main CEX liquidity is very thin in AR -> possible God candles like in previous history
Possible supply shock at late stage
Main risk is community governance and hacks. Otherwise in case of altseason this should meet the marked targets. Preferable accumulation zone is <5 USD, most probably not available anymore.
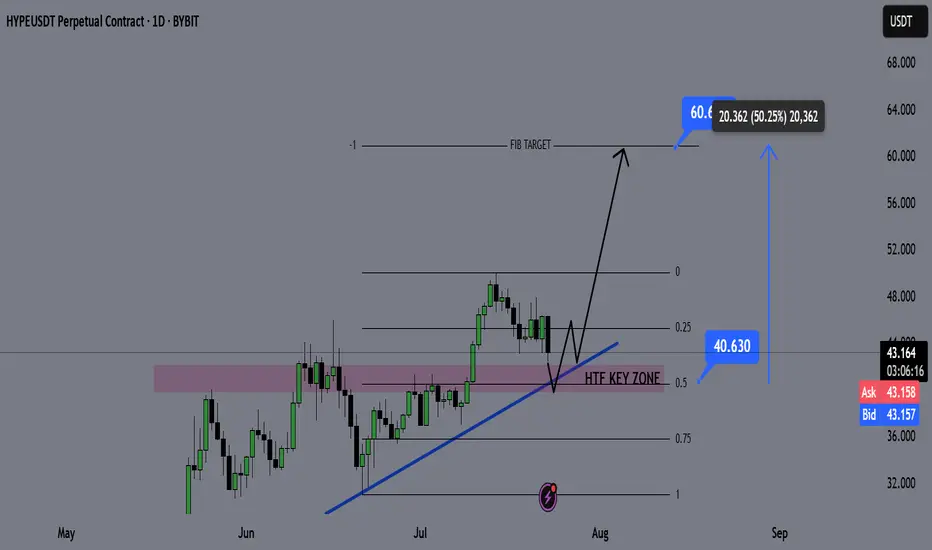
HYPE Swing Long Opportunity - Altcoin Season📌 Fundamental Sentiment:
The crypto market — alongside broader risk assets — continues to gain traction. This momentum is largely fueled by rising expectations of policy shifts in the U.S., with Trump intensifying pressure on Jerome Powell and advocating for aggressive rate cuts from the Fed.
📌 Technical Analysis:
HYPE is approaching a key HTF bullish trendline, and confluences are stacking up in the same region:
✅ HTF Demand Zone
✅ Equilibrium (EQ) of the HTF bullish trend
✅ Bullish Trendline Support
These three HTF confluences overlapping at the same price zone indicate a high-probability setup for a significant bounce and a possible swing long opportunity.
📌 Gameplan:
Price hits HTF bullish trendline
HTF demand zone gets tested
EQ level tapped → discount offered to buyers
📌 LTF Confirmation Criteria:
I’ll wait for:
A 1H swing break
A strong 4H rejection candle
These will confirm momentum shift. If confirmed, I’ll enter a swing long.
🎯 Target: $60
💰 Potential gain: ~+50%
❗ Stop-loss: Below the swing low that triggers the LTF confirmation
—
🔔 Follow for daily setups and weekly macro recaps
💬 Drop your chart or questions below!
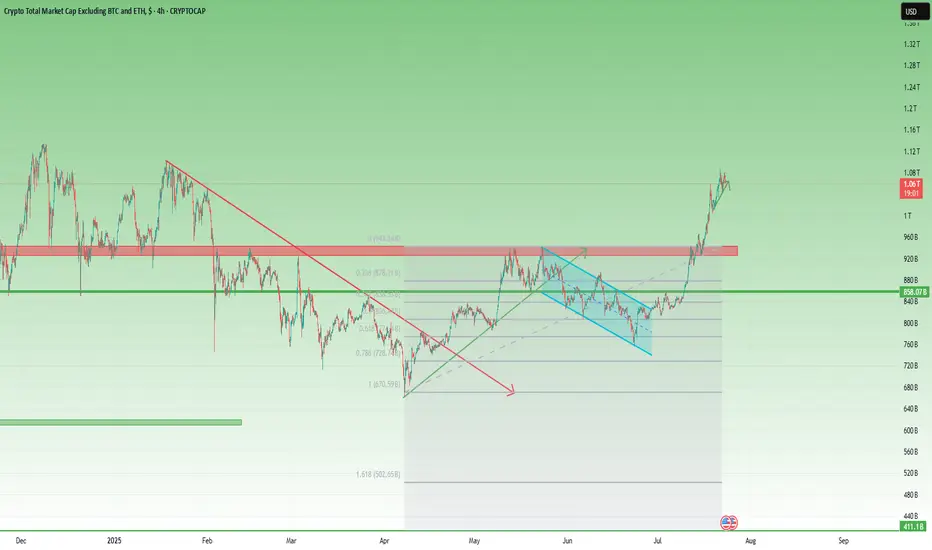
Total3 – Back Above 1T, but Will It Offer a Second Chance?📈 What happened since April?
After the sharp low in early April, Total3 began to recover steadily.
Toward the end of the month, it broke above the falling trendline that had been holding since January — a key technical shift.
This triggered a strong recovery rally, pushing total altcoin capitalization (excluding BTC & ETH) to the 930–940B resistance zone.
📉 Then came the pullback…
Price printed a double top near resistance, followed by a drop — but not a bearish one.
Instead, the correction was orderly, forming a bullish flag, with the low landing right on the 61.8% Fibonacci retracement. Classic healthy structure.
🚀 The latest breakout
Earlier this month, Total3 launched a very impulsive leg up, reclaiming the 1 trillion level with strength.
At the time of writing, we’re trading back above 1T, and momentum remains on the bulls’ side.
However, the chart does look a bit overextended in the short term, suggesting a correction could follow soon.
🧭 Trading Plan – Will We Get a Retest?
The textbook play would be to wait for a deep pullback toward previous support levels.
BUT – I don’t believe we’ll get a full retest of the breakout. Altcoins may stay elevated or correct only modestly.
Instead, I’ll be watching the 1T zone and slightly below — that’s where I’ll look to load up on interesting altcoins.
📌 Conclusion:
Total3 has broken structure, reclaimed key levels, and is showing classic bullish continuation behavior.
The market may not offer you the perfect entry — but small dips near 1T could be all we get before another move higher. 🚀
Be prepared. Don’t wait for perfection in a market because rarely gives it.
Altcoin Season May Be Real This TimeBitcoin Dominance Finally Breaks – Altcoin Season May Be Real This Time
Since late 2022, Bitcoin Dominance has been on a steady rise — and during this time, the vast majority of altcoins have bled heavily, losing value both in USD and BTC terms.
The long-awaited “altcoin season” became a meme more than a market event.
Every rally was short-lived, and rotation never truly materialized.
Until now...
________________________________________
📉 A Technical Break That Matters
Looking at the BTC.D chart, we finally see something meaningful:
➡️ A clear technical breakdown under confluence support given by the horizontal one and the rising trend line, which held for months and provided the structure for BTC outperformance.
At the same time, Bitcoin is stable around the 120k zone, and the price action suggests strength — not mania, not collapse — just solid consolidation at high levels, and most probably preparing for new ATHs.
This environment historically tends to be favorable for alts.
________________________________________
USDT Dominance (USDT.D) Also Pointing Lower
The USDT.D chart adds even more confluence to the idea:
• It's now pointing towards support
• The structure suggests there’s room for a further drop, which historically means more money flowing into risk assets — particularly altcoins
When stablecoins dominance drops, it usually reflects increased market participation and risk-on behavior — exactly what altcoins need to finally shine.
________________________________________
🔍 What Am I Doing?
I’ve already started buying selected altcoins and I'm looking to add more on dips.
This technical shift is meaningful. It’s not about catching hype, it’s about recognizing a real potential rotation.
In conclusion, I’ll be looking for strong altcoin setups to buy on pullbacks,
as I believe the next weeks and months could offer the kind of upside that can at least double my investment (yeah, yeah, I'm not "to the mooner, hoping for 100x ).

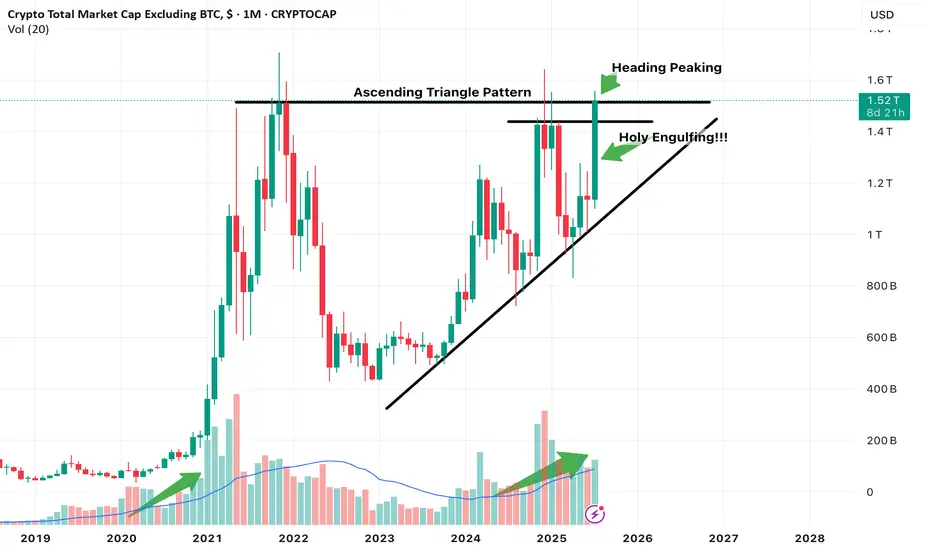
When Altseason? Clues in other chart Ex) #1Hi guys.
So Its no secret bitcoin has been ripping.
We are at new all time highs, and in full on price discovery mode.
I recently posted an ongoing macro analysis on ADA (Cardano) supporting my theory that it is one of the better alts to be investing in for alt explosion.
I want to look elsewhere to see if i can find supporting evidence that its time to invest or trade altcoins.
One chart that can be used is the Total Market Cap of Crypto excluding Bitcoin.
This chart showcases total altcoin market capitalization and its movements.
I believe certain Technical developments can really help us gauge at whats to come.
NOte this is on the 1 Month timeframe aka looking into Macro developments.
Just focusing on Candlestick action.
Notice we have been in this ascending channel trend, along with a potential Ascending triangle pattern development which if breakout occurs with confirmation can push Altcoin market cap higher indicating that liquidity is entering altcoins which indicates potential Uptrend.
The month of July so far is in position to print a massive engulfing Bullish candle, which is a great sign.
The upper part is also peaking its head above the Horizontal resistance line. Need to observe confirmation of this breakout. Look for it in smaller timeframes, ill look for it in the 3 day or 5 day.
We are also in position to print a higher high first time in a while.
Notice also Volume. We are seeing currently similar increasing volume as previous alt coin market cap expansion.
Keep an eye out on more posts to add to evidence that supports we are in the verge of potential altcoin season.
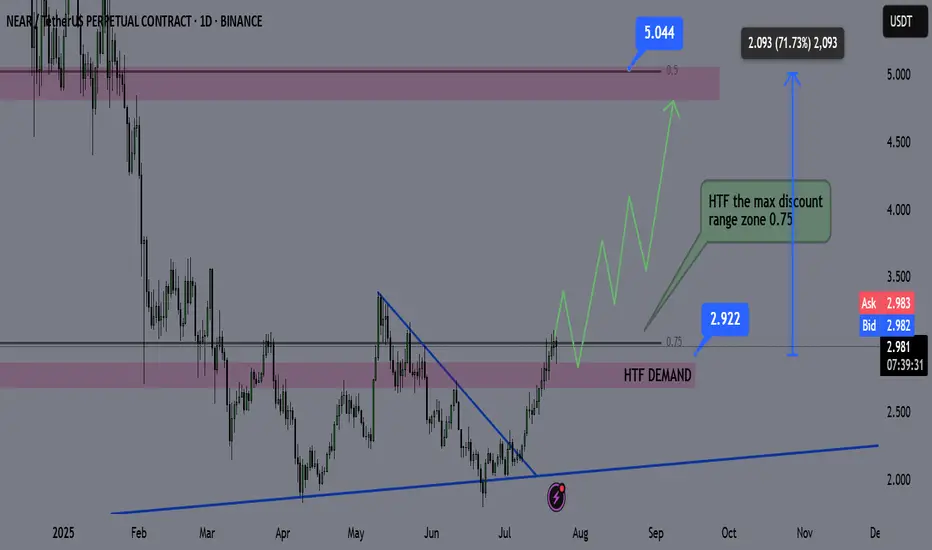
NEAR Swing Long Idea - Altseason 2025📌 Fundamental Sentiment:
The entire crypto market is rallying, alongside other risk assets. This is mainly driven by U.S. policy expectations — Trump is pressuring Powell to resign and aggressively pushing for rate cuts from the Federal Reserve.
📌 Technical Analysis:
NEAR has recently broken and closed above a significant HTF support/resistance level.
Additionally, we’re now trading inside the 0.75 Fibonacci retracement level of the HTF bullish trend — which I define as the maximum discounted zone.
For this setup, I’ll apply my Deep Range Theory (DRT):
If price dips below the 0.75 zone and accumulates there,
Then breaks above 0.75 after a period of consolidation,
→ It signals that price aims for the 0.5 level of the range and will likely run HTF liquidity for either reversal or re-accumulation before continuation.
📌 Gameplan:
✅ Break and close above HTF S/R
⏳ Waiting for break and daily close above 0.75
🔄 Retest to LTF demand (4H–1H)
📈 A bounce on LTF demand will trigger the long setup
📌 Trade Management:
This is a mid-term swing trade, as I’m following the HTF bullish trend.
🎯 Target: $5 — which is approximately a +70% move from current price.
❗Risk Management:
If price makes a daily close back below 0.75 after breaking and closing above, I will exit the trade to preserve capital.
I’ll also monitor macro sentiment closely. If there's a sharp bearish shift, I may consider an early exit before reaching the HTF target.
—
🔔 Follow the channel for daily trade ideas & weekly macro recaps.
💬 Drop a comment below if you have any questions or insights!
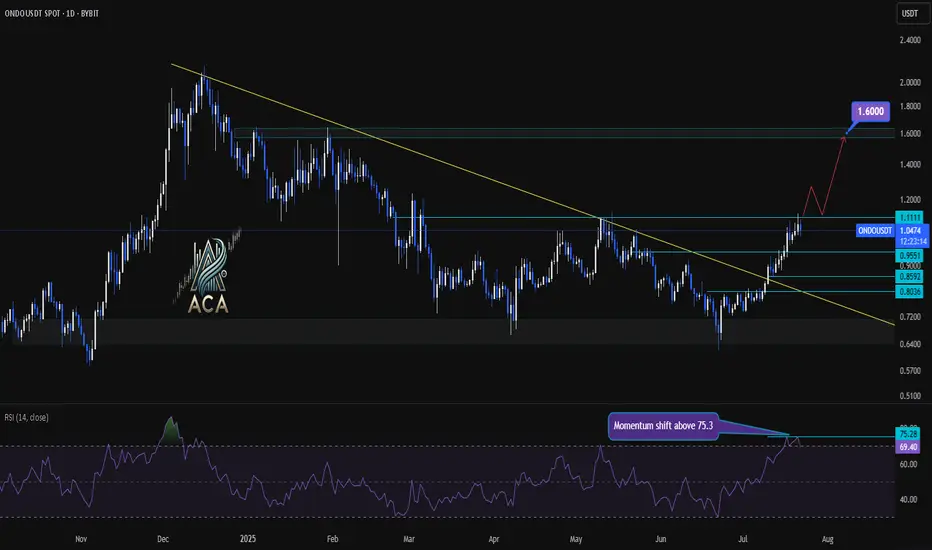
ONDOUSDT Daily Chart Analysis | Momentum Shift & Breakout LevelsONDOUSDT Daily Chart Analysis | Momentum Shift & Breakout Levels
🔍 Let’s dive into the ONDO/USDT daily chart and break down the latest momentum signals, key breakout areas, and targets for bulls.
⏳ Daily Chart Overview
The daily trend shows significant recovery after prolonged downward pressure, with price action now testing critical resistance levels. A key descending trend line has recently been challenged, highlighting a potential shift in market structure.
🔺 Bullish Setup
- Momentum Trigger: The RSI has closed above 75.3, signaling a strong momentum shift and upping the odds for continued upside.
- Breakout Confirmation: Watch for a daily candle close above the $1.1111 resistance level. This would confirm a bullish breakout and could serve as a solid trigger for further upside.
- Trend Line Dynamics: The price has decisively broken above the major descending trend line, which had capped rallies for months—removing a significant area of supply and emboldening bulls.
- Upside Target: Once confirmed, this setup opens the door for an advance towards the $1.60 area, where the next major resistance sits.
📊 Key Highlights
- Daily RSI closing above 75.3 reflects strong market momentum and buyer dominance.
- A daily candle close above $1.1111 can be used as a bullish trigger.
- The long-term descending trend line has been broken, indicating a major momentum shift.
- Immediate upside target stands at $1.60, representing a clear resistance level for profits or further evaluation.
🚨 Conclusion
Momentum is clearly shifting in favor of the bulls as technical barriers fall by the wayside. For traders looking to position long, confirmation above $1.1111 combined with the powerful RSI reading sets the stage for a move towards $1.60—keep these levels on your radar as the setup plays out!
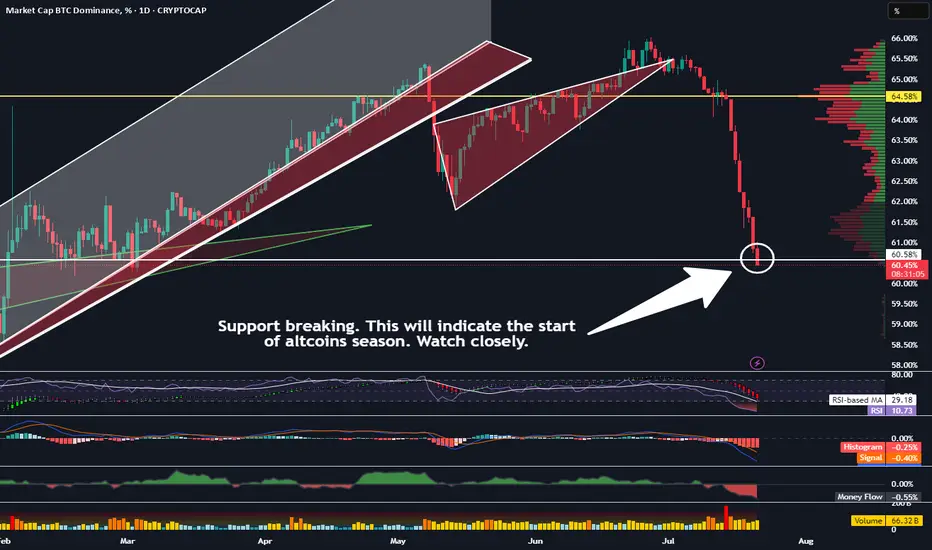
When This Support Breaks, Altcoin Season Becomes Official!Trading Fam,
We have many signs that altcoin season is almost upon us. Solana is breaking important resistance. Eth is nearing its target (both of these posts can be found below). But the most important indicator imo can be found on our BTC.D chart. Dominance has now reached an important support. I was kind of expecting a bounce here. And it still could bounce. But if it doesn't, then I feel like I can officially state that we will be in altcoin season for the rest of the year. Here's what you should be watching. If the body of that daily candle closes below our support today and then a new one opens and also closes below the support, its a wrap.
Let's go!
✌️Stew
Eth and the Altcoin Season Once Etherum retest and breaks previous cycle ATH and LMACD visits the diagonal traced from previous cycles (white dot). An altcoins season might follow.

Drop Your Token – I’ll Do The AnalysisHey everyone! Hope you’re having an amazing weekend !
Want me to analyze your favorite token ? Just drop your request in the comments using this format:
Request Format
Project Name: Bitcoin
Token Symbol: BTC( BINANCE:BTCUSDT )
Important Notes:
I’ll pick and analyze only the first 10 tokens requested .
One request per person — so choose wisely!
I’ll reply directly under your comment with the analysis.
If you find this helpful, don’t forget to Like ❤️ and Share this post with your friends!
Here’s to your success — health, wealth, and great trades! 🚀

DOGE/BTC: HTF Retest Complete — Reversal BrewingDiving into DOGE/BTC, we’re seeing strong bullish confluences that align well with the DOGE/USDT structure and support the idea that the macro low is in.
Looking back across all available data, DOGE/BTC has traded within a clear 7-year accumulation range dating back to 2014, bounded by a defined range high resistance and range low support. This long period of consolidation enabled massive accumulation, ultimately leading to the first breakout in 2021, which rejected at the highs, pulled back, and then exploded into a cycle ATH.
Since that 2021 high, DOGE/BTC has been in a 4-year downtrend, retracing back into discount pricing, right into the range high of that original accumulation zone — which now acts as a major HTF demand level and last point of support before the original breakout.
📉 What’s happened recently?
- Price swept 2024 swing lows (SSL)
- Tagged the HTF demand zone
- Retested the 2021 breakout level (accumulation range high)
- Coiling inside a descending wedge with contracting volatility
This entire region is a key reversal zone from both a structural and psychological standpoint. It’s where we typically see major trend shifts form, and the structure suggests we’re forming a HTF swing low and bottom from this area.
🧠 Add this to the confluence from DOGE/USDT — which also appears to have printed its bottom — and the case for a macro reversal gets even stronger.
As this wedge tightens and price continues to compress against long-term support, I’m anticipating an explosive breakout that kickstarts the next leg of the HTF uptrend — effectively a continuation of the original breakout from the 7-year range.
5D:
