Ski Mask Dog | SKI | Long at $0.06Whelp... I'll leave it to the "crypto bros" to explain the value and utility of Ski Mask Dog COINEX:SKIUSDT , but Congressman Mike Collins knows something I don't. He's purchased between $10,000 and $150,000 of the alt coin between December 2024 and June 2025 at an average price of $0.08 (assuming the purchases were equally valued). Here is the reference: www.capitoltrades.com
Even if it was only $10,000 of the coin, why would he even bother given the strength of other coins... unless he knows something...
I suspect he does.
Thus, at $0.06, I just filled my wallet with a fair share and I'm going to let it ride. Pure gamble.
Targets into 2028:
$0.12 (+100.0%)
$0.25 (+316.7%)
Altcoinseason!

OTHERS data points to biggest ALT-Season Good Day Investors and traders,
This the OTHERS on the weekly and I have taken some measured moves in what could be expected in time and price.
The OTHERS chart in my opinion is the last form of the higher risk curve which generally happens at the very end of cycles The others does not include the top ten crypto, so it a very good form of risk on.
I have been looking at the OTHERS chart fairly often of recent times because this is the time for it to really outshine Bitcoin and lead the market with fairly explosive gains.
I have marked a couple of possible time lines that could occur and both seem to be lining up in sort of way or another. From what I can see, others has one big wave remaining, and it’s the one you don’t want to miss
The Indicators
Fibonacci retracement
I have placed a potential take profit zone from the 1.272 to the 1.618 levels and anywhere in between. I have added an up trending channel that OTHERS would have to hold to stay somewhat relevant or then could be susceptible to adjustment.
2.RSI
I have measured the first breakout of the RSI from the 2015-17 and 2019-21 bull runs along with this one so far. The one more relevant to us is 2015-17 as this is the cycle we are more closely following. There seems to be a recurring trend of 90 plus bars before a top to OTHERS. One more thing that really stands out to me in the RSI this the first time it has shown a very strong bearish divergence. normally it seems to maintain or gain strength. right to the very end. time will reveal the real issue here.
3. ISO
The average sentiment oscillator to also show very consistent data for us. I have two measurements. The one points to late July and the the other late October. To me this could be the potential ALT-season time frame from July as it fizzles in the October time frame.
My suggestion to you is follow what you have been taught so far, do not get greedy, take profits when they are there and trust your game plan and stick to it. ALT- SEASON can you a lot of money, or lose you a lot of money. By design, its there to take any profits you have may have, or catch any late coming stragglers. Don’t get caught up in the hoopla.
Once again, I ask you for you input, I really want to hear from you.
Check my bio for more links and information
Kind regards,
WeAreSat0shi

From Cold Calling to Whitepapers: Same Game, New ToolsRemember that legendary scene in "The Wolf of Wall Street"?
Jordan Belfort (DiCaprio) picks up the phone to pitch “Aerotyne International” — a company “poised to explode” — operating from… a garage.
The sales pitch is flawless. The story is strong. The potential? Unlimited.
Except it was nothing more than a fantasy designed to move shares from one set of hands to another — at a profit for the seller.
There is a Romanian saying: "Same Mary, different hat"...
________________________________________
Fast forward to crypto
Today, we don’t have cold calls and penny stock brochures.
We have:
• Whitepapers describing revolutionary technology with no working product.
• Influencer threads promising “undervalued gems” to millions of followers.
• Slick promo videos replacing the boiler room pitch.
• Discord AMAs instead of dinner seminars.
The garage is still there — it’s just virtual now, hidden behind a Twitter banner and a Telegram admin.
________________________________________
Human psychology hasn’t changed
The tools evolved, but the emotions stayed the same:
• Greed — “I don’t want to miss the next big thing.”
• Fear — “If I don’t buy now, it’ll be too late.”
• Trust in authority — “He has a big following, he must know.”
Belfort sold the dream of massive returns.
Modern-day devs and influencers sell the dream of “generational wealth” from coins that exist only as code on a blockchain.
________________________________________
The mechanics are identical
1. Create a story.
2. Amplify it through trusted voices.
3. Target an audience hungry for “the next big thing.”
4. Offload the asset onto those late to the party.
Whether it’s “Aerotyne” or “MoonPepeMooning,” the pattern is the same — transfer value from the hopeful to the prepared.
________________________________________
How to not be the exit liquidity
• Verify: A whitepaper is just words. Look for a product, adoption, and revenue.
• Ignore the hype cycle: By the time it reaches you, someone else is unloading.
• Follow the money: Who benefits if you buy right now?
• Remember history: Tools change, human nature doesn’t.
________________________________________
Bottom line:
Cold calling in the ’90s or a viral thread in 2025 — it’s still a sales pitch.
The sooner you recognize it, the less likely you are to fund someone else’s yacht. 🚀

OP - Chance for +70%After weekly close we can see the volume coming in. On the chart we have resistance which if we break through then we can expect price 1.4 which is +70% from now.
If I have some advice for leverage trading I think its better to wait for daily close and then hunt retest if happens.
Rotations of money started already and I don't think is it a case for long run. We need to act, take profit and watch something else.
Like if you like analysis and idea.
Ivan

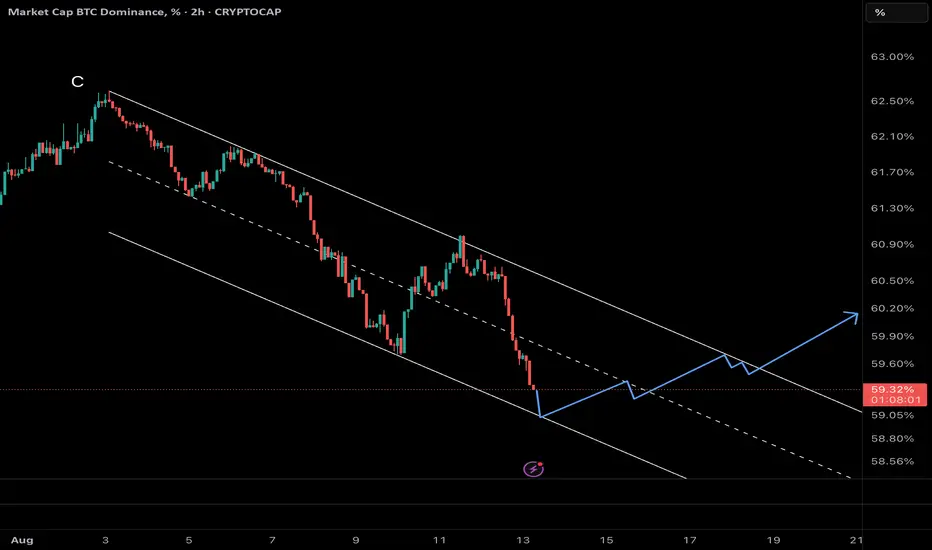
Bitcoin Dominance Hits Channel Floor – Altcoin Storm Incoming?Bitcoin dominance has been sliding within a well-structured descending channel since early August. Now, it’s touching the channel’s lower boundary — a level that has previously sparked strong reversals.
A bounce from here could ignite a short-term uptrend in BTC dominance, targeting the channel’s midline and possibly its upper boundary.
If this happens, capital is likely to rotate back into Bitcoin, applying pressure on altcoins and triggering a corrective phase in the broader altcoin market.
Key Takeaway: Watch for bullish price action at the channel’s floor. A confirmed breakout in dominance could mark the start of an “altcoin cooldown” phase.
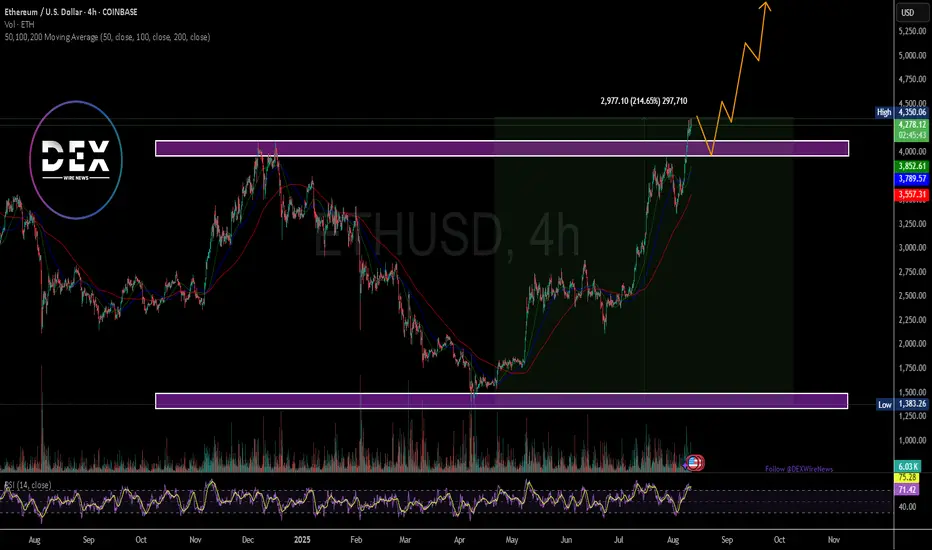
Breaking: Ethereum Is Set To Reclaim the $5k Price Pivot The price of the notable Altcoin- Ethereum ( CRYPTOCAP:ETH ) is set to reclaim the $5k resistance amidst growing interest and buying momentum.
For the past 3 months Ethereum ( CRYPTOCAP:ETH ) spiked 200+% breaking out from a cup and handle pattern amidst growing interest ikn the Ethereum chain.
Crypto Pundits on X, LinkedIn and Discord envisage the influx of memecoins on the Ethereum ( CRYPTOCAP:ETH ) chain- while most skeptics think the layer 1 blockchain is dead, Ethereum's sojourn to the $5k pivot is just days away as popular folks like Eric Trump the son of the present president of USA hints on investor's to buy Ethereum's dip.
As of the time of writing, CRYPTOCAP:ETH is up 0.58% already breaking the $4k resistance trading at $4276. With the Relative strength Index (RSI) at 71, CRYPTOCAP:ETH is on the verge of reaching overbought region. CRYPTOCAP:ETH might experience a respite before picking momentum up.
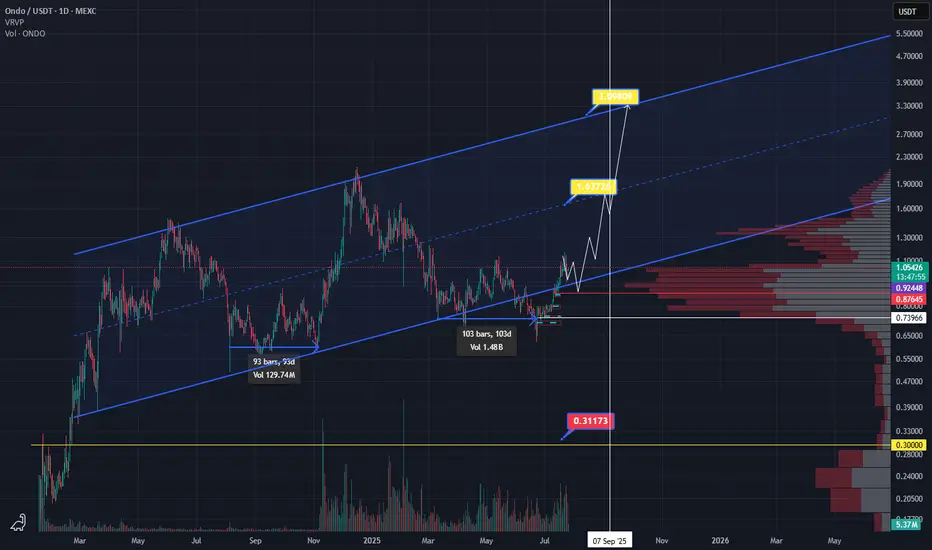
ONDO Bullish structureOndo is back to bullish scenario. We can see long accumulation more then 100 days. As you can see price 0.9 is back and then bullish coming. So 0.85 and 0.9 have to hold and we can buy the dip.
Keep in mind if Ethereum start to attack ATH, Eth ecosystem will grow much higher. So watch this level in next couple weeks and months.
When Altseason? Clues in other chart Ex) #1Hi guys.
So Its no secret bitcoin has been ripping.
We are at new all time highs, and in full on price discovery mode.
I recently posted an ongoing macro analysis on ADA (Cardano) supporting my theory that it is one of the better alts to be investing in for alt explosion.
I want to look elsewhere to see if i can find supporting evidence that its time to invest or trade altcoins.
One chart that can be used is the Total Market Cap of Crypto excluding Bitcoin.
This chart showcases total altcoin market capitalization and its movements.
I believe certain Technical developments can really help us gauge at whats to come.
NOte this is on the 1 Month timeframe aka looking into Macro developments.
Just focusing on Candlestick action.
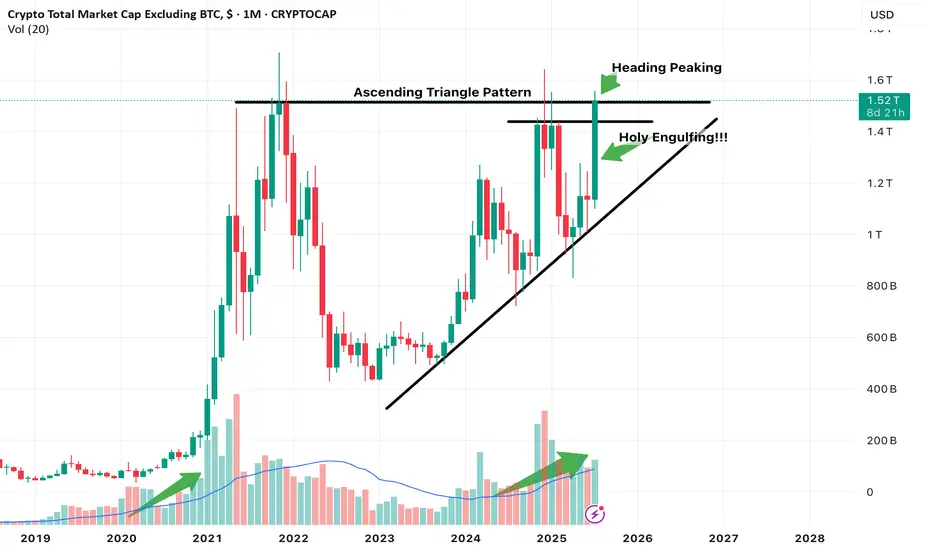
Notice we have been in this ascending channel trend, along with a potential Ascending triangle pattern development which if breakout occurs with confirmation can push Altcoin market cap higher indicating that liquidity is entering altcoins which indicates potential Uptrend.
The month of July so far is in position to print a massive engulfing Bullish candle, which is a great sign.
The upper part is also peaking its head above the Horizontal resistance line. Need to observe confirmation of this breakout. Look for it in smaller timeframes, ill look for it in the 3 day or 5 day.
We are also in position to print a higher high first time in a while.
Notice also Volume. We are seeing currently similar increasing volume as previous alt coin market cap expansion.
Keep an eye out on more posts to add to evidence that supports we are in the verge of potential altcoin season.
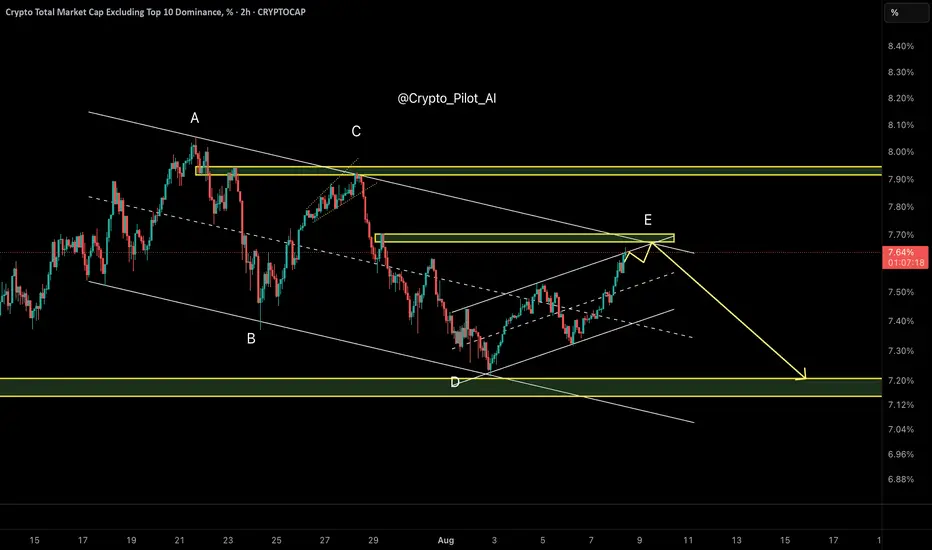
Is It Time for Altcoins to Dump? – OTHERS Dominance Final Wave As predicted in the last update, OTHERS.D reached the 7.20% demand zone precisely, showing a textbook reaction. The price has now rallied back toward the upper boundary of the descending channel and is testing the resistance area near 7.70%, where wave E likely completes within a Diametric structure (ABCDE).
This is a critical juncture: if rejected here, the next bearish wave could trigger an altcoin sell-off.
⸻
🔸 Market Structure:
• Diametric correction (ABCDE), with wave E likely terminating near 7.70%
• Price is testing the confluence of channel resistance and prior supply
🔸 Key Observations:
• Clear rejection signals are emerging around 7.70%
• No evidence of a sustained breakout yet
• Structure typically resolves with a deeper decline (wave F)
⸻
🔹 Scenario:
Base Case:
• Rejection from 7.70% supply
• Bearish continuation toward 7.20% demand
• Potential sweep down to 7.10–7.00% liquidity zone
Invalidation:
• Sustained breakout and acceptance above 7.80%
⸻
📌 Summary:
OTHERS.D is likely finalizing wave E. If this resistance holds, expect a bearish wave F and possible pressure on altcoins. Be cautious with heavy altcoin exposure until a confirmed breakout appears.
⸻
✅ Investment Strategy Selection:
Since declining OTHERS dominance = bearish for altcoins, you’d mark SHORT bias (expecting altcoin underperformance)
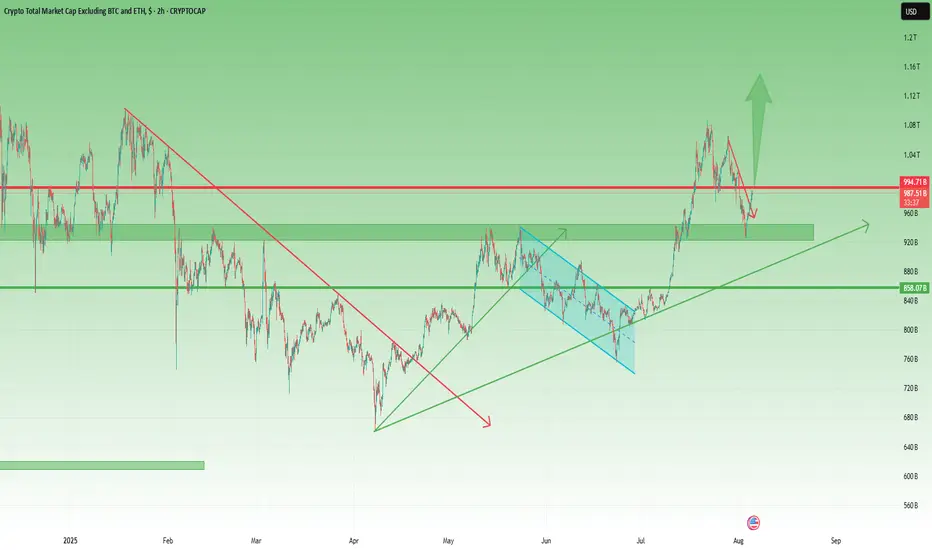
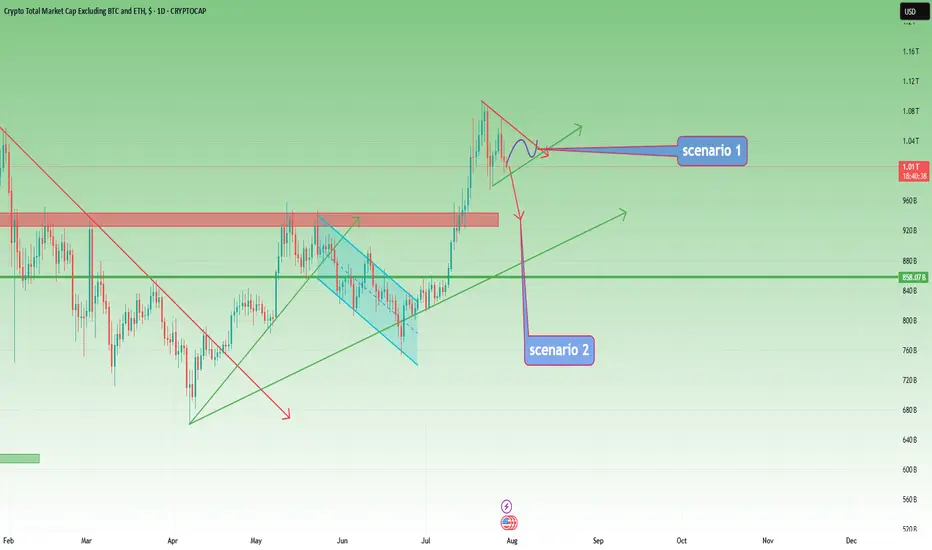
Altcoins Recovering: TOTAL3 Bounces from Key Support ZoneIn my previous analysis on TOTAL3, I mentioned that I'm working with two possible bullish scenarios for altcoins. It now seems we're firmly in Scenario #2.
📉 The price dropped exactly into the highlighted support zone, then yesterday we saw a clean recovery and reversal starting right from that area — a textbook technical reaction.
📈 At the time of writing, TOTAL3 sits at $986B, and a break above the $995B–$1T resistance could trigger a new leg up for altcoins.
🎯 Short- and mid-term targets remain:
• $1.08T (recent top)
• $1.15T
• Potential for new all-time highs if momentum builds
✅ As long as price holds above the $920–$930B support zone, bulls remain in control. This keeps the door open for selective altcoin entries — ideally, projects with real structure, strong tokenomics, and clear momentum.
Buying COMP HereMorning Trading Fam,
After a several-week pause, my indicator is starting to light up with BUY signals again on a few alts. You may have noticed the update I gave on my TOTAL chart post. Price has come down to touch that 50-day EMA as expected. There was one more drop possibility (see post), however, I am taking my chance here, being a little more aggressive, and admittedly entering earlier than the crowd. I don't want to miss the run that I expect to come soon.
I received a BUY on FARTCOIN earlier and doubled up once again. Shortly thereafter, I received a signal on COMP here. We look to arrive on good support and are inside a beautiful block of liquidity. That is exactly where I received the signal to BUY, which I was hoping for. I'm jumping on this. Target will be around $60 with my SL set for $37.75 for a 1:2 rrr.
✌️Stew

SUI Bullish Setup Ahead🚀 After breaking above its May peak, CRYPTO:SUIUSD has confirmed a higher high sequence, signaling bullish momentum. The current price action suggests it's now working on a higher low, likely forming around the 50%–61.8% Fibonacci retracement zone between $3.36 and $3.11 before resuming its rally.

Is There Hope For PI Network? The Price of the notable altcoin NASDAQ:PI network has since seen a downtick of 80.86% since lunching and listing on major CEX like Kucoin, GateIo, OKX, etc. as per data from CMC.
The altcoin has lost the psychological $0.66 resistance zone forming a support or baseline at the $0.33 price range. with increasing selling pressure, NASDAQ:PI might experience further price dip to the $0.20 price point eventually leading to a deja vu to the $0.60 price point.
Possible factor to present price degradation is the dip in CRYPTOCAP:BTC 's price that most coins follow suit, and NASDAQ:PI wasn't an exception.
NASDAQ:PI is currently oversold as hinted by the data from Trading view. the altcoin has an RSI of 20 which entails weak momentum and possible chances of a market turnaround.
What Is Pi Network?
Pi Network is a social cryptocurrency, developer platform, and ecosystem designed for widespread accessibility and real-world utility. It enables users to mine and transact Pi using a mobile-friendly interface while supporting applications built within its blockchain ecosystem.
Pi Price Data
The Pi price today is $0.346618 USD with a 24-hour trading volume of $174,236,091 USD. Pi is down 14.58% in the last 24 hours. The current CoinMarketCap ranking is #38, with a market cap of $2,692,698,184 USD. It has a circulating supply of 7,768,487,700 PI coins and a max. supply of 100,000,000,000 PI coins.

Smart Money Watching BTC Dominance – Rotation to Alts IncomingAfter a deep correction, BTC Dominance has entered a corrective upward phase inside an ascending channel.
Wave A rallied from 60.5% to 62.3%, followed by Wave B retracing to 60.74%.
Currently, Wave C is developing and has reached around 62.2%.
The key resistance sits near 62.7%, exactly at the upper trendline of the channel. This could act as a reversal point, potentially ending Wave C and triggering a bearish move.
💡 Implication:
If dominance drops from this zone, we could see capital rotation into altcoins, supporting a bounce across the broader altcoin market.

Sui chance for +60% on this zoneSui continue to grap liquidation but on the monthly and weekly timeframe we are still bullish.
I just saw good zone for trade. At 3.15 we have daily EMA + fibonacci 0.64 + Daily FVG.
I will suggest to add some leverage because invalidation is close to 2.9.
In this mid term bull market of altcoins we can see that SUI has good performance.
Ivan

APT - HUGE POTENTIAL (130+% SPOT) You probably forgot about this altcoin but it is justified. Downtrend since 2023 and lower highs, lower lows but....
If we look more close and use tool fixed price volume we can see that price is above VAL (Value area low), we had break through but price returns..Also good reaction of FVG (Fair value gap).
Now, we can try buy this coin and have some stop lose. Price is in range 172 days and all people forget abut this coin. Analysis is right only if we close daily candlestick about 6$.
Stop lose can be below 4.4$ which is 6-7% of losing.
Second entry is monthly level at 3.3 and stop lose should be below the lowest low 3$.
For me is great opportunity because risk reward is excellent.
Ivan

Opening A Small Position In FARTCOIN HereGood Morning Trading Family,
I may be a little early here, but at $1.00, I can't resist. I am picking up a small position in FARTCOIN here. I have three targets above. Each will eventually be hit IMO, but for now, I will only be shooting for TARGET #1. I may sell half at that point and let the rest ride.
Now, here are the technical reasons for making my entry here without waiting for my indicator to signal.
First of all, there are three trendlines, all significant, all converging at this one particular point, making this a powerful area of confluence!
Secondly, we broke to the topside of that descending trendline but never really came back to kiss mamma goodbye. Today we are doing that! This is a patent technical move that indicates healthy price fluctuation and is exactly what I have been waiting for.
Third, the VRVP indicates a ton of volume in this area (mostly buyer), which will be tough to break below without significant FUD, which, of course, is always a possibility.
Finally, all of my lower indicators show this thing is starting to get oversold: RSI, MACD, Chalkin MF, HA.
If we do dip lower, I will simply increase my position unless I hit my SL first. My SL is around .78 with my projected first target at 1.66 for a nice 1:3 rrr.
Good luck, all!
✌️Stew

Long GODS - Target 17 Cents - 1:3 RRRTrading Fam,
As I continue to gain experience with my AI-created indicator, I am learning to remain patient and wait for the perfect setups. We have one here on GODS. You can see that we've returned to the bottom of a larger triangle and are using it as support. Additionally, we are within a favorable liquidity block where buyers tend to accelerate the volume. My indicator gave the BUY signal 2 weeks ago, and there has been plenty of sideways accumulation since the signal flashed. Probability suggest that GODS will pump soon.
I'll be targeting 17 cents with a SL at 10 for a 1:3 RRR.
Let's go!
Stew

Is altcoin season over before it even started?Guys,
Gonna break down the situation on the chart to see where we can go next with the altcoins.
We see the key resistance levels and now we moving in kinda bullish pennant, but considering descending volumes we can easily test the support line and go back to the 1.25T. (maybe even lower)
After that, seems like we can try to go back and break the 1.64T resistance zone and previous ATH.
Anyway current market is going to be way more different from previous cycles, because huge institutions can feel nice only in hyper volatile, so divide your strategy between short, mid and long term investments to take profits.
Good trades and share your thoughts down to see what others think.
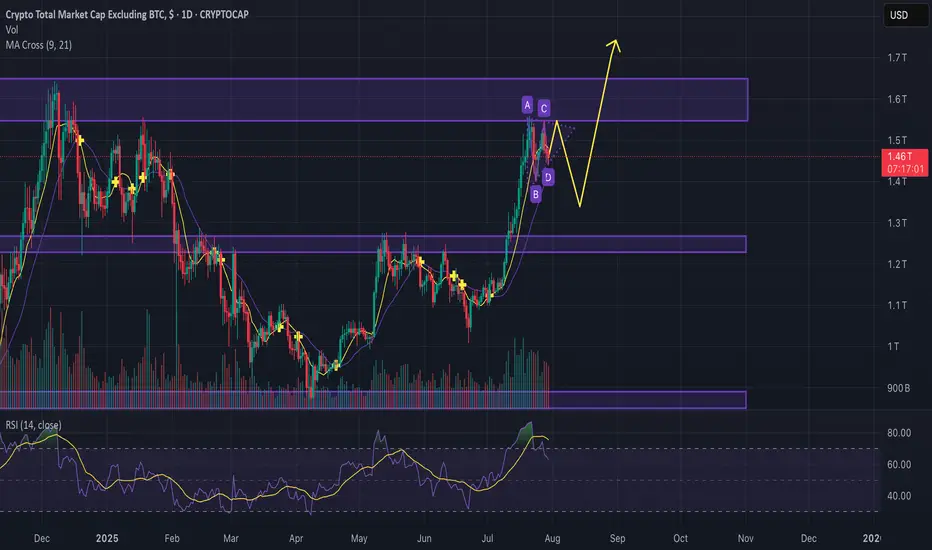
TOTAL3 – Still Bullish, But Waiting for Clarity
In my previous analysis on TOTAL3, I mentioned the high probability of a correction, but also noted that I didn’t expect the 925–940B zone to be reached.
And indeed, price reversed early — finding support around 975B before moving higher.
However, after a push up to 1.07T, the market has started to pull back again.
📊 Current Outlook – Two Scenarios I’m Watching:
Bullish Triangle:
Price may continue to consolidate into a symmetrical triangle, then resume the uptrend from there.
Deeper Pullback into Support:
The market could retest the 925–940B zone, a key support area, before bouncing back up.
⚠️ Bearish Reassessment?
Of course, if price breaks back below 925B and stays there, we’ll have to reconsider the bullish case.
But for now, the trend remains intact, and there’s no technical reason to panic.
📌 My Plan:
I already hold a bag of alts, and I’m not adding for now.
I’ll wait until the pattern becomes clearer — whether it’s a triangle breakout or a dip into support.
Until then, I’m sitting comfortably on what I already hold.
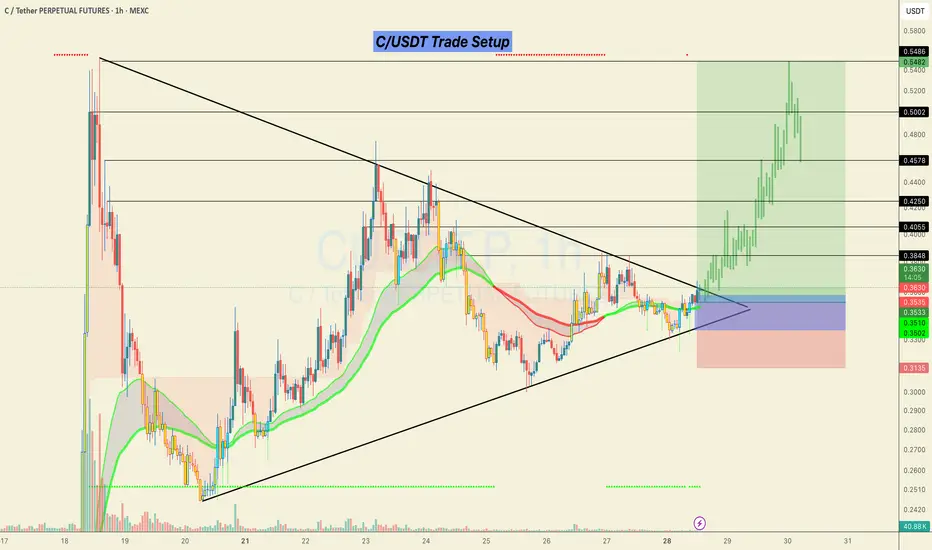
#C/USDT Looks ready for a 50% bullish move.C/USDT Trade Setup 📉
Currently forming a strong breakout structure after a long consolidation inside the triangle.
📌 Accumulation Zone:
0.3350 – 0.3580
🎯 Targets (Black Horizontal Levels):
0.4055
0.4250
0.4578
0.5002
0.5486
🛑 SL: Below 0.3135 (previous structural low)
Price broke out with solid momentum and retested the breakout zone. As long as we hold above the EMAs and the structure remains intact, continuation toward higher levels is likely.
This is a low-risk, high-reward setup as long as the risk is managed properly.
> Not financial advice. Trade at your own risk.
Do hit the like button if you want me to post more of these setups here.
Thank you
#PEACE
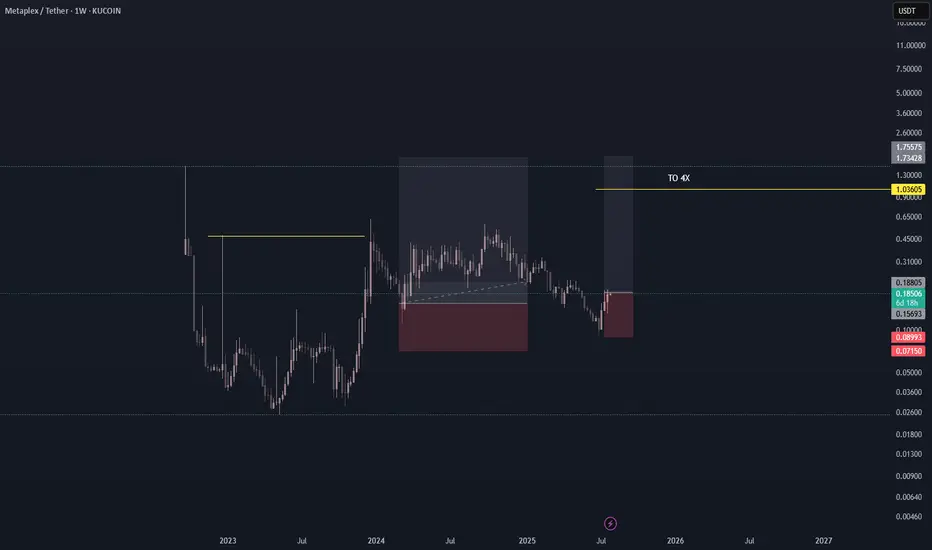
METAPLX/USDT BUY LONG FOR 4XCRYPTO - METAPLEX/USDT
EXPECTED RETURN TO 400-500%
** Crypto investing is highly volatile, you may lose all invested money, please keep it in mind and invest what you can lose and be ok.**
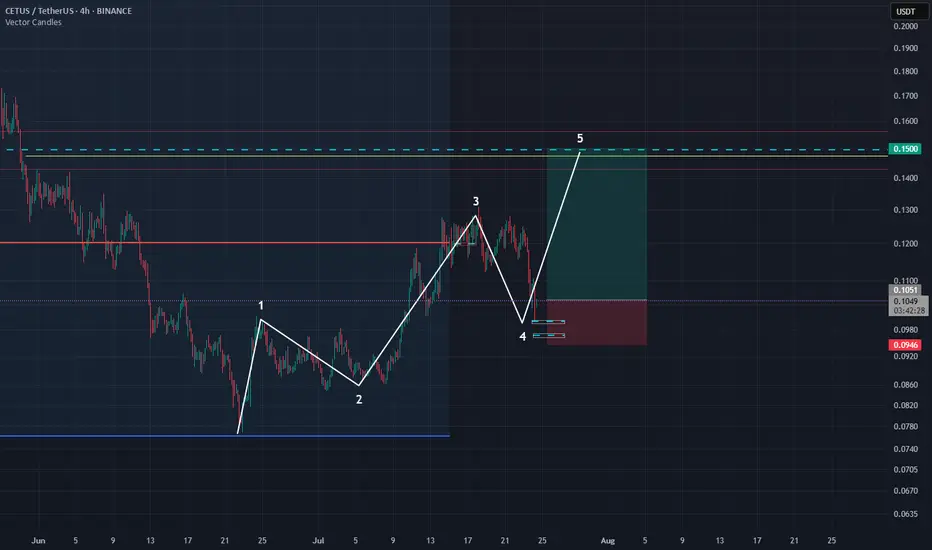
Cetus long setup, RR 4 There is big chance for leverage 3-4 if you want to try this coin. Invalidation is bellow if we looking based on Elliot wave theory.
Be aware if Bitcoin try to corrective more we will have deeper retracement.
We have one more zone bellow so if you want to try second zone, invalidation is the same but you can take much higher leverage
Ivan