ALT COIN SEASON IS JUST WEEKS AWAY, HOPE YOU HAVE YOUR BAGS FULLHey Traders,
We’ve been watching this Bitcoin Dominance (BTC.D) chart closely — and it’s heating up again!
For those unfamiliar, BTC Dominance tracks the percentage of total crypto market cap that belongs to Bitcoin. When BTC.D rises, it typically means altcoins are underperforming compared to BTC — either due to their market caps falling, or BTC’s increasing. When it drops, altcoins are gaining ground.
While this chart won’t tell you whether markets go up or down, it’s critical for spotting where to diversify and when. It’s a must-have tool in your crypto trading utility belt.
⸻
Why This Chart Matters Now:
We’re nearing the top resistance trendline of a long-term triangle formation that dates all the way back to 2017. This line has rejected BTC.D multiple times in the past — and we’re back to test it again, hovering between 63% and 66% dominance.
Each of these rejections previously led to a drop in BTC Dominance — which triggered powerful altcoin seasons.
⸻
Key Bearish Signals:
• Bearish Divergence on the MACD
• MAJOR Bearish Divergence on the RSI
(Just like before previous alt seasons!)
• TOTAL2 (the white line representing all altcoins) looks poised to spike if history repeats.
Altseason Clue: When BTC.D forms bearish divergences on these indicators, it’s often followed by a surge in altcoin market cap — a key early signal we may be close to another one.
⸻
BUT… This Isn’t 2021 Anymore:
Let’s be real — the market has changed. Solana-based launchpads like Pump.fun and Jupiter DEX have revolutionized how easily tokens are created and traded. That’s new capital flow and speculative behavior we didn’t see last cycle.
Plus, the geopolitical landscape is shifting fast. With President Donald J. Trump calling for crypto regulation frameworks within 180 days, we may soon see an influx of institutional money — but it could come with strings attached.
⸻
Final Thoughts:
A breakdown in BTC.D could mean a major rotation into alts — but don’t bet the farm.
Markets could still dump. We may even skip altseason altogether this cycle.
However, this chart gives you a crucial edge — so use it wisely. Know your tools. Zoom out. Plan ahead.
As always — stay sharp, stay safe, and stay profitable out there.
— Savvy
Altcoinseason!

HolderStat | Smart money is interested in BNB🚀 Wallet Snapshot:
● Recent moves: withdrew 26.62 BNB from Binance → Bitget & UniversalRouter; swapped 122.78 K KILO via PancakeSwap
● Top holdings: 17.962 CRYPTOCAP:ETH | 13.683 CRYPTOCAP:BNB | 122.781 K BYBIT:KILOUSDT
● Performance: $250 K+ net profit
Savvy rotation perfectly timed for this mark-up phase! 🔥
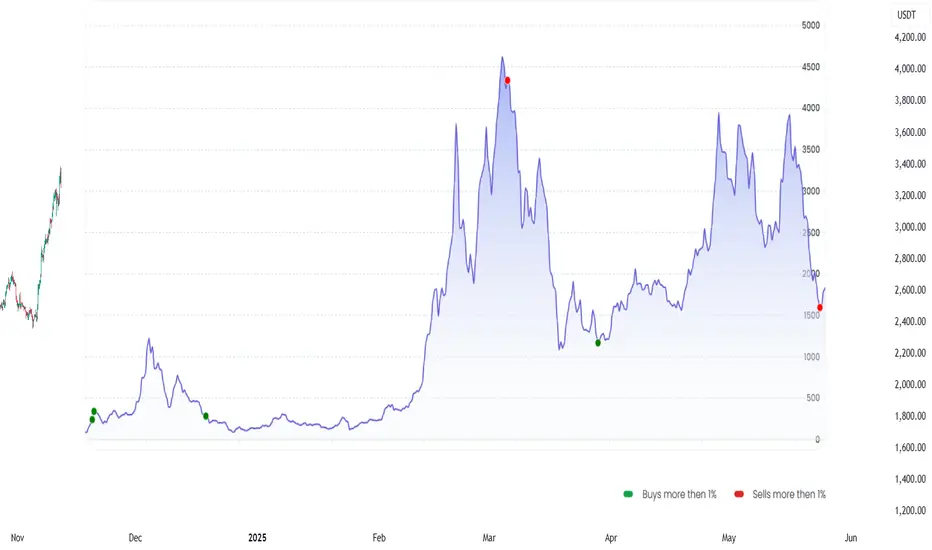
HolderStat | preparing for the May saleThis smart trader withdrew 2.965 CRYPTOCAP:ETH ~$4.9K to Crypto.com—proof this trader is primed to load up on alts. With a lifetime 1832% return over 9 trades this fresh deposit signals full force into the next altcoin rally 🌟
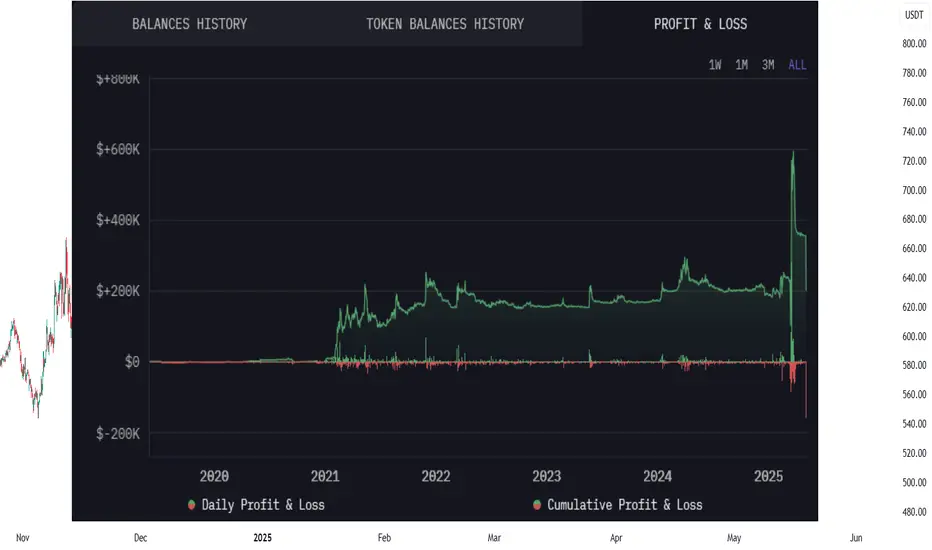
HolderStat | What Tokens does a Successful Trader BuyThe trader owns ~$48.9K 💵
23 hours ago, he exchanged $10K USDC for ~$69K MEXC:DSYNCUSDT , increasing his position to ~138K tokens.
Top Holdings:
● $30K USDC as a reserve for purchases.
● ~138K MEXC:DSYNCUSDT with an average price of $0.14
Smart rotation at this stage of growth! 🔥

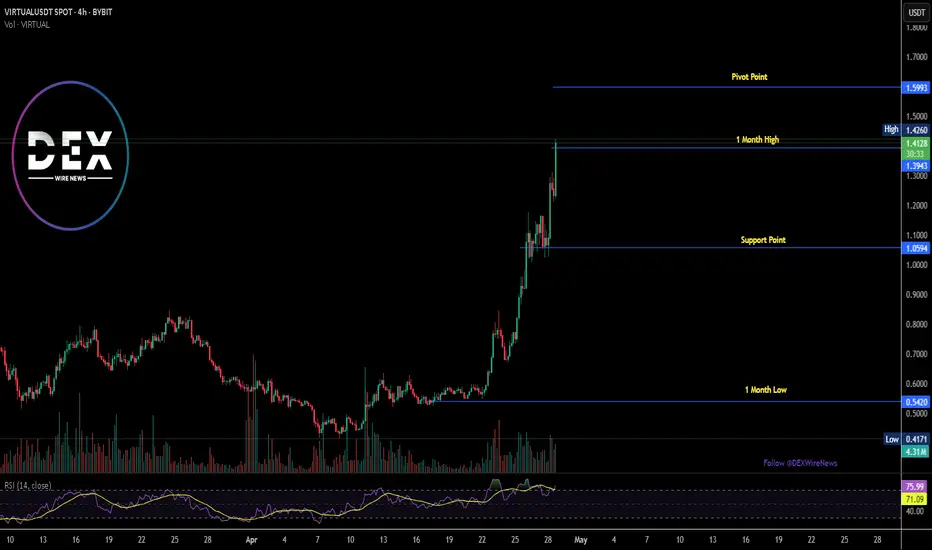
Breaking: Virtual Protocol ($VIRTUAL) Spike 29% Today Built on the Ethereum chain, Virtual protocol's native token ( SPARKS:VIRTUAL ) saw a noteworthy uptick of 29% today albeit the crypto market growth was modest today.
With the RSI at 75 and momentum growing, SPARKS:VIRTUAL seems poised to break the pass the $1.60 resistant zone and reclaim the $1 Billion market cap eventually.
On a bearish tone, failure to break pass the 1-month high pivot could resort to a consolidatory move to the 38.2% Fibonnaci retracement point a level technically seen as the support point.
What is Virtuals Protocol?
Virtuals Protocol (VIRTUAL) is an innovative cryptocurrency that aims to revolutionize virtual interactions through its AI and Metaverse protocol. Serving as the infrastructure layer for co-owned, human-curated, plug-and-play gaming AIs, Virtuals Protocol is at the forefront of integrating artificial intelligence with immersive virtual environments.
Virtuals Protocol Price Data
The Virtuals Protocol price today is $1.36 USD with a 24-hour trading volume of $410,193,840 USD. Virtuals Protocol is up 32% in the last 24 hours. The current CoinMarketCap ranking is #73, with a market cap of $886,828,030 USD. It has a circulating supply of 652,196,092 VIRTUAL coins and a max. supply of 1,000,000,000 VIRTUAL coins.
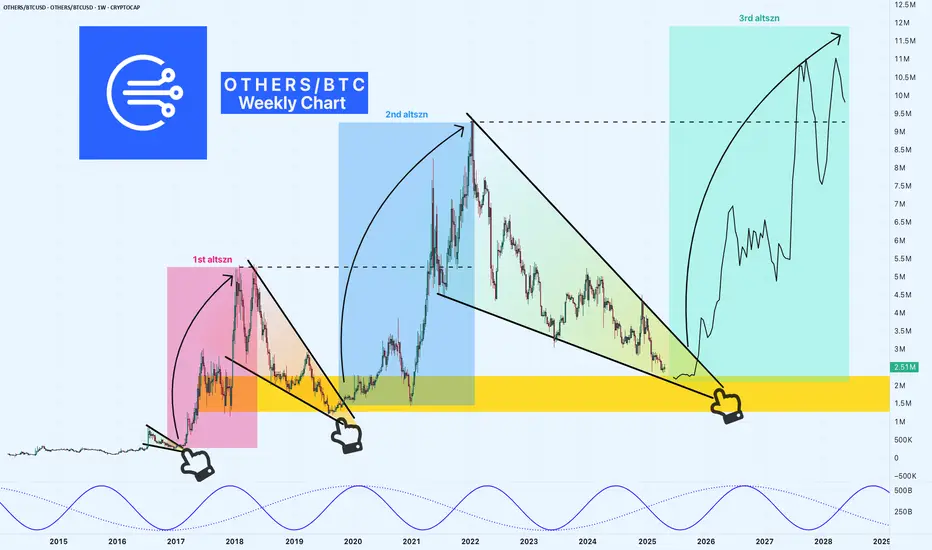
OTHERS/BTCUSD: The Ultimate Indicator for Altcoin SeasonsHey TradingView community! I’ve been analyzing the OTHERS/BTCUSD metric, and it’s painting an exciting picture for altcoin traders. This chart might just be the key to timing the next big altcoin rally — let’s break it down!
What is OTHERS/BTCUSD?
This metric calculates the total altcoin market cap (excluding Bitcoin) divided by BTC/USD. It shows how altcoins perform relative to Bitcoin.
High Metric : Altcoins are outperforming Bitcoin — think altcoin season!
Low Metric : Bitcoin dominance takes over, and altcoins take a backseat.
Historical Patterns: Falling Wedges Stealing the Show
The OTHERS/BTC Weekly chart reveals three Falling Wedge patterns, a bullish setup that’s historically preceded massive altcoin bull runs:
1st Altseason (2017-2018) : A Falling Wedge formed in 2016 (prior pink zone). The breakout unleashed a legendary altcoin rally — remember Ethereum and Ripple going parabolic?!
2nd Altseason (2020-2022) : Another wedge in 2018-2019 (blue zone) led to the 2021 altcoin boom, with projects like Solana and DeFi tokens soaring as the metric hit 10M.
3rd Falling Wedge (2022-Now) : Since 2022, a new wedge is forming (green zone), resurfacing the setups that sparked the last two altseasons.
Current Setup: A Critical Support Zone
As of April 27, 2025, the metric is approaching a key support zone of 2M-1.5M (where the altcoin market cap equals 1.5M to 2M Bitcoins).
Historical Significance : This level has been a launchpad in the past — both in 2016 and 2019, it marked the bottom before altcoins reversed and surged.
What’s Next : If this wedge breaks out, the metric could climb to 7M, 9M, or even 11.5M by 2025-2027. That could mean 5-10x gains from bottom for altcoins, depending on the pair!
A sinusoidal wave at the bottom of the chart — it reflect market sentiment cycles, with troughs (like now) often preceding altcoin season greed phases.
Why This Metric Matters
OTHERS/BTCUSD captures the flow of capital in crypto:
Bitcoin often leads bull cycles, pulling in capital first (metric drops).
When BTC’s rally cools, investors chase higher returns in altcoins (metric rises).
The Falling Wedges highlight this cycle — consolidation during Bitcoin dominance, followed by breakouts when altcoins take the spotlight.
Trading Takeaway
Monitor the 2M-1.5M Zone : A breakout here could be your green light to stack altcoins.
Cross-Check Bitcoin Dominance : A drop in BTC.D (Bitcoin Dominance) would confirm capital flowing into altcoins.
Pick Strong Projects : Look for altcoins with solid fundamentals — layer-1s, DeFi, or AI tokens could lead the charge.
What’s your take, TradingView fam? Are you gearing up for the next altseason?
Drop your favorite altcoin picks or charts in the comments — I’d love to hear your thoughts!
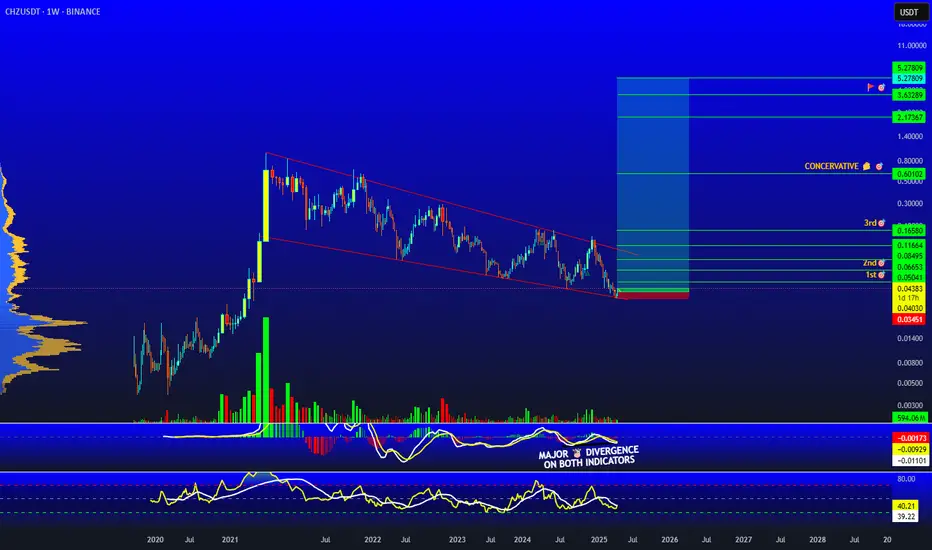
CHZ 50x plus tradeTraders,
Here we are again pointing out an amazing trade idea for you, the solicitors 👧🏿 and dealers 🙍🏿♂️who will likely end up transacting all of your winnings with! CHZ a great wagering project that will make you a killing this run. This one is cut and dry, we have a wedge pattern along with a possible flag that will likely play our by the end of this year!
We hope you enjoy the free trades that we have been sharing from the VIP group and look forward to seeing you enjoy these gains year round if you come check us out!
As always, stay profitable folks!
Savvy!
WELCOME TO THE BEGINNING OF ALT COIN SEASON!Traders, Hodlr's and Soon to be Liquidity (late retail buyers),
This is likely the moment we have been waiting for. Last week in our weekly VIP market update we discussed just a few things that would really show us if we just saw the bottom of the alts and if it was now time to start seeing some new local HH's and then HL's showing us a shift in trend. I had posted a few trades pointing this out. We have now at this point accomplished what we were looking for to see if we would be starting Alt coins season.
We have been watching a few things. The first being Bitcoin Dominance or CRYPTOCAP:BTC.D as this is a great chart to watch and look for reversals prior to looking at the chart of the specific alt coin against BTC to see if it also is showing it could have a rally or a pullback based on your bias on this BTC.D chart. For instance if I were to want to see maybe when XRP would likely start breaking out say that this BTC.D chart is in fact correct and the triangle trend line will end up being the top for btc dominance at around 64.4% of the total market I would go to BITSTAMP:XRPBTC to give myself some insight on confluence of market movements.
Being that we are now here at the point that I believe we will start to see money flow into alts based on this chart and others such as CRYPTOCAP:TOTAL2 , CRYPTOCAP:TOTAL3 and CRYPTOCAP:TOTALDEFI and the specific BTC pairings that I am holding by looking up the ticker of my alt coin/BTC and studying that chart I will honestly say that I am in the 90%/10% bullish on alts to bearish.
I hope this information helped you in your journey to get more information and come up with your own analysis to base your investment decisions and you become prosperous for doing soo!
Stay Profitable Folks,
Savvy!

UMA Trendline Shattered! What’s Next for Bulls?BINANCE:UMAUSDT has broken above the key trendline resistance and is now testing a minor resistance zone.
If a candle closes decisively above this marked zone, we could see a parabolic upside move in the coming sessions.
This breakout structure, paired with strong momentum, makes it a setup worth watching closely.
DYOR, NFA

Altcoin Market Update – April 24, 2025As of today, the TOTAL3 Index (excluding BTC & ETH) offers key insights into the altcoin market:
⸻
Technical Overview:
• 1D: -1.54% → Minor pullback
• 1W: +6.37% → Bullish momentum
• 1M: -4.14% → Mid-term correction
• 6M: +32.94% → Strong growth
#TOTAL3 remains above $790B, a critical support. Holding this level is vital for future altcoin rally targets like $1.16T and beyond.
Bullish divergence on the TOTAL3/BTC chart hints at altcoins gaining strength over BTC.
⸻
Fundamentals:
• The global crypto market cap is $3.03T
• BTC & ETH dominate, but TOTAL3 reflects altcoin potential
⸻
Summary:
Altcoin market remains optimistic, with solid long-term signals. Keep an eye on support zones and momentum indicators for your trading strategy.

$HBAR Near Key Resistance: Will the Bull Flag Explode?CRYPTOCAP:HBAR is trading within a bull flag on the 2-day chart, holding just below a key resistance zone that was previously support. The 100 EMA is also acting as a dynamic barrier here.
A breakout above $0.188 with strong volume could trigger the next bullish leg.
But if resistance holds, a short-term pullback might follow.
DYOR, NFA

Beautiful TA played out. That was initiation for many Alt LONGsLook at this TA from 2 days ago, then you will understand my Alt LONGs.
Despite BTC D. made higher highs, but Alts moved up too.
7.5 % till now🎯 👌 😎
In Update, I will paste the Alts LONGs ;).
Original TA from 2 days ago:
Follow for more ideas/Signals.💲
Just donate some of your profit to Animal rights or other charity :)✌️

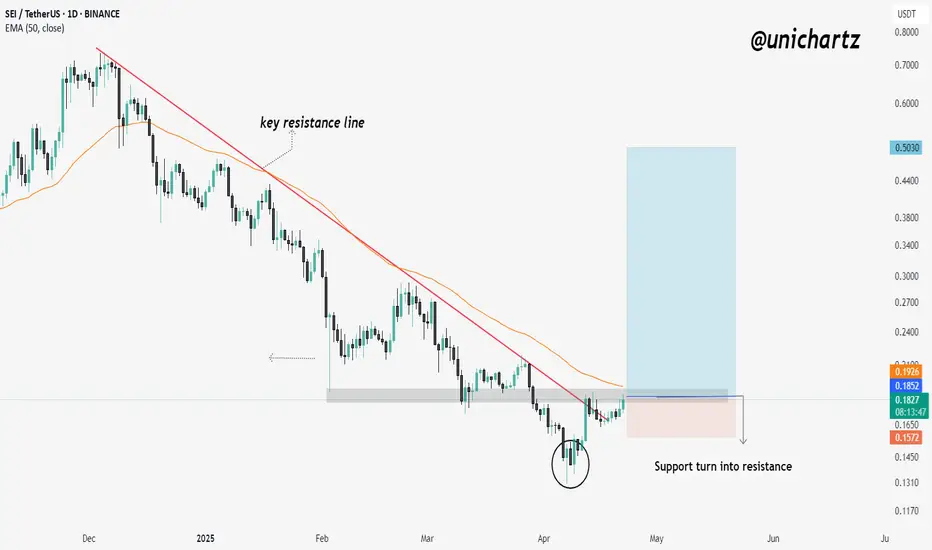
SEI Trend Reversal? Breakout + Higher Low ConfirmedNYSE:SEI has broken above the key descending resistance line, signaling a shift in momentum after an extended downtrend. The price also rebounded strongly from the support zone marked in the chart, forming a clear higher low.
Currently, SEI is pushing through a critical zone where support previously flipped into resistance, now testing the 50 EM as the next challenge.
If the price can hold above this zone and close with strength, the next leg up could target $0.30–$0.50, as shown on the chart.
DYOR, NFA
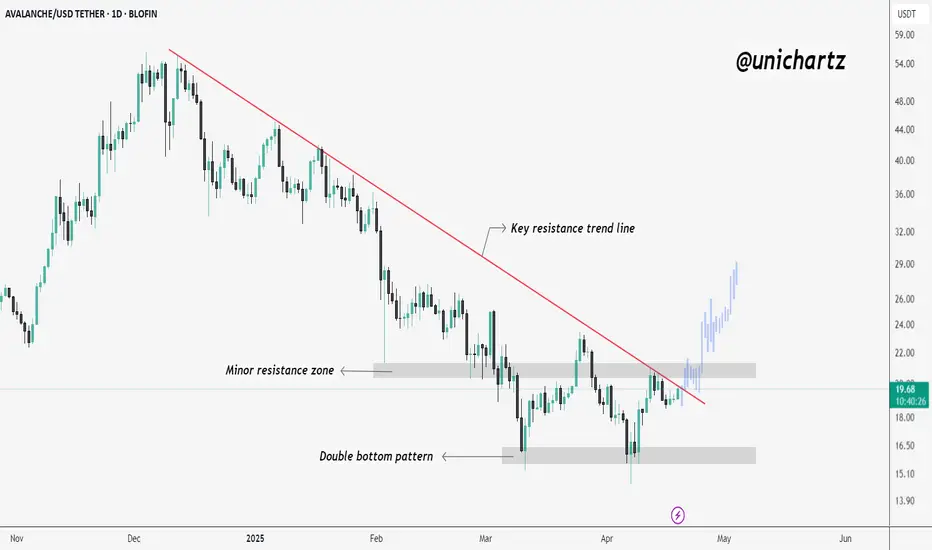
Reversal Pattern in Play – Will AVAX Flip Bullish?CRYPTOCAP:AVAX is showing signs of a potential reversal after forming a double bottom near the $17 zone. It’s currently testing a key resistance trendline along with a minor horizontal resistance around $19.50–$20.50.
A successful breakout and close above this zone could trigger bullish momentum toward $22+. However, rejection here may lead to another dip back toward support.
Price action is tightening, so a decisive move is likely soon.
DYOR, NFA
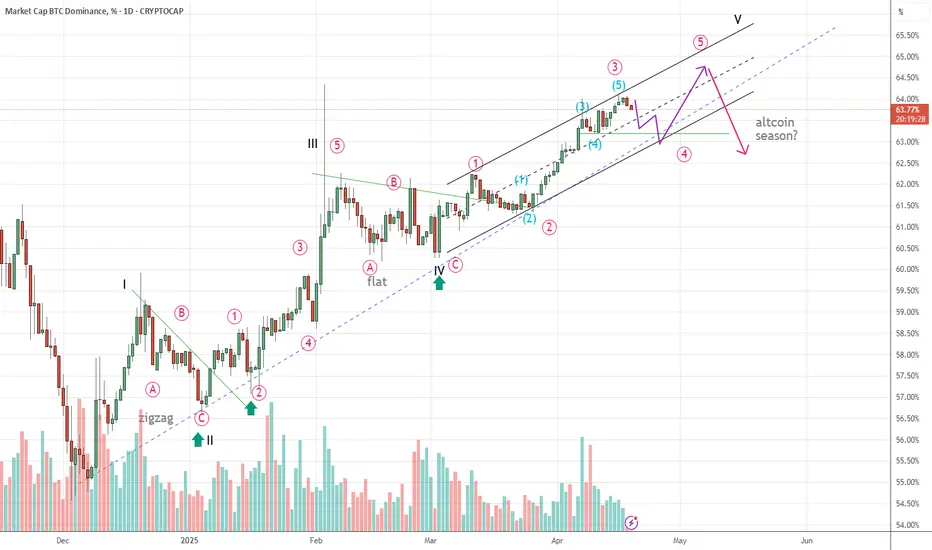
BTC.D Wave 5 is formingWe are now in the final wave of the btc.d market share
The black V wave is in the final stage
In my opinion, btc.d is in the red wave 4 and is expected to have another red uptrend to complete 5 waves and at the same time, it will also have 5 black V waves
If all the waves are complete, we will have a btc.d break and the altcoin season will take place
We can see that altcoin is at the bottom and is recovering, this uptrend is likely to increase (because btc.d is decreasing wave 4) then btc.d goes up to the red wave 5 as analyzed above, the altcoin will test the possible double bottom pattern (with some strong coins that can slightly recover to the 50% fibonacci and then go up)
to go up, the weaker ones can have triple bottoms
Anyway, we are at the end of btc.d and it is also the altcoin season that is about to begin
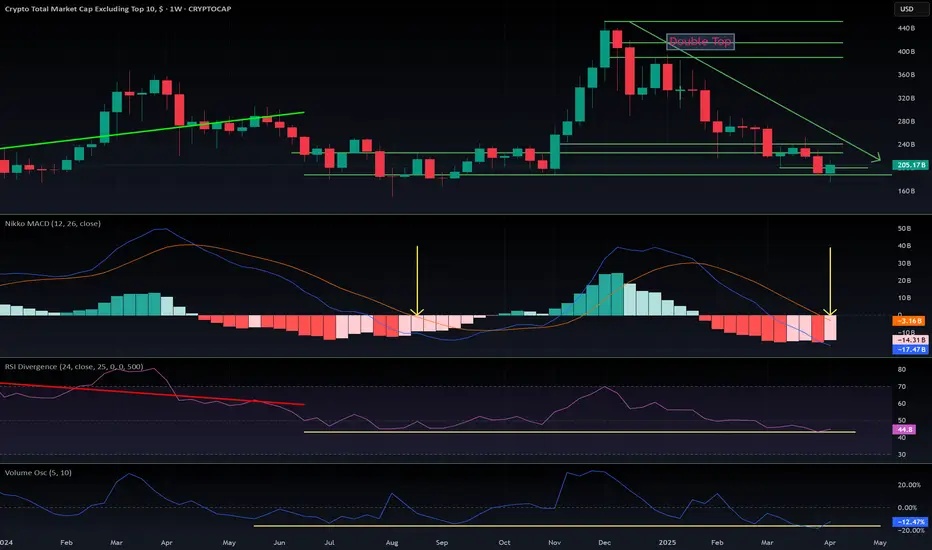
$OTHERS is the correction over? All is in the Chart!Check the yellow arrows and lines— CRYPTOCAP:OTHERS (all altcoins excluding the top 10) is following a correction pattern similar to CRYPTOCAP:BTC and the $SPX500.
📉 On the 1W timeframe, the MACD is overbought and currently in the middle of a correction. This typically signals a bounce in the coming weeks.
🕰️ If we compare this to the previous cycle, it appears we're at the early stage of what could become an altseason. Back then, it took around 10 weeks after this point to see the real breakout.
🗓️ Based on that, I forecast:
May: first major pump
July–August: consolidation
September–October: final leg up
Despite recent announcements from Trump, the 1W chart has not significantly changed—everything is progressing as expected.
📊 You can verify this macro alignment with my other analyses:
🔗 SPX500 (trendline shows bottom around Sept 2025 at 4700):
🔗 CRYPTOCAP:TOTAL (crypto market macro view):
🔗 CRYPTOCAP:BTC (warning posted on Feb 5, 2025):
📈 Everything is aligning—traditional markets, Bitcoin, and altcoins.
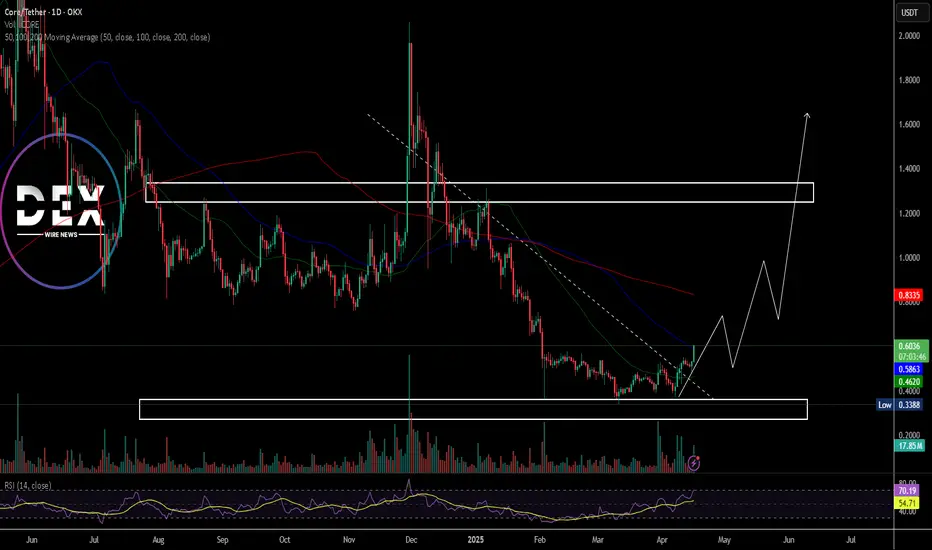
Breaking: $CORE Spike 19% Amidst Breaking From A Falling Wedge The price of Satoshi Core ( MIL:CORE ) broke our of a falling wedge delivering 19% in gains today.
The asset has since being in a falling wedge pattern ever since it surge to $2 in late November, 2024. This price correction led to about 84% loss in market value. However, recent price action posits that MIL:CORE is gearing up for a breakout with about 200% gain in sight.
With increasing momentum as hinted by the RSI at 69, MIL:CORE could be on the cusp of a breakout. Similarly, data from Defilama shows a growing ecosystem in the CORE blockchain, with about $549.72 Million locked in Total value lock (TVL) in DeFi.
What Is Core (CORE)?
Core (CORE) is built as an L1 blockchain that is compatible with Ethereum Virtual Machine (EVM), therefore it can run Ethereum smart contracts and decentralized applications (dApps). The Core network is powered by the “Satoshi Plus” consensus mechanism, which secures the network through a combination of delegated Bitcoin's mining hash and delegated Proof-of-Stake (DPoS). The protocol is backed by its native token, CORE.
Core Price Live Data
The Core price today is $0.598662 USD with a 24-hour trading volume of $58,909,857 USD. Core is up 19.65% in the last 24 hours. The current CoinMarketCap ranking is #88, with a market cap of $598,189,722 USD. It has a circulating supply of 999,210,618 CORE coins and a max. supply of 2,100,000,000 CORE coins.
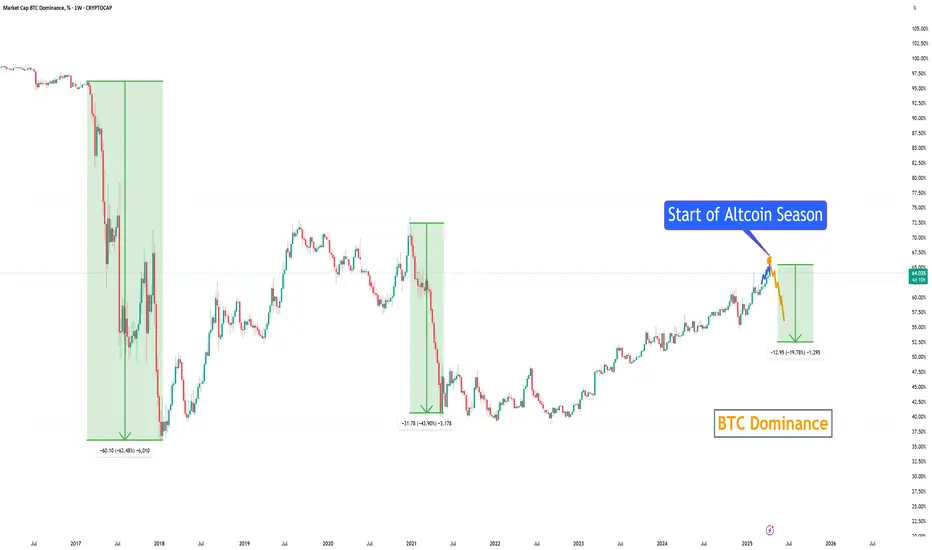
Altcoin Season in May/June 2025First proper Altcoin Season -> 1 Year, -62% for BTC Dominance (Alts Crush BTC)
Second proper Altcoin Season -> 6 months, -44% for BTC Dominance (Alts Crush BTC again)
Third proper Altcoin Season (upcoming) -> 2-3 months, -20-25% for BTC Dominance (Alts will outperform BTC)
Diminishing returns for Altcoins, because there is not much utility for Altcoins as of now
ETH -> underwhelming performance in the last 2 years, thus gthe eneral altcoin market suffers
Mantra, memecoins, Luna, FTT , and many other scams affect the market, More people just buy BTC and forget and don't touch alts
Yellow Ket Gearing For A Breakout Amidst Symmetrical Triangleyellow ket coin ($KET) a token created under the Avax ecosystem is set for a breakout move amidst a symmetrical triangle pattern on the 4-hour price chart.
Should the asset break from the Ceiling of the symmetrical triangle, a bullish campaign will be materialise with a 100% surge in sight albeit $KET has to be listed on major exchanges to fuel the hype of the memecoin.
Similarly, on a bearish scenario, a break below the symmetrical triangle could also send $KET to a nosedive- leading to a selling spree.
About yellow ket
YellowCatDAO sets itself apart by integrating cutting-edge AI-driven trading mechanisms with a community-centered governance model. At its core, the project leverages an AI agent capable of executing trades across multiple blockchain networks, making it a pioneer in cross-chain AI trading. Unlike typical trading bots, this AI agent not only focuses on profitability but also strategically reinvests gains into the project’s treasury to ensure sustainable growth and support ongoing initiatives.
yellow ket Metric
The live yellow ket price today is $0.184953 USD with a 24-hour trading volume of $5,874,478 USD. Yellow ket is down 3.78% in the last 24 hours, with a market cap of not available. The circulating supply is not available and the max. supply is not available.

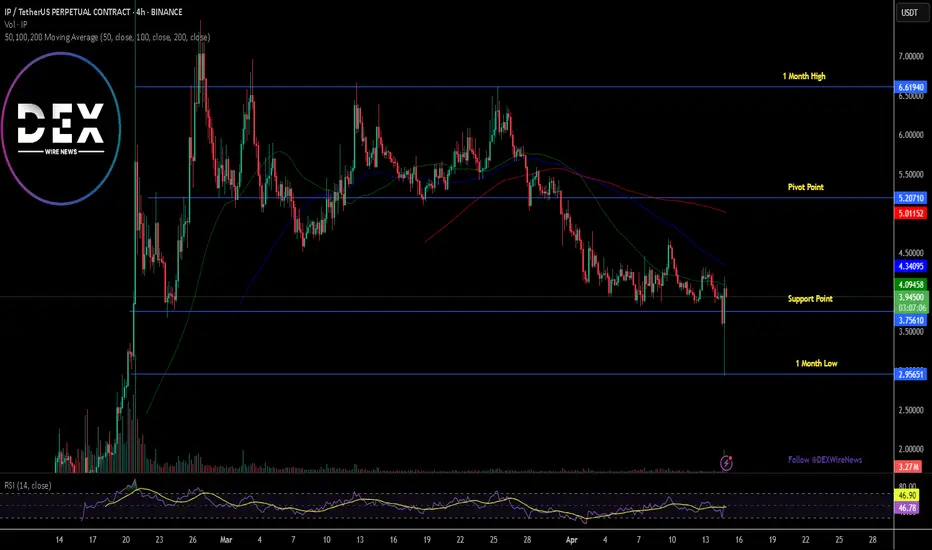
Breaking: Story Coin ($IP) Tanked 14% Today The price of Story coin ( NYSE:IP ) has recently dipped 14% for the past 24 hours but recent price action indicates build up momentum to reclaim loss grounds.
Story coin ( NYSE:IP ) a Layer 1 (L1) blockchain designed to serve as the foundation for intellectual property (IP) on the internet. It enables creators to register, license, and monetize their IP assets seamlessly. By leveraging blockchain technology, Story provides a transparent and efficient framework for IP attribution, licensing, and commercialization.
Technical Outlook
As of the time of writing, NYSE:IP is up 1.27%. the asset is trying to bounced off of the support point with momentum building as hinted by the RSI at 47, NYSE:IP is getting ready for a breakout to the 38.2% fib level.
Story Price Live Data
The live Story price today is $3.88 USD with a 24-hour trading volume of $118,805,575 USD. Story is down 7.65% in the last 24 hours. The current CoinMarketCap ranking is #62, with a live market cap of $1,040,840,390 USD. It has a circulating supply of 268,456,342 IP coins and the max. supply is not available.
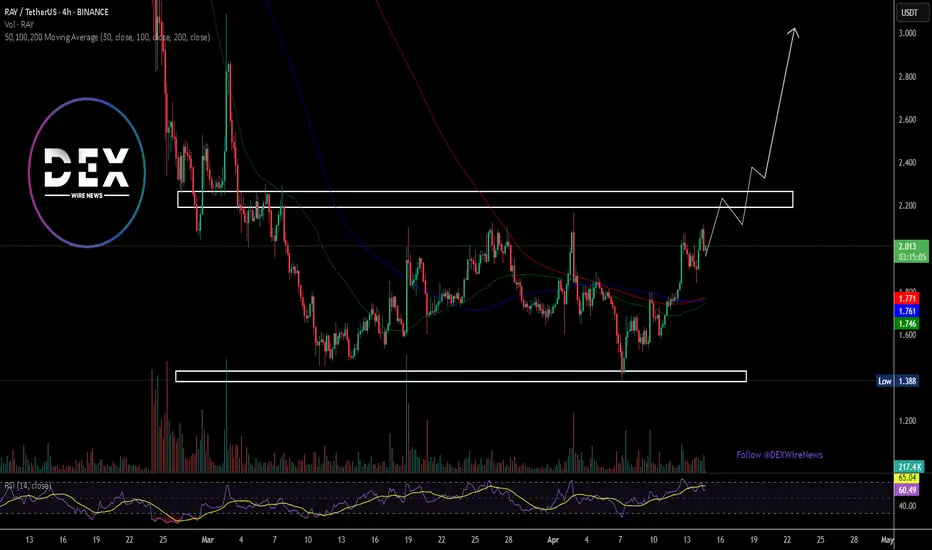
Breaking: Raydium ($RAY) Reclaims $2 PivotRaydium's ( NASDAQ:RAY ) which is an automated market maker (AMM) and liquidity provider built on the Solana blockchain for the Serum decentralized exchange (DEX)'s native token has reclaimed the $2 pivot albeit the crypto market is in a general market correction.
The asset surge 6%, and is gearing up for a breakout to the $3 resistant as a breakout above the $2.3 region would cement the grounds for a bullish continuation move to the $3 point.
Unlike any other AMMs, Raydium provides on-chain liquidity to a central limit orderbook meaning that funds deposited into Raydium are converted into limit orders which sit on Serum’s orderbooks.
With the RSI at 60, Raydium is poised for the breakout move as momentum builds up.
However, should NASDAQ:RAY fail to pull up the stunt, a consolidation move to the $1.8 support point will be vehemently tested.
Raydium Price Live Data
The live Raydium price today is $1.99 USD with a 24-hour trading volume of $98,068,751 USD. Raydium is up 1.71% in the last 24 hours, with a live market cap of $578,910,409 USD. It has a circulating supply of 290,814,662 RAY coins and a max. supply of 555,000,000 RAY coins.
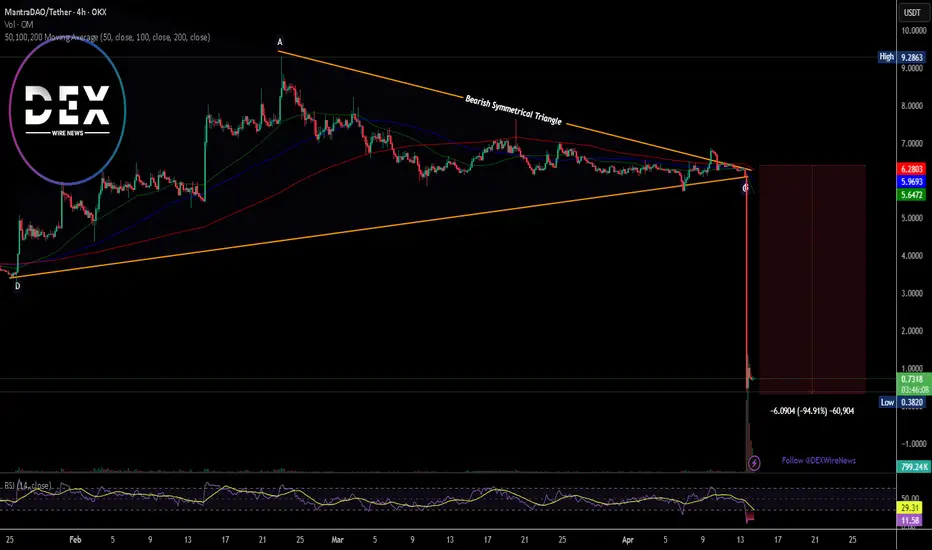
Breaking: MANTRA coin ($OM) Nosedived Nearly 100% Today MANTRA, a Security first RWA Layer 1 Blockchain, capable of adherence and enforcement of real world regulatory requirements that is Built for Institutions and Developers, offering a Permissionless Blockchain for Permissioned applications saw its native token Mantra Coin ( CRYPTOCAP:OM ) plummeted 94% today amidst falling out of a bearish symmetrical triangle.
The bloodbath came as a shock as days ago it was sitting on a market cap of $6 Billion and major deals were iterated, including a $1 Billion tokenization pact with DAMAC.
However, the main trigger was an allegedly suspicious 3.9M CRYPTOCAP:OM deposited (linked to team wallets) to OKX, fueling sell-off fears.
Key Allegations
Team controls ~90% supply – raising manipulation concerns.
Undisclosed OTC deals – tokens reportedly sold at 50% discounts.
Exchange liquidations – forced closures worsened the crash.
However, Binance CEO Said:
"OM CRYPTOCAP:OM 90% price crash was due to massive cross-exchange liquidations, tokenomics changes, and large token dumps".
In response to an X post, the Mantra team said:
"we want to assure you that MANTRA is fundamentally strong. Today’s activity was triggered by reckless liquidations, not anything to do with the project. One thing we want to be clear on: this was not our team. We are looking into it and will share more details about what happened as soon as we can."
Technical Outlook
As of the time of writing, CRYPTOCAP:OM is down 28.6% according to the 4 hour price chart. the asset is showing signs of a reversal but the diamond hands are weak prior the extreme token sell-off as hinted by the RSI at 11.51, this is extremely oversold with a possible reversal lurking around the corner, should the team figure out the cause of the bloodbath, CRYPTOCAP:OM might reclaim $1 zone and then possibly the $5 price point.
With the market cap presently $697 million, CRYPTOCAP:OM has enough strength for a bounce back after the mainstream crypto market might have digest the news.
MANTRA Price Live Data
The live MANTRA price today is $0.719974 USD with a 24-hour trading volume of $2,499,155,492 USD. MANTRA is down 88.55% in the last 24 hours. The current CoinMarketCap ranking is #81, with a live market cap of $697,898,136 USD. It has a circulating supply of 969,337,399 OM coins and the max. supply is not available.
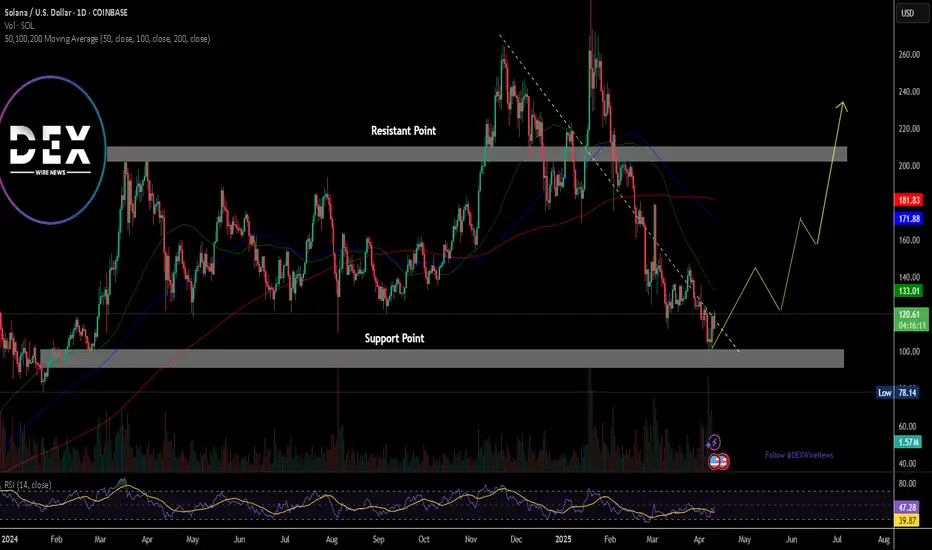
Solana Surges Nearly 8% As Janover Pivots to Solana Treasury The price of Solana ( CRYPTOCAP:SOL ) famously known as the ethereum killer has surged nearly 8% today as Commercial property platform Janover pivots to Solana treasury strategy, stock surges 1,100% as investors rush in prior the news.
Janover has invested over $9.6 million into Solana (83,000+ SOL) as part of a new digital asset treasury strategy, with plans to stake its holdings and run validators to generate onchain revenue.
The move follows a $42 million funding round and has triggered a 1,100% surge in Janover’s stock price as the company positions itself as a transparent, publicly traded vehicle for crypto exposure.
Solana has lost grip of the $120 pivot for the past 2 weeks, but reclaimed the zone today currently trading at $120.54 per $SOL.
The daily price chart shows Solana has been trading within an enclose rectangular zone with the Resistant and support points slightly above each other. For Solana, a break above the $170 zone could pave way for a move to the $200- $270 zone. Similarly, a break below the $100 zone could be catastrophic for Solana.
However, the RSI shades a bit of a light at the end of the tunnel as it stands at 47, which is prime for a reversal.