$OTHERS seems to have reached the bottom,Has CRYPTOCAP:OTHERS Finally Bottomed? Is It Time for Altcoins to Recover?
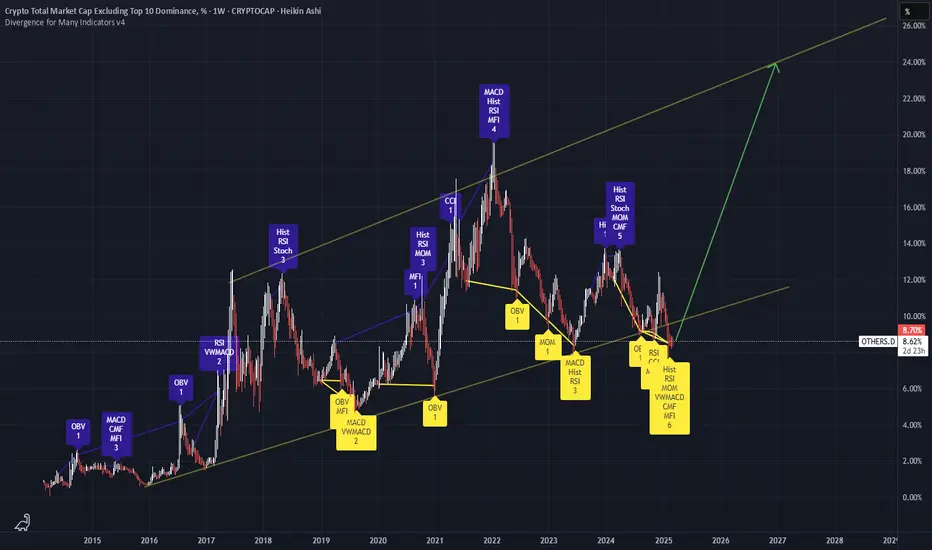
CRYPTOCAP:OTHERS has been struggling with a bearish double top and a negative divergence, leading to a massive sell-off. The altcoin index (excluding the top 10 cryptos) lost half of its market cap, bottoming out at $255B—a critical support level.
Breaking below this support would be a disastrous scenario. However, signs of recovery are emerging:
✅ RSI is at the bottom, indicating a potential rebound.
✅ MACD (daily) has made a bullish crossover, hinting at momentum shift.
These signals suggest the bleeding might be over, and capital could soon flow back into riskier altcoin assets.
DYOR!
Altcoinseason!

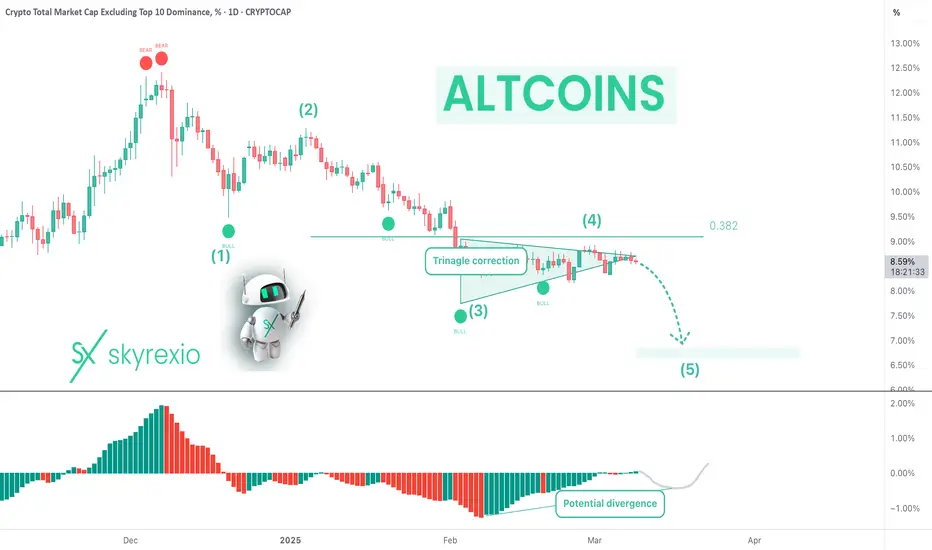
WARNING! Big Dump For Altcoins Will Start Tomorrow!Hello, Skyrexinans!
Couple of weeks ago we also warned you on the weekend that on the next week can start the huge dump on the crypto market and on altcoins especially. Today we received the red alert again that we have to be ready for the drop which will start tomorrow.
Let's take a look at the daily chart. Here we can see that price has already completed 4 waves of 5 of the Elliott waves cycle. Wave 4 is the triangle shaped, that's why it has not even reached the 0.38 Fibonacci retracement. In our opinion it's finished and now it's time for the wave 5, which has the target approximately at 7%. When we will see divergence with AO and green dot on the Bullish/Bearish Reversal Bar Indicator it can be the historical moment when the price will show us the reversal.
Best regards,
Skyrexio Team
___________________________________________________________
Please, boost this article and subscribe our page if you like analysis!
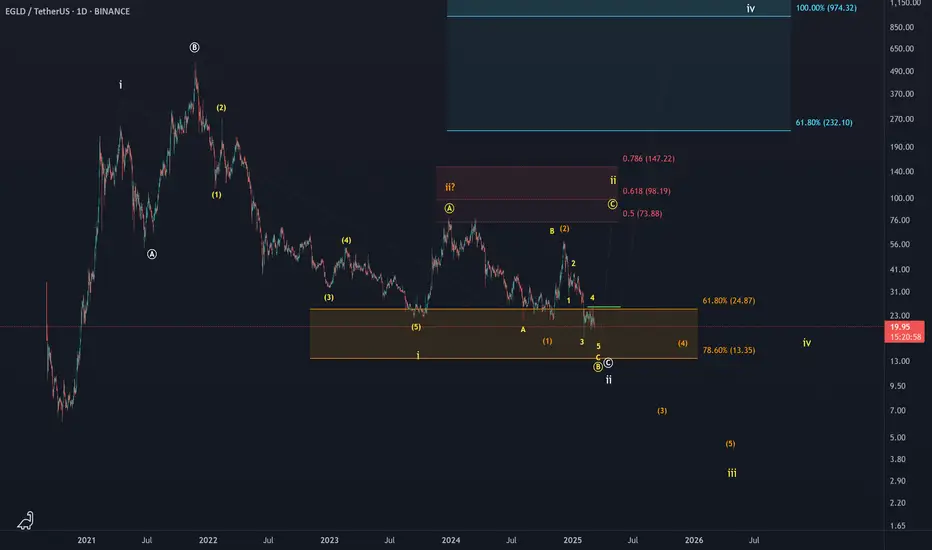
EGLD: Is There a Chance for Another Rally? Elliott Wave AnalysisEGLD / MultiversX: We saw a five-wave decline into the support area back in September 2023. Since then, the price has struggled to rally impulsively and has largely failed to participate in the broader bullish market. While it's still holding long-term support at $13.35, which is a positive sign, the short-term structure doesn't provide much confidence for an imminent upside reversal.
A recovery bounce is due, but for any meaningful rally to take shape, we need to see a break above $25.55. That would be the first indication that a low might be in. However, from there, we’d have to analyze the structure closely to determine whether it aligns with the yellow scenario or the more bearish orange scenario.
At this stage, there are no clear patterns suggesting a move to all-time highs. The white scenario remains speculative and is not the preferred view, though it's still valid, which is why it remains on the chart. Between yellow and orange, I remain neutral for now. The short-term trend is still down, and until $25.55 is broken, there's no confirmation of a low being in place.
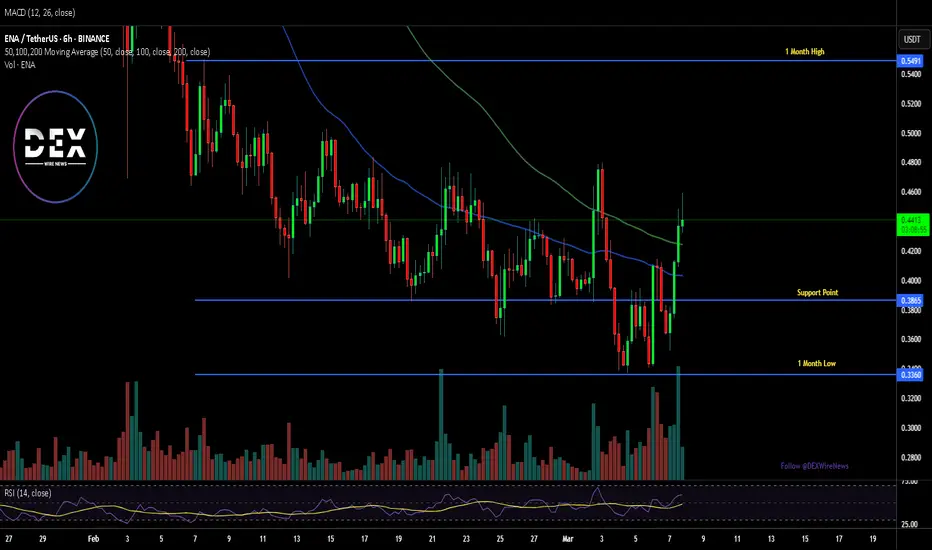
Breaking: Ethena ($ENA) Surged 21% Today- What Next?The synthetic dollar protocol built on Ethereum that will provide a crypto-native solution for money that is not reliant on traditional banking system infrastructure, alongside a globally accessible dollar-denominated savings instrument native token Ethena ( MIL:ENA ), saw its price surge by a whooping 21% today amidst the three white crow pattern that appeared on the daily price chart hinting at increased buying pressure.
Ethena, weeks back was down losing almost half of value, bulls took advantage of the dip and capitalize on the oversold nature of MIL:ENA , presently placing the RSI at 58 which is neither overbought nor oversold but hints at a continuous buying pressure.
In the case of a market pull back, MIL:ENA might find support in the 78.6% fib retracement level, similarly, a break above the 1-month high could pave way for a new resistance point with massive influx of buyers in the long term.
Ethena Price Live Data
The live Ethena price today is $0.439498 USD with a 24-hour trading volume of $758,695,169 USD. We update our ENA to USD price in real-time. Ethena is up 16.02% in the last 24 hours, with a live market cap of $1,416,695,330 USD. It has a circulating supply of 3,223,437,500 ENA coins and the max. supply is not available.
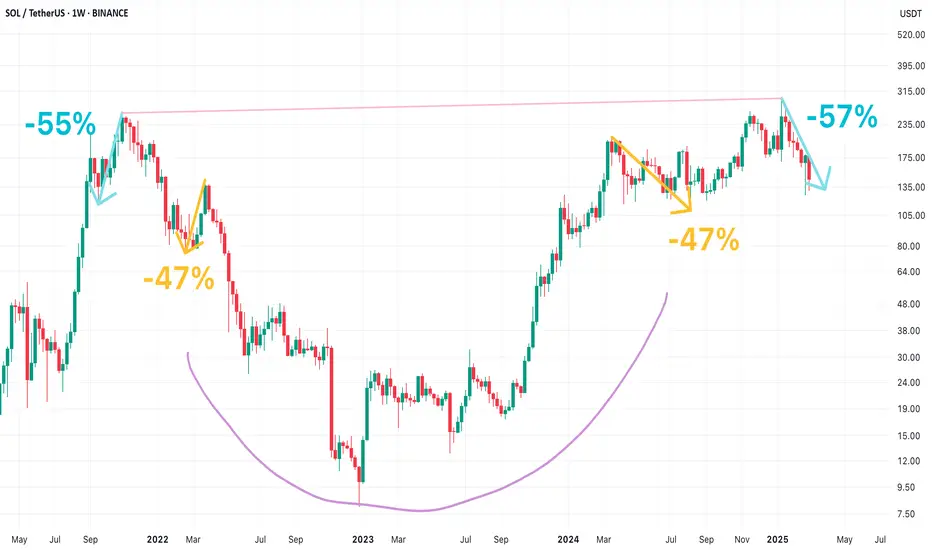
SOL formed Weekly H&S, Pump Potential Could Be HugeLast time, I shared an analysis predicting that CRYPTOCAP:SOL could drop to $131 to form the second right shoulder of a massive Head and Shoulders Bottom. (I’ve included the related publications for you to check.)
That drop has played out recently, and COINBASE:SOLUSD has hit the target.
The weekly Head and Shoulders Bottom on BINANCE:SOLUSDT looks perfect, with two dips on each shoulder and nearly identical drop sizes.
If this pattern holds, the upside potential is massive—breaking $1,000 could just be a matter of time (and that might even be a conservative target).
But, please always set a stop-loss for your trades—there are no guarantees in any scenario.
🔴 Read my signature & publications for more info you don’t want to miss.
🔥 for more future "guesses" like this!
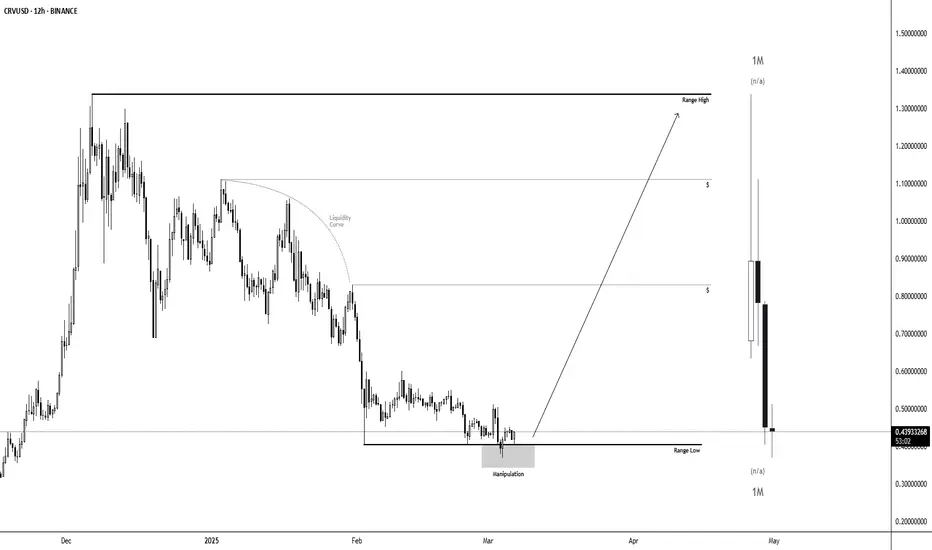
CRVUSDT Long after Liquidity SweepPrice Action & Range:
The price has been in a downtrend, forming a range low and a range high.
There is a clear liquidity curve, showing a gradual decline in price before stabilizing.
The price recently tested the range low, where manipulation occurred (highlighted in grey).
A potential bullish reversal is anticipated, aiming toward the range high.
Key Levels:
Range Low: The lowest price level in the marked range, acting as strong support.
Range High: The highest price level in the marked range, acting as resistance.
Two intermediate target levels are indicated.
Manipulation Zone:
A grey box at the range low signifies market manipulation, likely a stop-hunt or liquidity grab before a move up.
Future Price Projection:
An upward arrow suggests a forecasted price increase toward the range high.
1M Candle Overview:
The right side of the chart includes a monthly (1M) candlestick, showing significant volatility with a large wick.
Summary:
The chart suggests that CRV is currently at a strong support level, and after a manipulation event, the price is expected to rally towards the range high.
The analysis aligns with a liquidity-based trading strategy, aiming to capture the next big move.
OTHERS - Bullish PhaseOthers now at 250B, considering that the Bitcoin price could still drop..there are still at least 250B more to pour into Others.
Apr - May looks promising for some altcoins.
Thank you,
This is not a trading advice.
St.Gex
COREUSD - Bullish PhaseCore is a new project, market loves this project in a new cycle.
Tokenomic are good.
Partnerships are important.
In case that euphoria enters in the market we can even see a new ATH.
Thank you,
St.Gex
This is not a trading advice!

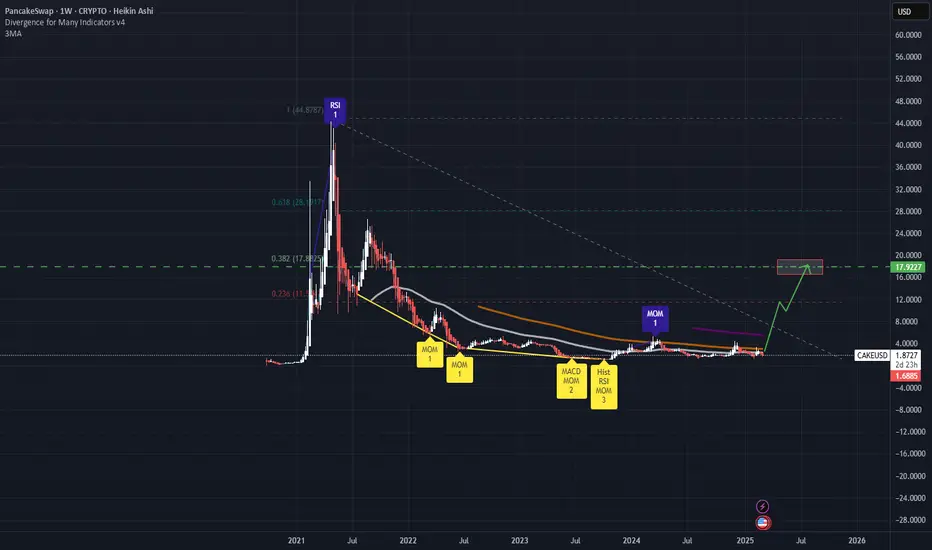
CAKEUSD - Bullish PhasePancake Swap was a used App lsat cycle.
Backed by Binance.
Small Market Cap.
~70% of Total supply unlocked.
Time to jump soon.
This is not a trading advice.
Thanks.
St.Gex
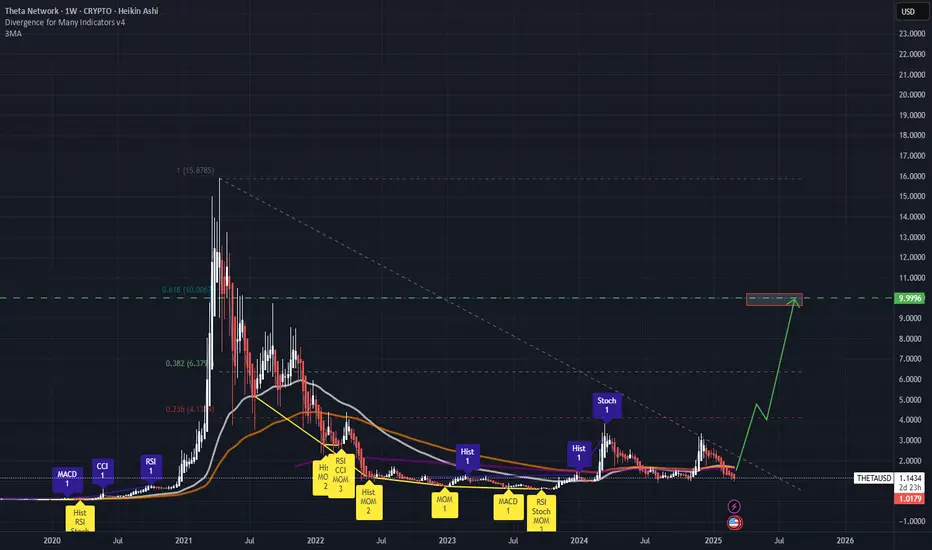
THETAUSD - Bullish PhaseTHETA is a good project with nice partners.
Tokenomics are great.
There are few chances that the project would reach again same ATH as last cycle but still it s ~ 7x
This is not a trading advice.
Thanks
St.Gex
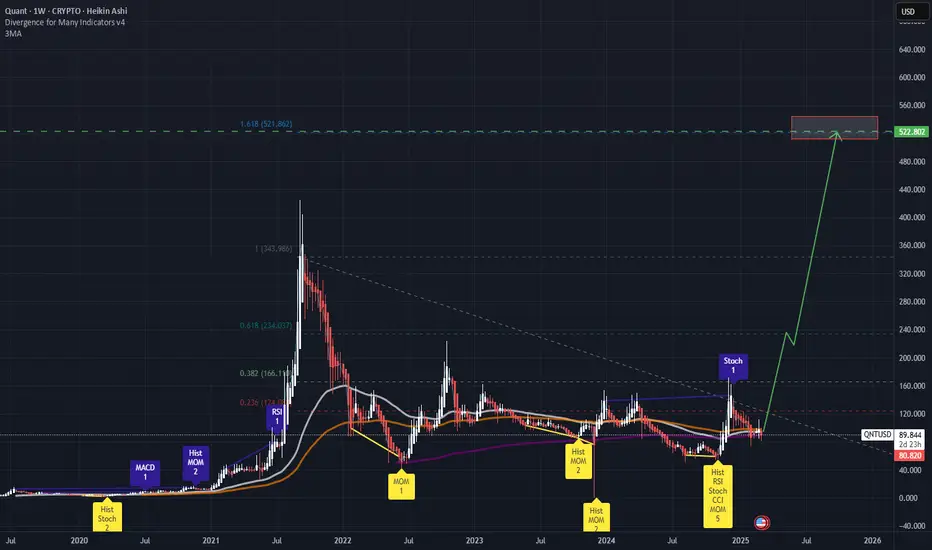
QNTUSD - Bullish PhaseGood tokenomics.
Medium caps entering a bullphase.
QNT is at a good level.
Thank you,
St.Gex
Not a trading advice!
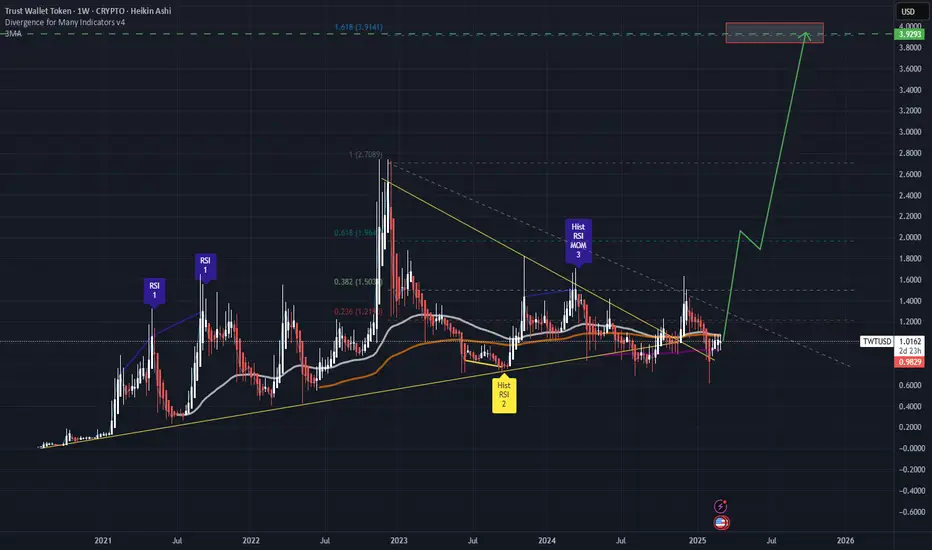
TWTUSD - Bullish Phase TWT - Backed by Binance
TrustWallet App known and used.
400 Market Cap - 1B Fully Diluted
Good tokenomics.
Good Listings.
Thank you,
St.Gex
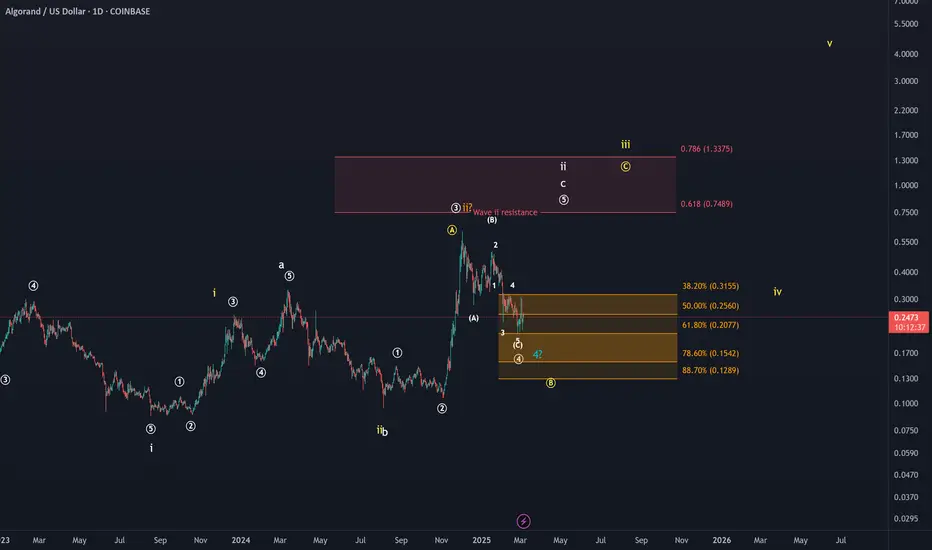
ALGO (Algorand) Altcoin Analysis. One More High in this Cycle?ALGO: The price is currently testing the 61.8% retracement level, which is the last relevant support level for wave 4 in the white scenario. While the idea of a fourth wave pullback will not be invalidated below this level, other interpretations will become more likely. The orange scenario allows for the interpretation that a long-term price top has been established, but this is currently not yet seen as preferred scenario. A wider wave B correction would be a likely alternative, should the price break below $0.20. However, due to the questionable chart context, such as a 5-wave move down into the 2023 lows, I do not expect new all-time highs to be reached in this cycle.
POL: Key Support Holding or Deeper Correction Ahead?POL: From a price perspective, the pullback into support between $0.186 and $0.357 aligns well with the idea of a fourth wave within a larger upside impulse. However, the prolonged nature of this retracement reduces confidence in that outlook. Given the complexity of the correction and the broader position within the crypto cycle, a break of support and a deeper correction remain plausible. In that scenario, a test of the $0.023 - $0.065 region could come into play. It may be prudent to wait for a clear confirmation of a local low before turning bullish on this chart again.

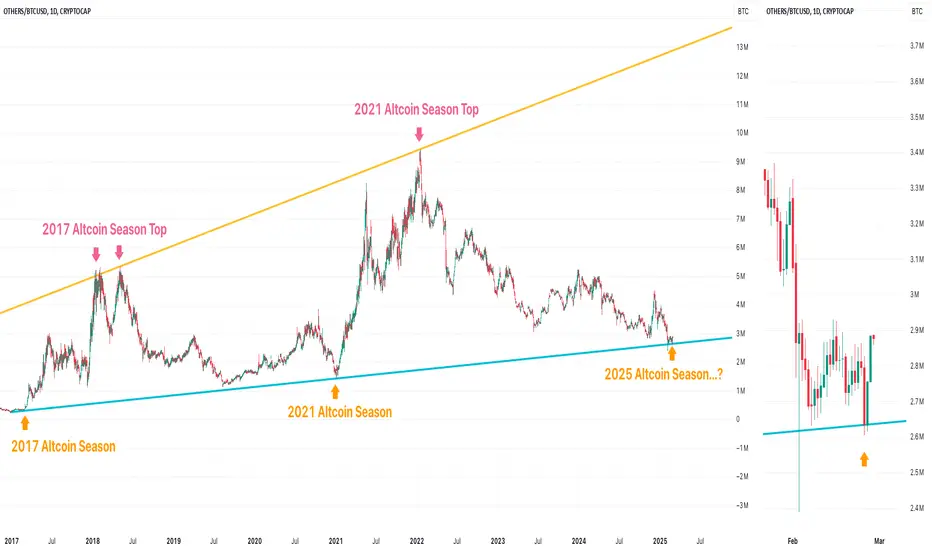
Potential Pattern for Altseason 20252020 Altcoin Season Bull Run:
Large Head & Shoulders Bottom ➡︎ Pullback ➡︎ Breakout of Downtrend Line → Massive Pump
Current Situation:
Large Head & Shoulders Bottom ➡︎ Pullback ➡︎ ❓
Do you still believe in the bull market?
Leave a comment!
🔴 Read my signature & publications for more info you don’t want to miss.
🔥 for more future "guesses" like this!
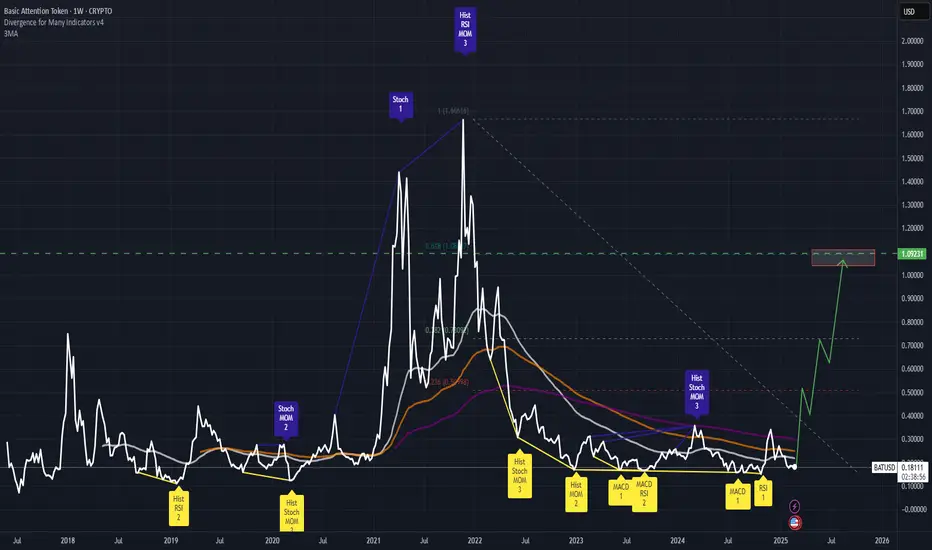
BATUSD - Bullish Phase StartsHello,
Altcoin season starts,
BAT is already listed on Grayscale, it can be compliant for an ETF also.
Good Fundamentals,
Thanks,
St Gex
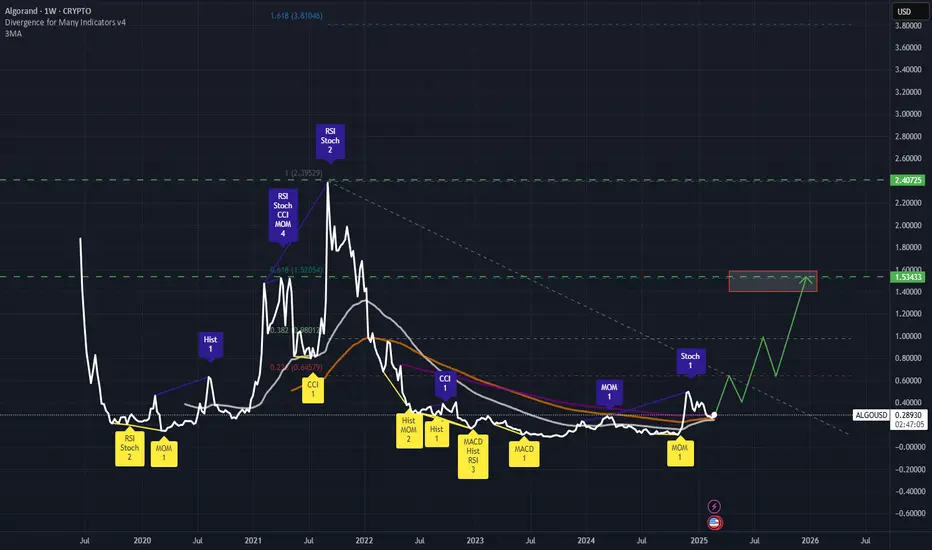
ALGOUSD - BULLISH PHASE STARTSHello,
Micro and Medium Caps entering bull phase for next ~2Months.
ALGO could be a good choice because it is ISO 20022 compliant, is somehow US friendly and could apply for ETF also.
This is not a trading advice!
Thanks
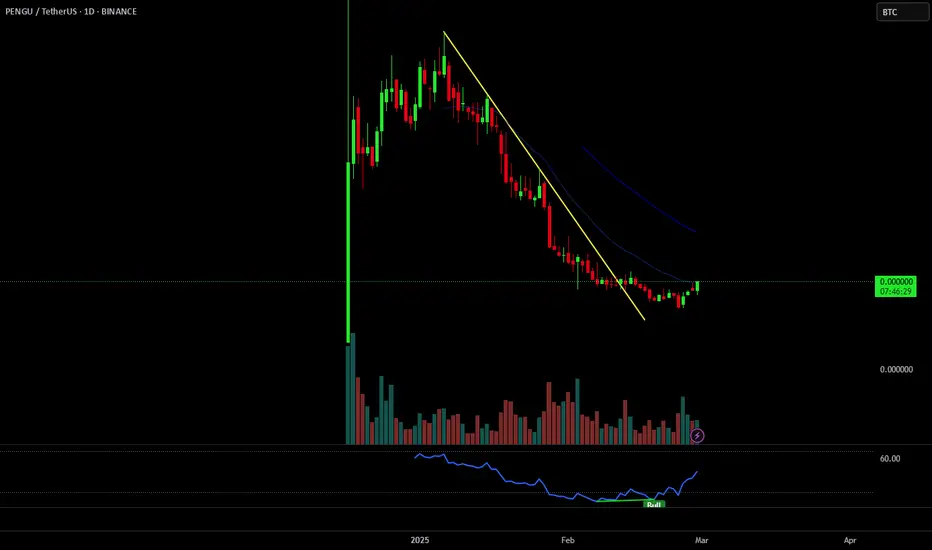
PENGU looking BullishPENGU is looking very good at these levels, PENGUBTC broke the downtrend line, and made a bullish divergence in the RSI on the daily timeframe which could perfectly mean that have found a bottom.
Fundamental Bullish catalyst - Pudgy Penguins has partnered with Mythical Games to develop "Pudgy Party," a AAA mobile game set for launch in 2025. This game, focuses on teamwork and shared rewards, aiming to be a top party game for fans. This expansion into gaming could attract millions of new users, increasing the token's utility and market interest, given the project's existing fanbase and the success of Mythical Games' titles like NFL Rivals.
Pengu community is strong, I like the risk reward here.
Where Did Altcoin Season Go?Ah, Altcoin Season —that magical time when every random token is supposed to skyrocket, turning you from an average investor into a crypto mogul overnight. At least, that’s what the hype says.
Yet, despite endless Twitter (sorry, X) posts and YouTube thumbnails screaming, "It's coming! Any day now!", it still hasn't arrived.
So, let’s cut through the noise and ask the real question: Why didn’t Altcoin Season happen?
________________________________________
1. Everyone Was Expecting It—But Someone Was Selling
There’s an unwritten rule in financial markets: When everyone expects something to happen, it probably won’t.
Every self-proclaimed crypto guru has been yelling: "Altseason is here! 100x! To the moon!"
Meanwhile, someone was selling.
Instead of an explosive rally, we got some pumps followed by brutal sell-offs. Why? Because while retail traders were waiting for liftoff, big players were cashing out quietly. Someone always has to be the exit liquidity.
________________________________________
2. The Market Is Not the Same as 5 Years Ago
Just because Altcoin Season happened in 2017 or 2020 doesn't mean it will play out the same way again.
The crypto market has changed dramatically:
• No more reckless retail FOMO throwing money at anything with a flashy logo.
• Institutions have entered the space—but they don’t care about low-cap moonshots.
• Liquidity is more concentrated—Bitcoin and a handful of top coins dominate the inflows.
Altcoin Season thrived when everyday investors piled into random projects without thinking. But after multiple crashes and rug pulls, that blind optimism has vanished.
________________________________________
3. Projects Make Promises, But Don’t Deliver (Shocking, Right?)
Let’s be honest: Who makes the most money in crypto projects? Right—the developers.
Every market cycle, we get new buzzwords: DeFi revolutions, AI-blockchain fusion, metaverse takeovers… but what actually happens?
• Fancy whitepapers, vague roadmaps—but great marketing.
• Tokenomics built to enrich insiders, not retail investors.
• Initial hype, then a slow decline—until the next trendy project appears.
At this point, we all know only a tiny fraction of altcoins provide real innovation. Without real progress, there’s no fuel for a true Altcoin Season.
________________________________________
So… Is Altcoin Season Dead?
Not necessarily. But it’s no longer a guaranteed, predictable event. The expectations have changed.
• Without new retail money flooding in, who’s pumping these coins?
• With Bitcoin dominance high, who’s paying attention to altcoins?
• If most new projects exist to enrich devs, why would an altseason even happen?
Instead of waiting for a mythical altcoin boom, maybe the smarter move is to ask yourself:
Am I investing in a solid project, or am I just hoping to be "the lucky one" who catches the next 100x?
Either way, good luck with your HODLing—and with those "If I had just invested $100 at that price..." screenshots.

The Others UpdateThe market is testing your patience, trying to shake you out so they can buy back at a lower price. Stay strong and hold your ground.
Observe the chart carefully, a perfect double bottom was formed earlier, while now the RSI remains elevated, signaling potential strength in Altcoins.
As always, the crypto market will move faster than you can react.
Happy Tr4Ding !
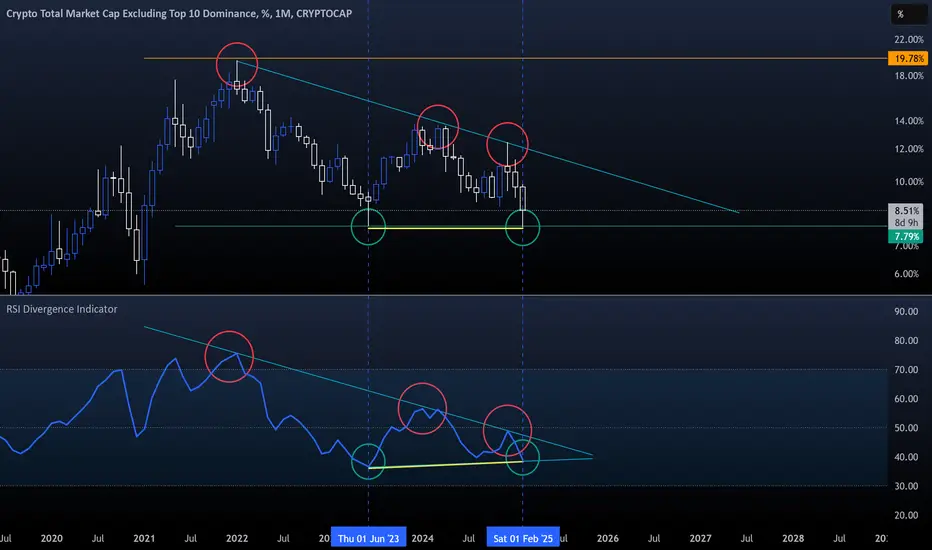
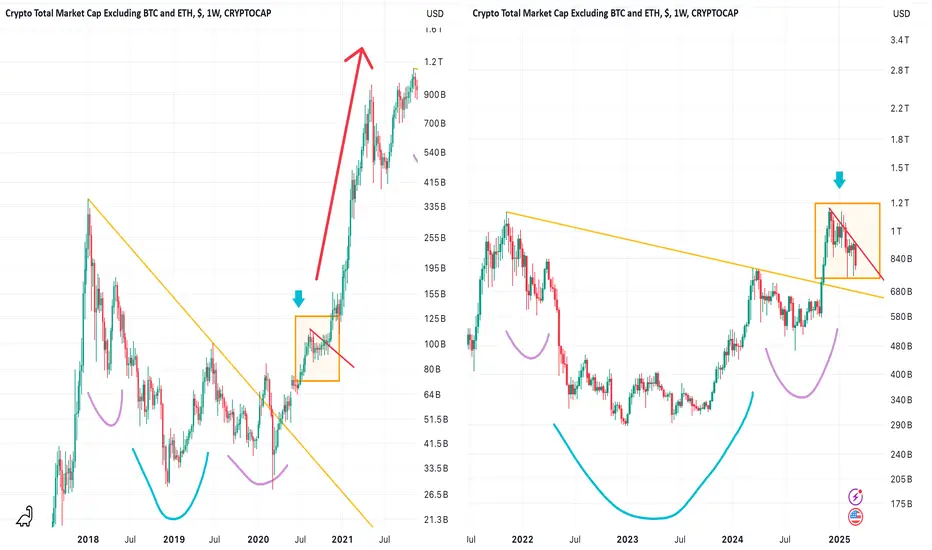
Altseason Might Still Come...? Here's Why:A contrarian take—altcoin season could still be on track, and the script hasn’t been broken.
🔥 Left chart:
Before the past 2 altcoin seasons, the market touched the trendline (light blue) and consolidated at the lows.
🔥 Right chart:
Over the past two days, BINANCE:BTCUSDT saw a sharp drop, yet altcoins ( CRYPTOCAP:OTHERS.D ) gained against BTC for two consecutive days, showing a decoupling from BTC’s price action.
One key characteristic of altcoin season is when altcoins rally with CRYPTOCAP:BTC but don’t drop when BTC falls.
What do you think?
Leave a comment!
🔴 Read my signature & publications for more info you don’t want to miss.
🔥 for more future "guesses" like this!
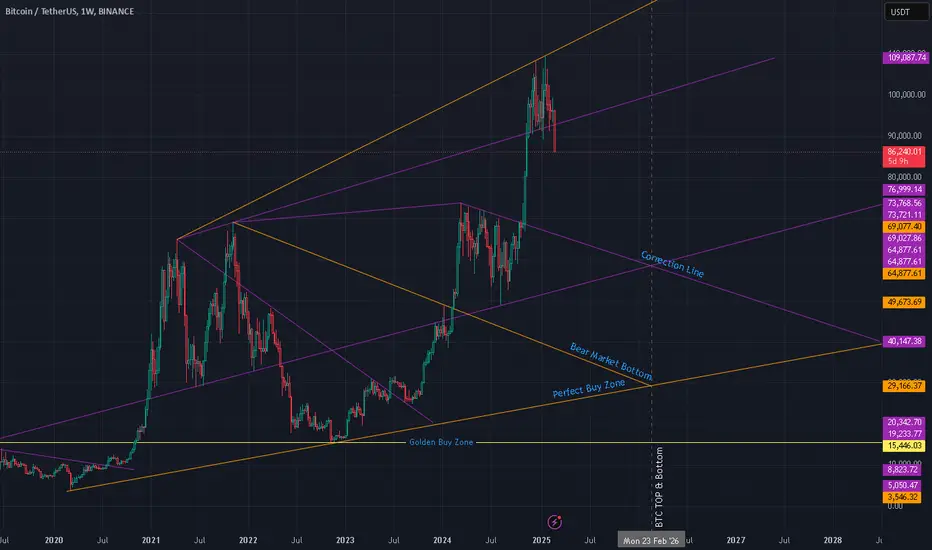
My Long-term BTC Idea March 2025 IMPORTANT MONTH FOR BITCOINBitcoin (BTC) Analysis - Not Financial Advice
Disclaimer: This is not financial advice. These are real trend lines that you can draw yourself. While the current trend appears bearish, it might also present a good buying opportunity. Personally, I’ve struggled to trade Bitcoin successfully because emotions often get the better of me. For instance, I saw WIF at $0.02 but didn’t buy because I had also seen it at $0.00002. This example highlights that the current price isn’t always a reason to avoid buying. That said, I am currently holding off.
Key Insights from the Chart:
Current Price Action: BTC is around $86,845, correcting after hitting a high near $96,500. It appears to be testing a support line within an ascending channel.
Trend Channels:
The broader ascending channel (orange lines) suggests a long-term bullish trend.
Mid-range correction lines and resistance levels (purple lines) highlight key price zones.
Support and Resistance Levels:
Key support: $69,077, $64,877, and $49,673.
Major resistance: $109,087 (upper boundary of the orange channel).
Buying Zones:
Golden Buy Zone: Around $15,446, ideal for long-term entries during deep corrections.
Perfect Buy Zone: Slightly above $29,166, a strong buy area if BTC pulls back.
Bear Market Bottom: Approximately $40,147, a solid long-term support level.
Market Outlook:
Short-term: The correction might continue until BTC tests the mid-level purple line or the $73,721 level. A bounce from these levels could signal a continuation of the bullish trend, potentially pushing toward the $109,000 target.
Long-term: If BTC stays within the ascending orange channel, a long-term target above $109,000 remains realistic.
Risk Factors: A break below the correction line or falling outside the channel would indicate a bearish reversal.
Personal Perspective:
With the monthly candle closing in three days, BTC needs to push upward to form a wick, signaling bullish potential. If not, attention shifts to the weekly candle. Predicting the outcome is uncertain—this could either be a buying opportunity or a liquidation zone. Remember, back in 2021, BTC hit FWB:65K , then dropped to $30k, which turned out to be a great buying opportunity as it later surged to $67k.
Altcoin Season:
Some believe altcoin season is coming, but I think it already happened in 2024. Raydium (RAY) soared from $0.12 to $9, and coins like WIF and Fartcoin also surged. Unfortunately, many low-quality coins have been pumping, with less-experienced investors driving the trend.
Conclusion:
Despite the current bearish sentiment, this market phase might offer solid buying opportunities if key support levels hold. The next few days are crucial—watch how the monthly candle closes and monitor the weekly candle for further signals. As always, trade carefully, and don’t let emotions dictate your decisions.
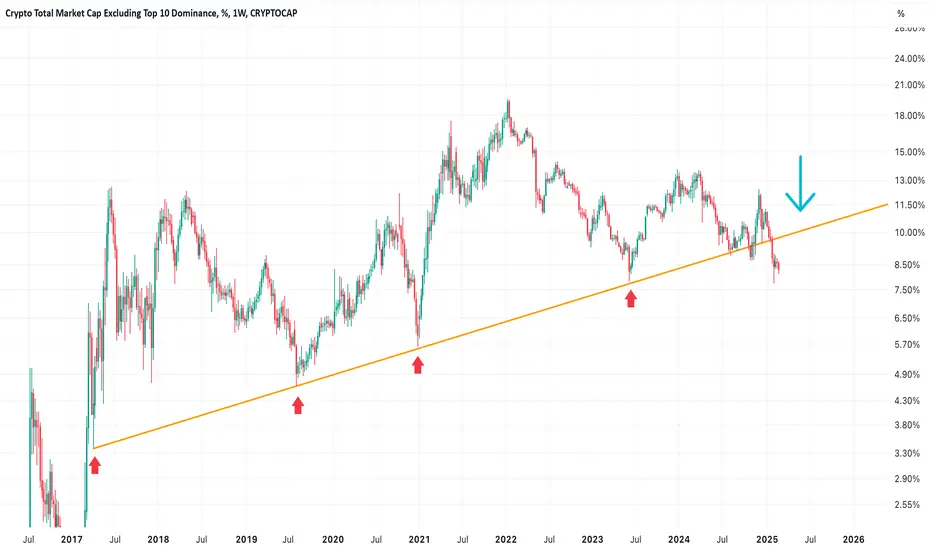
No Altseason Until Other.D Reclaims the UptrendApparently $Other.D has broken through the upper trend line for weeks.
In the past four times, altcoins surged when other.d touched the trend line.
Now it has broken this pattern.
We will not have altcoin season until it goes back to above the upper trend line.
In the past few weeks, those shorting altcoins outside the Top 10 have actually made more profit.
Hang in there, for those who waiting for altseason.
🔴 Read my signature & publications for more info you don’t want to miss.
🔥 for more future "guesses" like this!