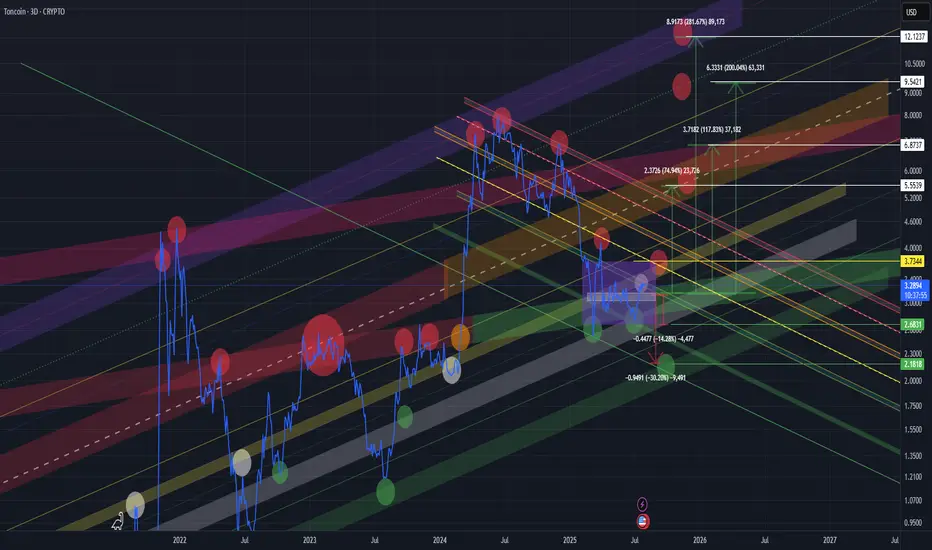
TONUSD TONUSDT TONCOIN mid- to long-termIn my view, we are still in the accumulation phase. The current price action and reactions at key levels suggest ongoing accumulation.
🔻 Bearish Scenarios:
In the short term, a retest of the lower boundary of the accumulation zone (purple box) is possible if the market weakens.
The worst-case scenario would be a move down to the lower green support zone, which has historically triggered strong bullish reactions. This is a critical demand area.
🔼 Bullish Scenarios:
A confirmed breakout and hold above the white line (within the purple box) would signal strength and a potential move higher.
We would then likely see a retest of the upper boundary of the accumulation zone.
A breakout and consolidation above the yellow line would open the door for a move toward the wider yellow channel, which could act as a final target zone
🚨 High-Risk Zone:
The yellow channel might represent the final phase of the current move.
From there, we could see either a sharp correction
Or, if trend strength and macro conditions allow, a continuation towards a new ATH (purple line).
📌 📌 📌 :
All marked lines and zones represent key support and resistance levels.
Price reaction at these areas will be crucial for decision-making.
As always, risk management and trend confirmation are essential.
Altcoinseason2025
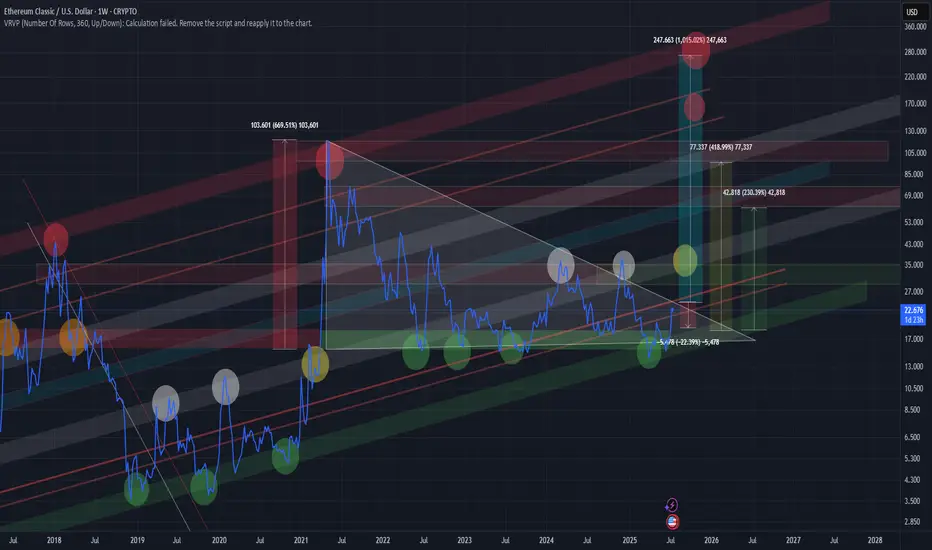
ETC/USD – Weekly Chart Overview Ethereum Classic is trading at a key long-term support zone, bouncing from the lower bound of a multi-year ascending channel. Historically, this zone has triggered large rallies (2019, 2020, 2021).
Major resistance levels are stacked at $24, $42, $77, and $103. If the price holds above $22–24 and breaks out with volume, it could retest the mid/high zones of the channel.
Structure remains bullish above $20. Break and hold above $26–27 may signal the start of a new macro wave.
XLM/USD XLM is showing one of the strongest bullish setups right now.
A macro “Cup”, with a smaller “Cup with Handle” forming inside it — a powerful setup often leading to parabolic breakouts.
Before a true breakout, price may fake out to the downside, trapping longs.
This is classic market maker behavior — shakeouts followed by strong reversal and breakout. Stay focused on the reaction around yellow zone.
Currently in the final stages of the “handle” formation.
A breakout may confirm a move toward $4

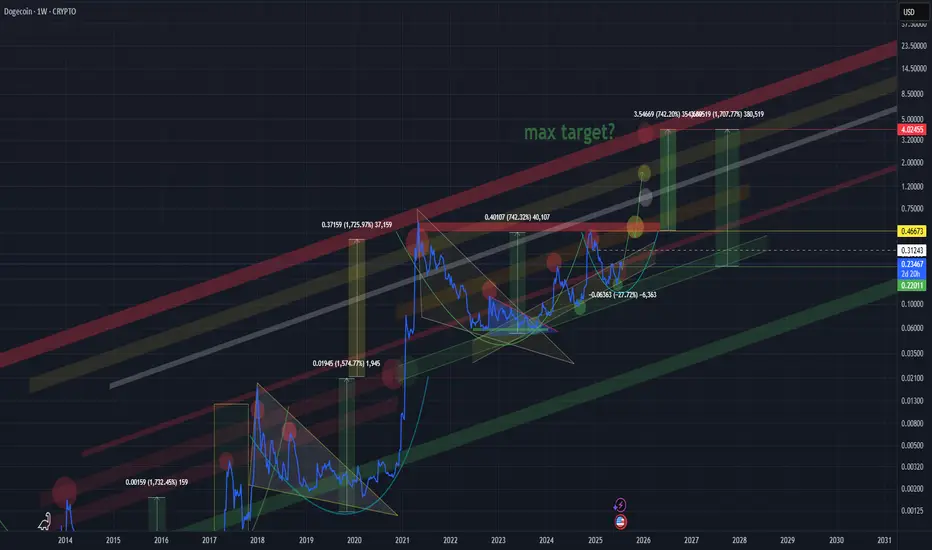
DOGE DOGECOIN DOGEUSDT long/midium term☕ Cup and Handle Forming Again – Targeting $4!
Just like before — we are seeing a massive “Cup and Handle” pattern forming.
Last time, the exact same structure played out, and the price perfectly reached the previous high upon completion of the pattern.
📌 Current Setup
The cup is already formed, and now we are clearly drawing the handle
If history repeats — and it often does in crypto — the price should break out and target above the previous high
🎯 Projected Target:
Based on the structure, the full Cup & Handle breakout points toward a move up to $4.
⚠️ Things to watch
Fakeouts are possible, so use proper risk management
💬 "Patterns don’t repeat exactly — but they often rhyme."
Let the chart guide your plan, not emotions.
SOLANA SOL 1WThis coin is showing very interesting development, and the market maker seems to be painting clear structural patterns.
🔷 Macro Structure: Rising Triangle
On the higher timeframes, we can clearly see a rising triangle formation taking shape. If this pattern breaks out to the upside, the potential measured move suggests a target of up to ~2,500% from current levels.
📊 Chart Overview
Wide zones = key support and resistance
Former resistance often becomes support after a breakout
All target levels and zones are clearly marked on the chart
⚠️ Risk Warning & Realistic Scenario
Be mindful of market behavior:
Often before a bullish breakout, we see a fake breakdown — a trap to liquidate early longs — followed by a return into the triangle and a strong move upward. Don’t rush. Let the pattern confirm itself.
💡 Plan Accordingly
If you're already in, consider protecting your position with a stop-loss
Don’t overleverage, and take profit partially on strong levels

CRVUSDT 3D CURVE DAO TOKENDecided to update the idea. As always, key support and resistance levels are marked on the chart — along with price reactions at those zones.
Currently, we’re observing a potential breakout from a bull flag formation. The mid-term target lies in the $2.3 – $3.4 range, with a possible extension up to $4.8 as a maximum target.
⚠️ Don’t forget: there’s still a chance we get a retest of the bull flag — around the $0.64 level — before any major move to the upside. Manage your entries accordingly

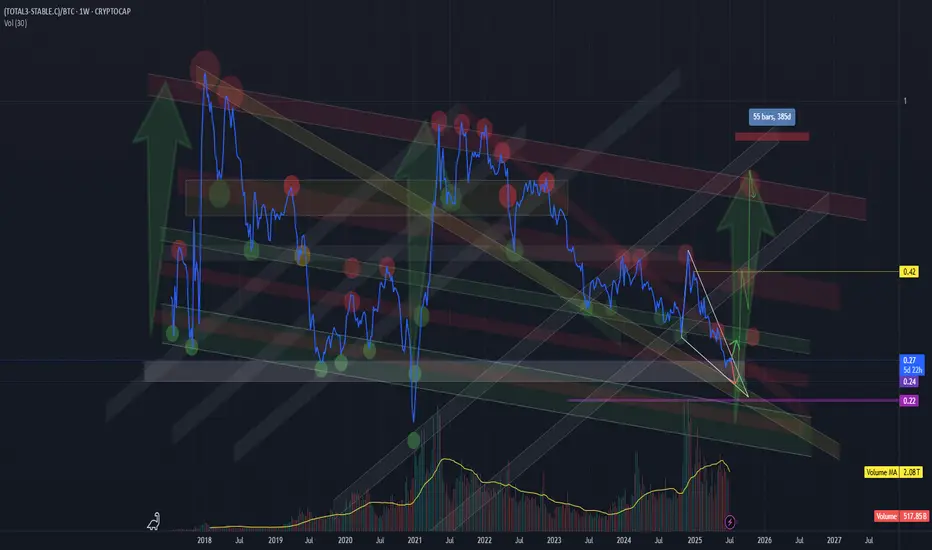
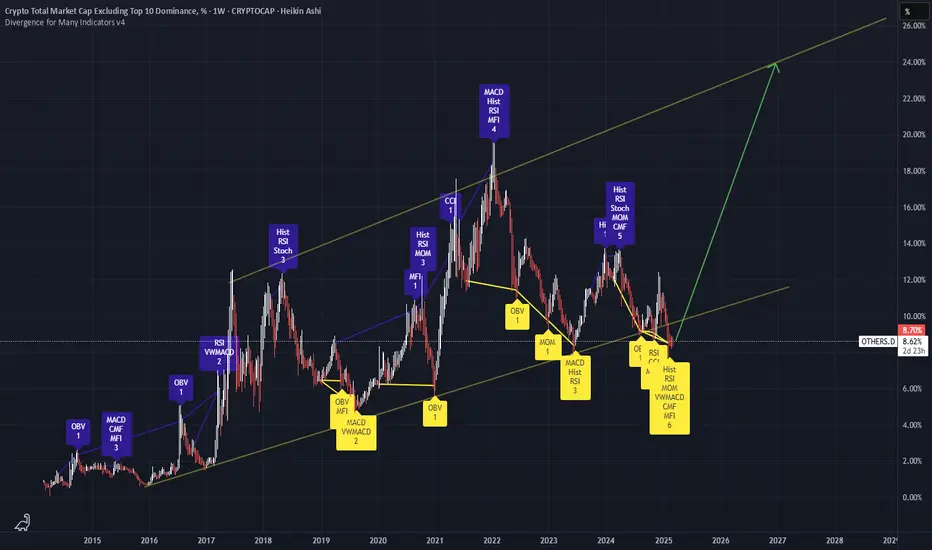
True altcoin-to-BTC strength indicator(CRYPTOCAP:TOTAL3-CRYPTOCAP:STABLE.C)/CRYPTOCAP:BTC
This formula strips out the noise and gives a true altcoin-to-BTC strength indicator.
STABLE.C removes all major stable coins (USDT, USDC, DAI, etc.).
The chart clearly shows previous capitulation zones and launch points for altseasons since 2017
Current formation – potential triangle:
Market makers appear to be coiling price action, forming a triangle-like structure.
This often precedes a volatile breakout — likely to the upside if history repeats.
Market psychology:
Many traders are already heavily positioned in altcoins, which suggests we could be nearing final capitulation.
Historically, altseasons never began with euphoria — but rather fear, exhaustion, and apathy.
BTC halving occurred in April 2024, and typically, the peak of the altseason follows 12 to 16 months later.
The seasonal strength of Q4, often fuels altcoin rallies.
!!! A final washout into a key support zone (on this ratio) could mark the trigger for the next major altseason — possibly starting around August 2025 !!!!!!!!
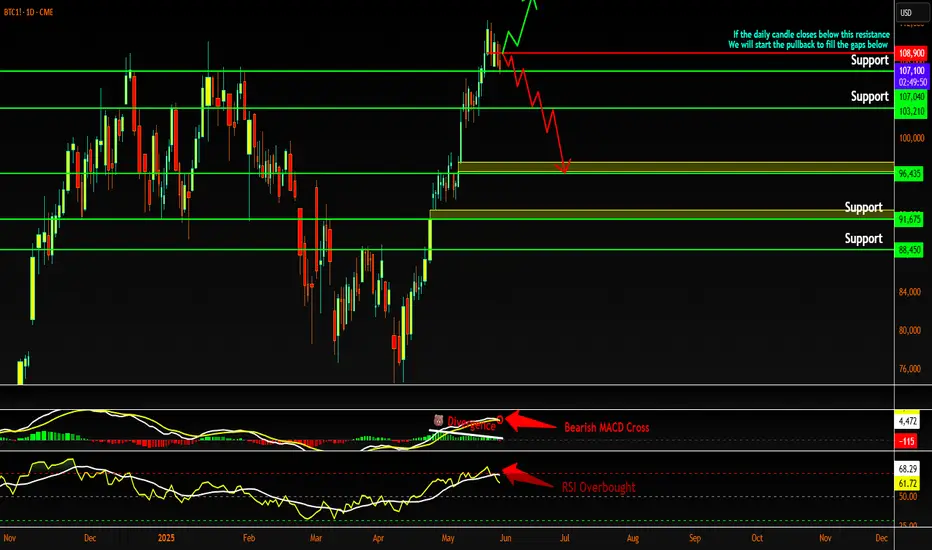
Bitcoin to $115k or pullback to $91kGood Evening Traders,
First I would like to say, congratulations to all of you who have been in the game for the last 3 bitcoin halving cycles. Through all of the "You buy fake internet money" comments or the never ending explaining of the Tokenomics of different cryptocurrencies, I have to say KUDOS to all of us who saw the vision, stuck to your guns and intricately added to your bags over the years! We are finally here on the cusp of full regulation and a final hush of the naysayers!
Ok, now down to brass tax! On the chart I have Highlighted a few important details. Something I did not point out on the chart is the massive printing of USDT that has been happening over the past few days. It seems to me that we are on the cusp of a massive influx of capital into the alt coin markets. But, for now lets focus on Bitcoin! As stated, you can see multiple points that I have highlighted... These being mostly bearish for the big dog of market cap and the grandfather coins of crypto Bitcoin. The first few things to notice is the bearish divergence on the MACD histogram, the bearish down cross of the MACD line over the signal line on the MACD indicator. You can also note the overbought area on the RSI right above that. In addition to this we do have some gaps on CME:BTC1! Which generally get filled sooner than later on most charts.
With this in mind, it is possible that we could have some good news amongst the movers and shakers down at the Bitcoin conference this week. Yet, we could get some sell the news type events that could ease the price downward to fill in these gaps that we have below. In my experience at the beginning of each alt coin season Bitcoin generally leads the rally and can trade sideways to down during the upward movement of the majority of the altcoin market.
My personal thoughts on the chart currently is shown at the top of the chart. if we close the daily candle underneath the hyperlocal resistance shown on the red line at the top of the chart, then we will most likely start pulling back to fill the first gap that is shown on the chart below in yellow. Albeit, the MACD is a lagging indicator, we can gain a lot of insight using it and my favorite sign on the MACD is using the histogram to point out bearish and bullish divergences. This shows a lack in momentum in the current trend that is shown through the price action of the assets trend. Especially, after a straight run up like we have just experienced as of late.
In conclusion, you can make the assumption that if we close the current day under the red line above it is very possible that we begin what could turn out to be an ABC correction leading us down to fill in the gaps on BTC1! to the downside. If we hold the first support, BTC may show us a little more juice potentially reaching for just under $115k. This in my opinion would likely be a bull trap for the time being. Summers are not the best when it comes to crypto growth and it always seems like we are waiting for the Ground Hog to see its shadow to find out if we are to the moon or back to McDonalds with our friends!
I hope that this analysis has helped you gain some insight in your research. I have added supports to the chart to show you where we may turn around and start heading back into price discovery.
Stay Profitable,
Savvy
WELCOME TO THE BEGINNING OF ALT COIN SEASON!Traders, Hodlr's and Soon to be Liquidity (late retail buyers),
This is likely the moment we have been waiting for. Last week in our weekly VIP market update we discussed just a few things that would really show us if we just saw the bottom of the alts and if it was now time to start seeing some new local HH's and then HL's showing us a shift in trend. I had posted a few trades pointing this out. We have now at this point accomplished what we were looking for to see if we would be starting Alt coins season.
We have been watching a few things. The first being Bitcoin Dominance or CRYPTOCAP:BTC.D as this is a great chart to watch and look for reversals prior to looking at the chart of the specific alt coin against BTC to see if it also is showing it could have a rally or a pullback based on your bias on this BTC.D chart. For instance if I were to want to see maybe when XRP would likely start breaking out say that this BTC.D chart is in fact correct and the triangle trend line will end up being the top for btc dominance at around 64.4% of the total market I would go to BITSTAMP:XRPBTC to give myself some insight on confluence of market movements.
Being that we are now here at the point that I believe we will start to see money flow into alts based on this chart and others such as CRYPTOCAP:TOTAL2 , CRYPTOCAP:TOTAL3 and CRYPTOCAP:TOTALDEFI and the specific BTC pairings that I am holding by looking up the ticker of my alt coin/BTC and studying that chart I will honestly say that I am in the 90%/10% bullish on alts to bearish.
I hope this information helped you in your journey to get more information and come up with your own analysis to base your investment decisions and you become prosperous for doing soo!
Stay Profitable Folks,
Savvy!

OTHERS - Bullish PhaseOthers now at 250B, considering that the Bitcoin price could still drop..there are still at least 250B more to pour into Others.
Apr - May looks promising for some altcoins.
Thank you,
This is not a trading advice.
St.Gex
COREUSD - Bullish PhaseCore is a new project, market loves this project in a new cycle.
Tokenomic are good.
Partnerships are important.
In case that euphoria enters in the market we can even see a new ATH.
Thank you,
St.Gex
This is not a trading advice!
