Altcooin
BTC Dominance (Y20.P1.E4).Still room for the upsideHi All,
I hope all of you have done well, even the XRP stubborn HODLers.LOL
Looking on the daily BTC dominance chart, we are in an uptrend on the macro level.
We also have a large ascending triangle formation, meaning we are having a continuation pattern to the upside.
Question is when will it break out of this pattern, to the upside?
Soon I would expect a pullback, potentially to the 8k level and maybe even to the inv. H\S neckline.
Now do we hit 8500 resistance or 8700 resistance or do we go down from here, 8450?
Not an easy question to answer if your shorting like me, selling at major resistances and hopefully buying back at major supports.
So be wise and use the BTC dominance charts so one can know when to "NOT go for the ALTs".
With the BTC dom.chart, I'm looking for some wicks on the daily to tell me when its the ALTs turn and hence sticking to my strategy, accumulate more BTC especially now with a strong breakout.
I believe the bottom has been set for BTC and the 6K region won't be EVER revisited, WOW.
But never say never, don't care if it does or not, just trade.
All the best with your trading, for are hopefully going to see some reward with our patience.
Please give a thumbs up or a like if you agree or just appreciate the effort.
Regards,
SSari / CryptoProspa
Close up, 4 HRLY chart
PREVIOUS BTC DOM. POST
CURRENT BTC TA
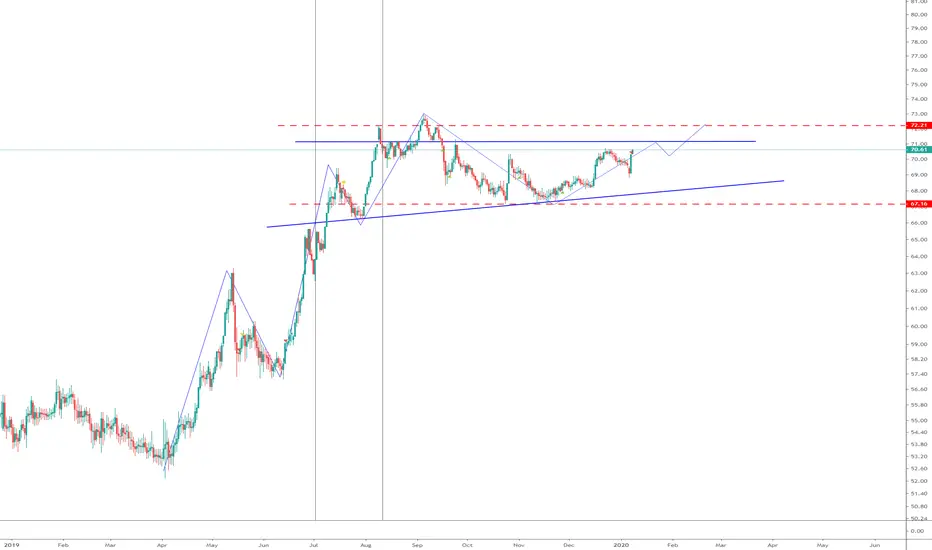
ETHUSD 17/09/2019Hello Traders!
We play with Smartmoney concepts, that means that we look mostly on PA to determine what will happen in future.
As we all know, price is moved by BIG players: Banks, Institutional traders, HFT bots (we call them all of them SM).
They can't play as we do, cause of a HUGE lot sizes, so cause of that they need to SELL to BUY and BUY to SELL for positioning them self in the best possible spot.
If u were learn about trading from free and accessible knowledge, u probably heard about BUYing LOW and SELLing HIGH?
So SM must BUY LOWER and SELL HIGHER :)
We as retail traders are just a small fish in this ocean, so we need to catch the waves which are created by SM.
CHARTS AGENDA:
SM - SMART MONEY
PA - PRICE ACTION
HEC - HIGH ENERGETIC CANDLE (LAST OPPOSITE CANDLE BEFORE MOVE) <- SM MUST SELL TO BUY AND BUY TO SELL :)
BITCOIN SIGN - MONEY POCKET (SL, BUY STOPS, SELL STOPS) - EQH - EQUAL HIGHS / EQL - EQUAL LOWS
BLACK ARROWS ARE ABOVE AND BELOW THESE MONEY SPOTS POINTING FUTURE TARGET
BLUE LINES - ENTRIES WITH SMART MONEY MITIGATION MOVE - SNIPER ENTRY FOR US
BLACK LINES FOOT PRINTS - SPOTS ON CHART WHERE SMART MONEY SHOULD COME BACK TO GET OUT OF THEIR POSITIONS IN DRAWDOWN (SM MUST SELL TO BUY AND BUY TO SELL) - POTENCIAL SNIPER ENTRIES
BLACK BOX - GAP's (IPA - INSUFFICIENT PRICE ACTION) - SPOTS ON CHART WHERE PRICE MOVED TOO FAST, AND LEFT SOME "WHOLES" IN PRICE ACTION WHERE ALGORITHMS WHAT TO COME BACK AND FILL IT BY "HEALTHY" PA.
If u have any questions feel free to ask:)
GOD BLESS U ALL!
