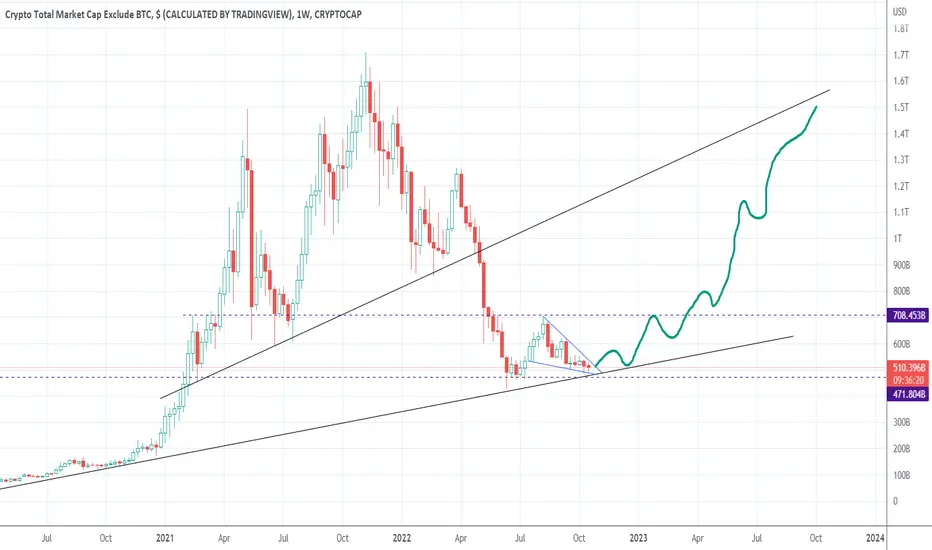
A non log version of total2 c&h & bullflag on the 1month chartBecause the log chart target for the entire bull flag on total2 was so astronomically high I though it ma be wise to also post a linear vhart version as I knew it would have much smaller measured move targets. So here it is.The targets on the linear version of the flag seem far more attainable for the alt market this bull run than the log chart bullflag breakout target does. I do think the log charts flag target can initially be hit but very unlikely this current bull market. *not financial advice*
Altmarket
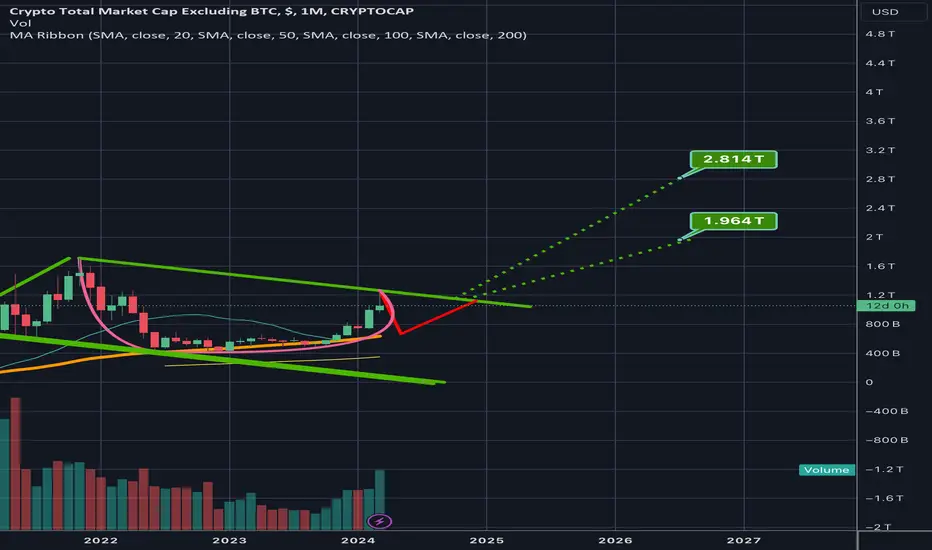
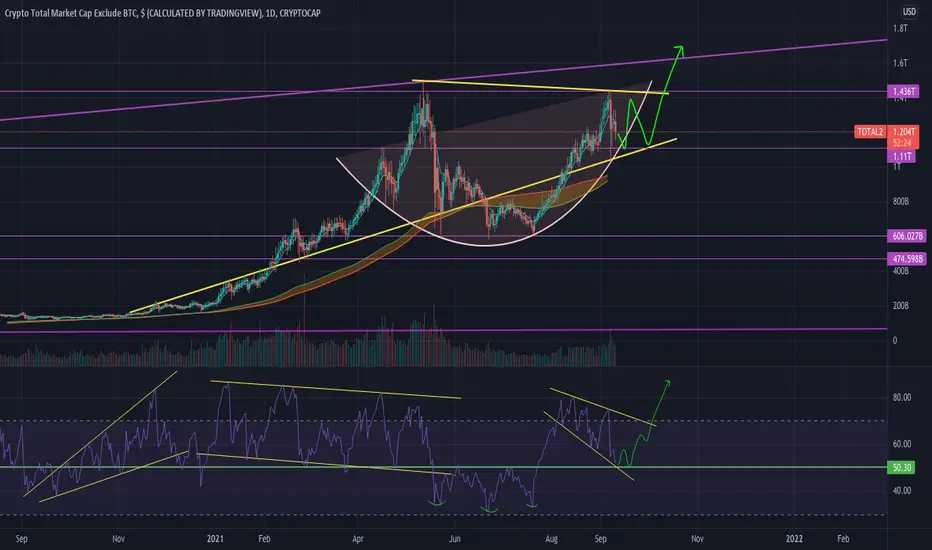
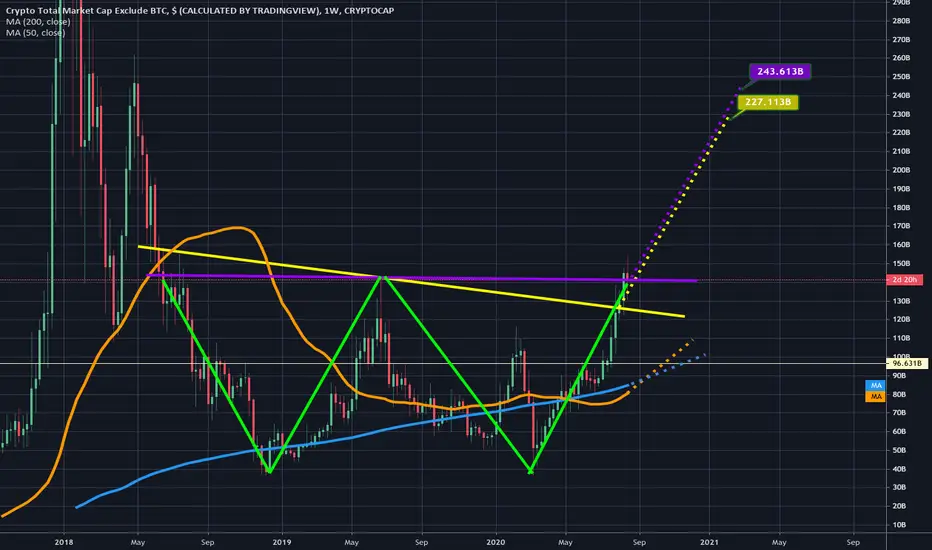
Altmarket Total2 weekly log chart about to have a golden crossShown here is the channel/bullflag and the cup and handle the weekly total2 log chart’s price action has ben forming. It is now forming the handle portion of the cup and handle ad we can see we are about to experience a golden cross of the weekly 50(orange) and 200(blue) MAs in the next couple weeks or so. If the weekly 50ma can hold support then odds are good this thing can break up from its cup and handle and flag maybe by august or september. Possibly sooner possibly later but for now the breakout point of this handle and flag must remain speculative until we see a validation of a breakout. I roughly estimated a width for the handle by factoring in the weekly 50ma being able to hold support. If the weekly 50ma lost support I would then look for the monthly 50ma(not shown here ) to be the ultimate support. Some exciting targets here for the total2 alt coin market once these patterns validate their breakout. The cup and handle certainly seems like an attainable breakout target for the current bull cycle. The entire flag target seems like it could maybe potentially take 2 bull racket cycles to reach, however, If the 17 trillion target on the regular total cryptocap chart can be reached this current bull market. It’s possible that the high target on this chart could be reached this cycle too…this would likely only be if a currency like XRP, solana,link or possibly a mixture of them all suddenly took a lions share of the total market cap away from bitcoin..which seems unlikely…but if for some reason xrp was given for regulatory clarity once the sec ripple case was resolved, there is a chance all the financial institutions could start piling into it with as much ferocity as they currently have been doing with bitcoin….if so, the upper breakout target on this total2 chart could then be completely attainable in the current bull run. For now though I’m only setting my sights on the c&h target for total2. Will update the c&h target more precisely once a breakout point is established. *not financial advice*

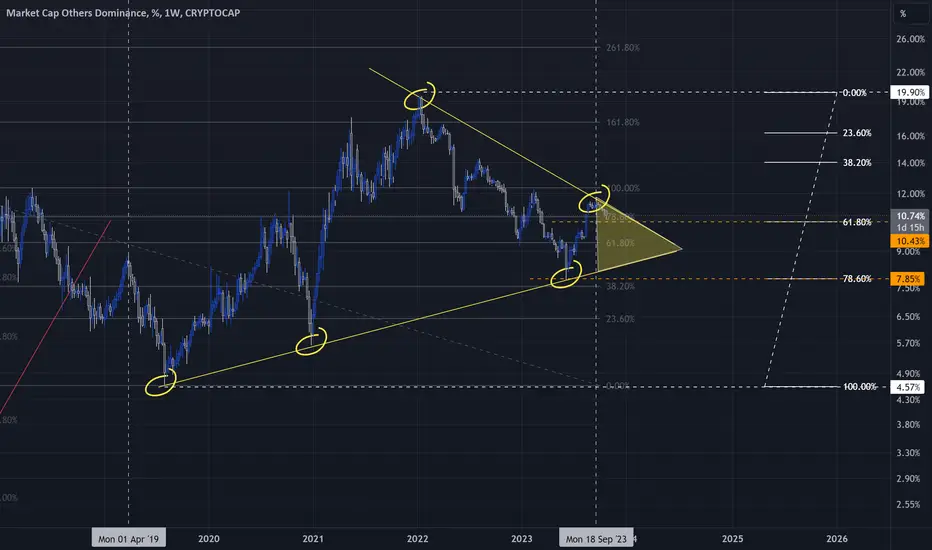
The Others- So you have BTC.D, ETH.D and you have also " The Others".
- There's plenty of other fish in the ocean.
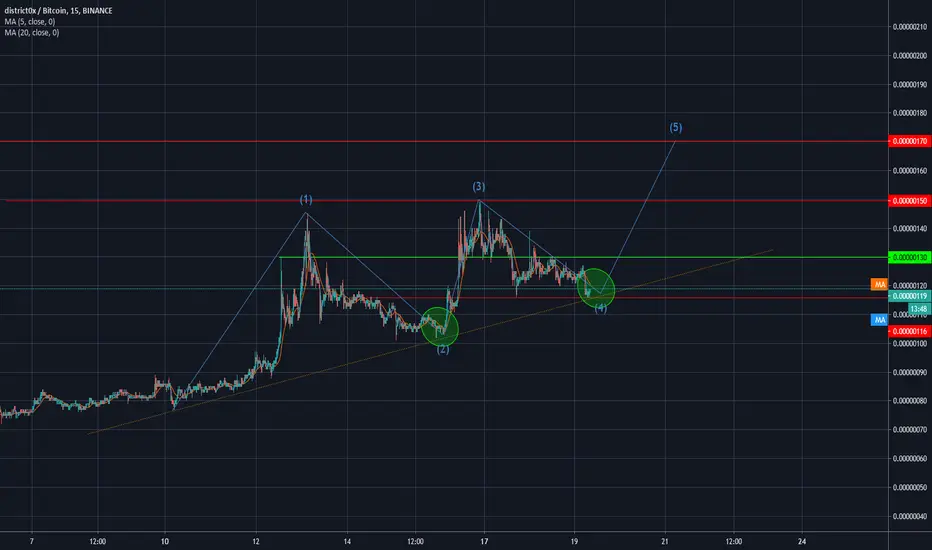
- This is just a Fibo analysis but a bit advanced chart.
- Make your own diligences and learn about fibonacci trading strategy.
- All Fibos retracements and extensions are annotated in the chart.
To keep it basic like always :
- the most interesting thing to follow right now in this chart is :
- " The Yellow zone making a Triangle ".
- Be confident and Hodl steady.
Happy Tr4Ding !
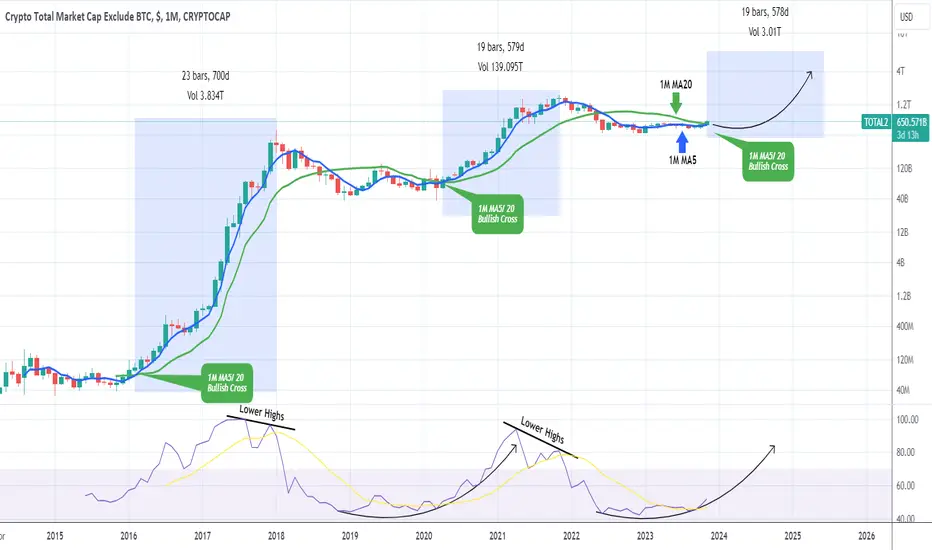
ALTS Exciting time to be invested in the crypto market.The altcoin market is one of the markets that deserves our attention as we close 2023 and start the new year. We have been mentioning that on numerous analyses but the current idea couldn't display it in a simpler, yet more informative way.
As you see this is the total market cap excluding Bitcoin (TOTAL2) on the 1M time-frame. The 1M MA5 (blue trend-line) is about to cross above the 1M MA20 (green trend-line) and form the first such Bullish Cross pattern since April 2020. The only time besides this one that we had such pattern formed was on February 2016. What followed after both sequences was insane parabolic rallies, what is known in the market as 'altseason'. The 1M RSI patterns of the current and the previous Cycle are identical, starting with Lower Highs and now pointing to the exact symmetrical level of April 2020 as the RSI is taking off.
Insane alt season just starting?
-------------------------------------------------------------------------------
** Please LIKE 👍, FOLLOW ✅, SHARE 🙌 and COMMENT ✍ if you enjoy this idea! Also share your ideas and charts in the comments section below! This is best way to keep it relevant, support us, keep the content here free and allow the idea to reach as many people as possible. **
-------------------------------------------------------------------------------
💸💸💸💸💸💸
👇 👇 👇 👇 👇 👇
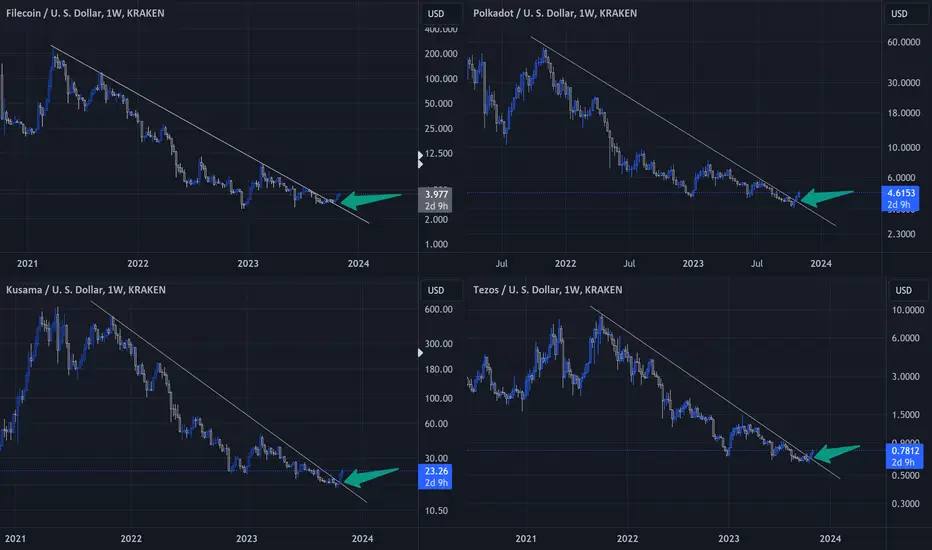
CryptoTime- i just took 4 differents Altcoins in this chart as exemples.
- they are mostly all doing the same.
- Breaking up a long winter market.
- if you repeat this simple chart with your Favorite Token or Coin.
- You will propably see the same.
- if you don't load your bags now.
- Later will surely be too late.
- Choose wisely.
- Don't forget cryptos are faster than you.
- Don't go all in and DCA is always the safer method.
Fortune favors the bold!
Happy Tr4Ding !
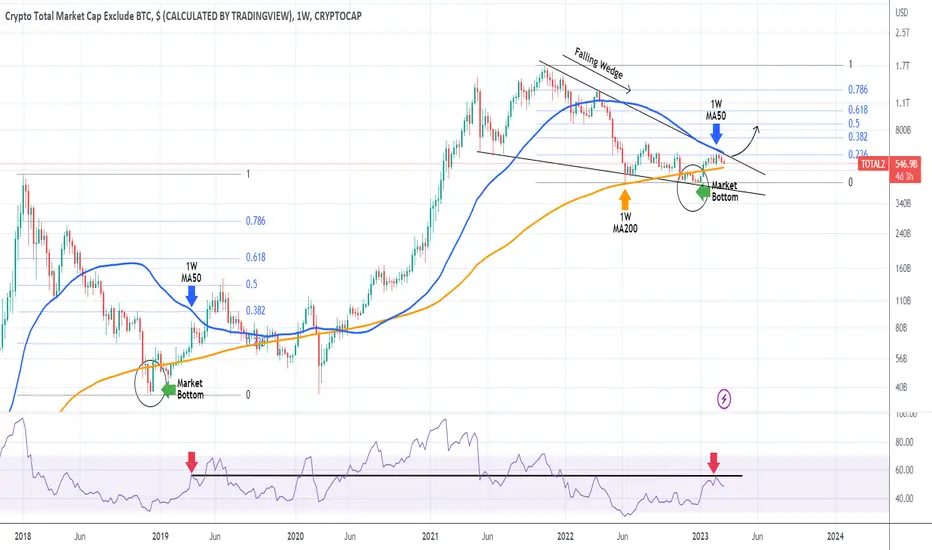
ALTS attempting to break the 2 year Falling Wedge!The Crypto Total Market Cap excluding Bitcoin, has been trading within a Falling Wedge pattern for the past 2 years. Being kept from breaking above the 1W MA50 (blue trend-line) for three straight weeks, it appears that as the 1W MA200 (orange trend-line) continues to support, it will start to squeeze the price action and most likely will cause a break upwards as in May 2019. First target of the Falling Wedge break-out is the 0.5 Fibonacci retracement level at 860. Alts are heating up!
-------------------------------------------------------------------------------
** Please LIKE 👍, FOLLOW ✅, SHARE 🙌 and COMMENT ✍ if you enjoy this idea! Also share your ideas and charts in the comments section below! **
-------------------------------------------------------------------------------
💸💸💸💸💸💸
👇 👇 👇 👇 👇 👇
MARKET UPDATE Hi guys, This is CryptoMojo, One of the most active trading view authors and fastest-growing communities.
Consider following me for the latest updates and Long /Short calls on almost every exchange.
I post short mid and long-term trade setups too.
Let’s get to the chart!
I have tried my best to bring the best possible outcome to this chart, Do not consider financial advice.
Hi guys, This is CryptoMojo, One of the most active trading view authors and fastest-growing communities.
Consider following me for the latest updates and Long /Short calls on almost every exchange.
I post short mid and long-term trade setups too.
Let’s get to the chart!
I have tried my best to bring the best possible outcome to this chart, Do not consider financial advice.
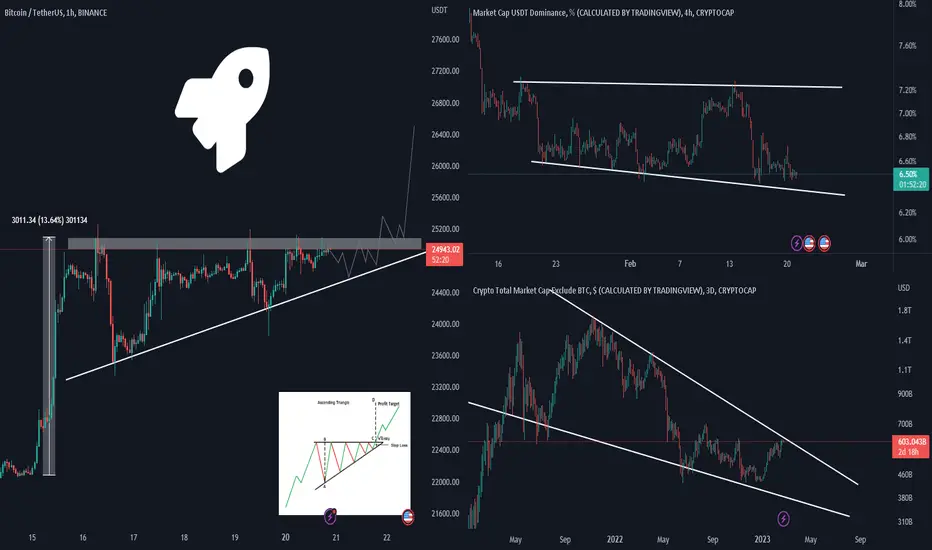
#BTC UPDATE
BTC is forming this big falling wedge pattern
what is a falling wedge pattern?
The falling wedge is a bullish pattern . Together with the rising wedge formation, these two create a powerful pattern that signals a change in the trend direction. Generally, a falling wedge pattern is considered a reversal pattern, although there are examples when it facilitates a continuation of the same trend.
A weekly candle close above 25k could suggest that the market is expecting a bullish trend.
So let's see how the weekly candle closes
* RSI is also sowing some bullish divergences move
#USDT.D UPDATE
We are a few hours away from the weekly close and we can literally see where the market is possibly heading. With the USDT.D bouncing back from the support line and BTC at the resistance, I would highly suggest staying away from leverage trading for now and wait for the market to cool off. If the bounce back is so good to be true then we can expect the USDT.D to reach close to 7.2% resistance. If not then 6.4% is good support for the dominance.
TOTAL 2 UPDATE
We are a few hours away from the weekly close and we can literally see where the market is possibly heading. With the USDT.D bouncing back from the support line and BTC at the resistance, I would highly suggest staying away from leverage trading for now and wait for the market to cool off. If the bounce back is so good to be true then we can expect the USDT.D to reach close to 7.2% resistance. If not then 6.4% is good support for the dominance.
This chart is likely to help you make better trade decisions if it does consider upvoting it.
I would also love to know your charts and views in the comment section.
This chart is likely to help you make better trade decisions if it does consider upvoting it.
I would also love to know your charts and views in the comment section.
Thank you
#ALT MARKETCAP Hitting a Major Resistance. What's Next ??ALT MARKEPCAP is hitting the resistance right now.
This is a threshold point for the alt market.
If the index breaks this resistance alts will pump along with BTC.
I will keep this chart updated follow me for more.
Hit the like button if you like it and share your views in the comment section.
Thank you
#PEACE

Altmarketcap usd 1 weekAltmarketcap usd 1 week
dollar mollar
hadi
to the moon
hedef 2024
dayısı ajan
ALT Market About To BreakALT Market (Excl. BTC & ETH) is looking primed for a breakout with some narrow consolidation forming for almost a month now. Expecting a large break out coming out of this symmetrical triangle. It will be very dependant on the global macro economics and announcements to dictate this next move

ALT M.CAP IS TRYING TO BREAK OUT!!Hello everyone, if you like the idea, do not forget to support with a like and follow.
Welcome to this TOTAL2 (Alt M.cap) update.
Total2 is forming a symmetrical triangle in the daily time frame. Currently, it is at the resistance trendline. Also, there is a 100MA. All we need is a close above the triangle and 100MA for a perfect breakout.
If it gives a perfect breakout then August will be very good for ALtcoins. We might see an 80-100% pump in many Alts. As of now waiting for a breakout.
Support:- $590B
If you like this idea then do support it with like and follow.
Also, share your views in the comment section.

Alt market wants to explode to 2.4 trillionIn order to do so however it must first break out o this cup and handle pattern it has been forming. Many alts at the moment including Ethereum and Tezos are in similar cup and handle patterns. Just waiting on price action to firmly break above the rimline o the cup and lip it to solidified support first before we can confirm the breakout. It could take it’s sweet time locating just under the rimline for multiple daily candles before I ally breaking above. It could be as early as tomorrows candle or it could be multiple weeks away still. Whales may very well be waiting until they see a bunch of people flipping their alt holdings into btc before they finally try to trigger the total2 c&h breakout. Either way, I don’t anticipate most alts currently in a c&h having their breakout until we see the total 2 chart confirm its breakout. My guess is we will see the breakout sooner rather than later as I anticipate the 1 day 50ma(in orange) will maintain solid support and help to lift price action above the rimline and keep it there.

Alt Market Golden Cross, Beating Consolidation TrendThe alt market is looking really bullish. The market cap reads above the consolidation trend shown above on the 15m chart, and we see a golden cross closely approaching fruition between the 180ma and the 9ma. The visible range will give us levels of guidance as we see inflow/outflow accordingly. Good luck traders!
Disclaimer: These are my opinions posted for educational and entertainment purposes only. This is not financial, nor investment advice. I hope you all make tons of money, however I am not responsible for financial loss. This is one of the most volatile markets out there. DYOR
Up before EOY...We could've expected the short term drop in prices according to where we are. Holding tight and waiting for December. Let's print the right shoulder to this massive inverse H&S. Quick breather - September is normally a down month, anyways...
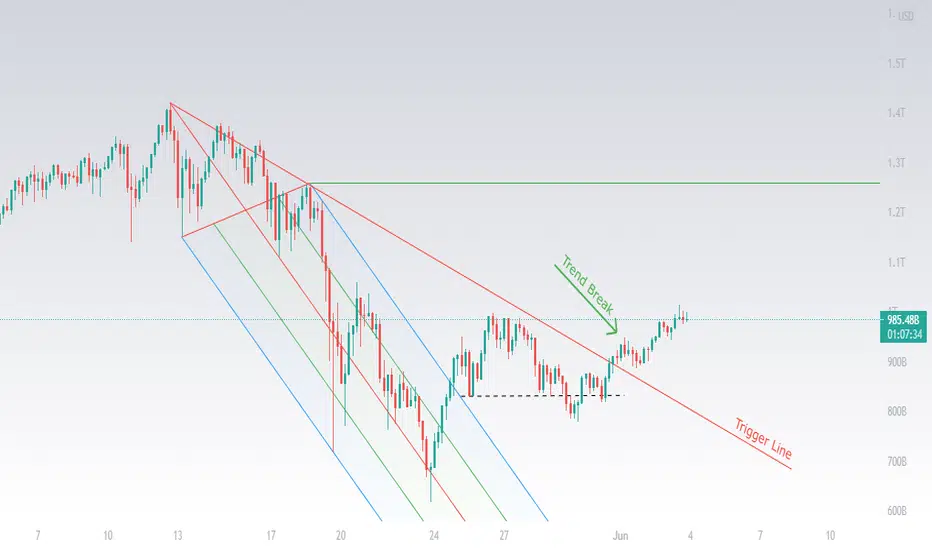
Alt Market Cap Analysis - upcoming opportunitiesHello buddies, how are you?
No need to explain about Alts for what happening over the past couple of days. We had seen huge red candles on the overall market. But most of us did not even imagine that the market will fall that much. So presenting you my thought on the current Alt market cap is what am seeing right now.
- In the chart, you can spot Pitchfork which I drew from the recent top. It was presenting index can be in short term or maybe long term downtrend.
- You can closely look into the pattern, every resistance and support line was working well, price action in this pattern was so much accurate.
For now....
- In the chart, you can see one dotted trendline which was the retest point of the index before moving upward and one red trendline named 'trigger line', yes the index broke this red trendline and the current price action is above this trendline. And what is that means is the price(index) has broken its downward momentum. Technically we may see an index at the green line soon which will be the C point of a pitchfork. If the index followed this pattern as it did in the past then there's a high possibility of relief in the alt market cap. As always we trade on possibilities so make sure you keep in mind every factor of the market and trade accordingly.
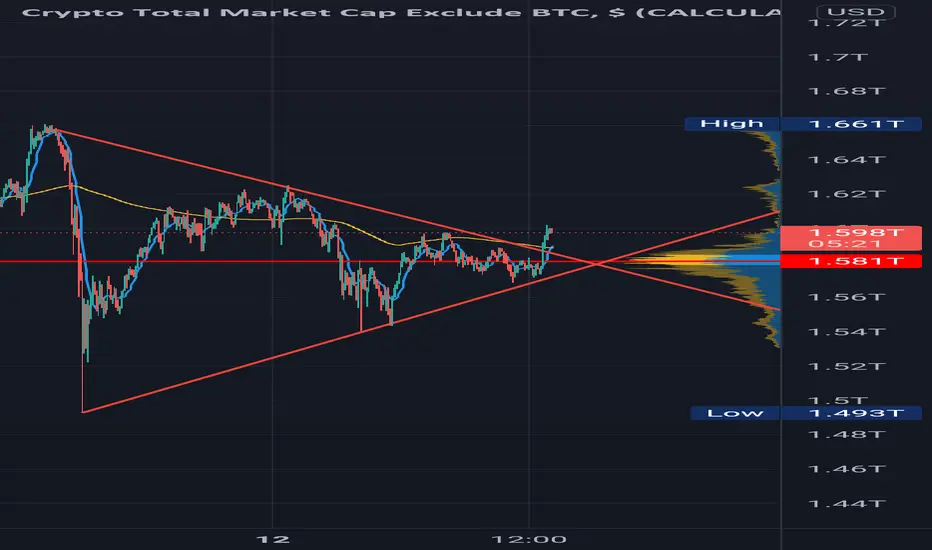
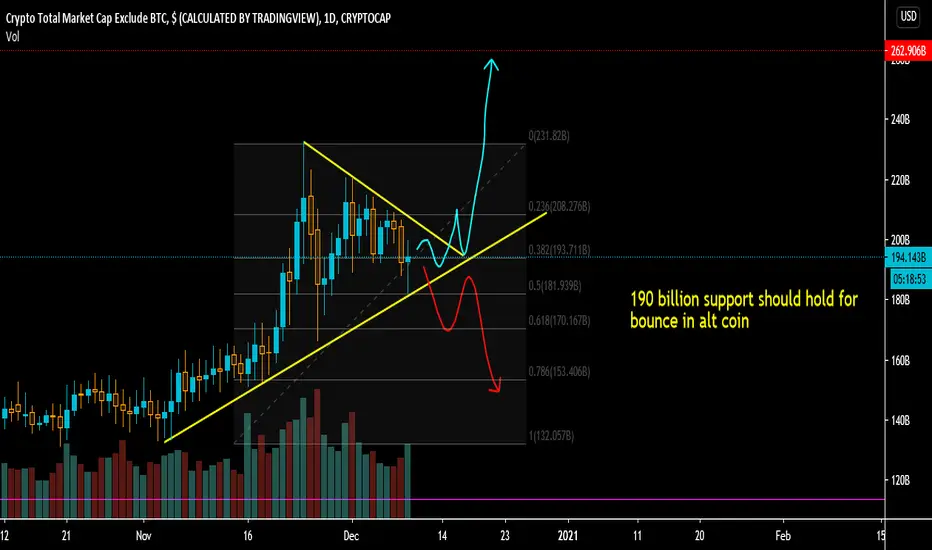
TOTAL2 Updateprice in Triangle holding trend line support very well if hold above this support than it can move higher from here
190 billion should hold for next move in alt coin
breakout above or breakdown
Total2 200 Billionalt coin market is ready to blast with huge 200 Billion volume time to add all the dips and on bitcoin pump dump no need to worry about stop finally .
5 days left for the confirmation candle to close above neckline.Only 5 days until monthly candle close and it's currently still above the double bottom neckline here a monthly close above the neckline would be a very bullish outcome imo. This is the chart for the alt coin market.

Monthly Candle Closes Above the TOTAL2 Chart's Dbl Bttm NecklineThe monthly double bottom pattern on the TOTAL2(Alt Market) has finally gotten it's first monthly close above the neckline. There are 2 possible necklines here a descending one(notated by a dotted yellow line) and a horizontal one (orange yellow). Both price targets for a breakout from each neckline are listed. Not quite sure which one is more legit but we are now on our follow up confirmation candle on the monthly chart. Probability of a confirmed breakout has greatly increased here but we should be prepared for a retest of the neckline and also a smaller possibility of a fakeout just in case.

If Double Bottom confirms Alt season is officially on!we are currently retesting the neckline of this double bottom as support. If it confirms, the altmarkets total cap value has a breakout target rise of over 70%. Need to see the current weekly candle close above the neckline. It appears a weekly goldencross is on the horizonhere so that should help increase the probability of the breakout. Untilwe see where the current weekly candle closes however a fakeout is still possible. Leaning bullish enough however to mark this idea long although as always that is -not- financial advice. Thanks for reading!
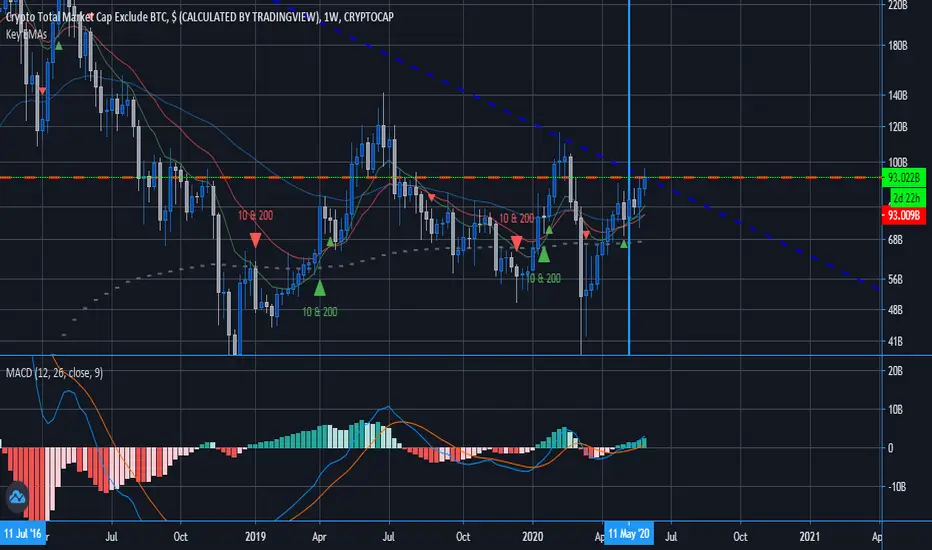
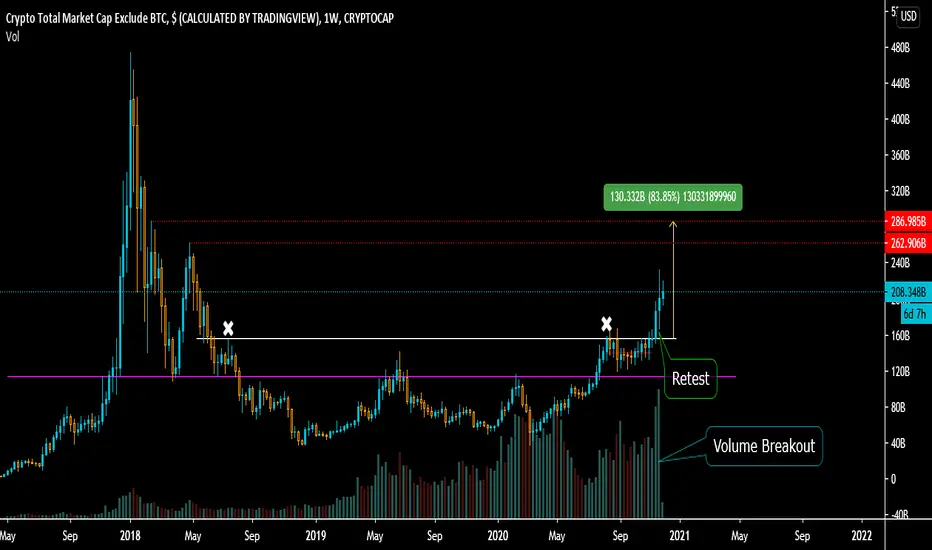
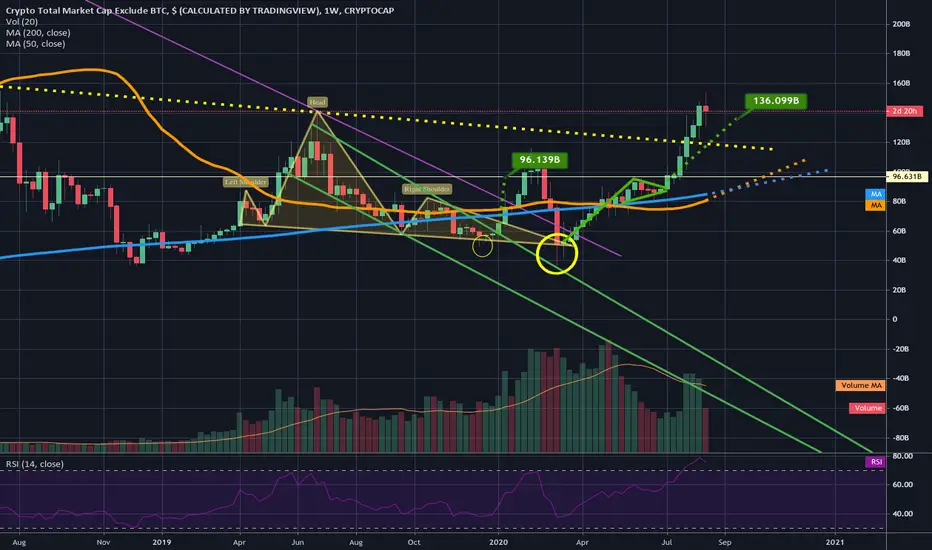
Check out my old weekly chart for the alt market.This one's TA played out like true poetry. I was on my way to post a chart of an exciting double bottom pattern on the TOTAL2 (altmarket) chart and it brought back up some charting I had done on a head and shoulders (in yellow). I was saying in previous ideas over a year ago when we originally formed this big h&s patterns that based on how illogically low the breakout target is we would definitely see this pattern end up being a fakeout which would lead to at best the end of the bear market...many times a bearish head and shoulder pattern is really a bullish falling wedge in disguise and this time was no different. So I have a yellow head and shoulders pattern and a green falling wedge drawn here overlapping eachother you can see I marked the measured move target from where we broke out of the green wedge at $96. we can also see inside the smaller yellow circle, that right before we broke up from the wedge we had price send a wick below the neckline of the h&s likely trapping a bunch of naive bears..it then slingshotted itself out of the wedge and over the breakout target plummeting back into the h&s pattern a few short weeks later for one last fakeout at the neckline (as shown in the larger yellow circle) super interesting how this fakeout candle's lower wick retested the top trendline of the green wedge with absolute precision and the body of the same candle closed perfectly on the support of the neckline. After now confirming the h&s fakeout & the falling wedge breakout simultaneously we shot up to just below the horizontal resistance at 96 but above the 200 and 50 weekly mas until we finally closed a candle above that horizontal resistance after forming a bull pennant of which had a breakout target shown here at $136...upon reaching that target we surpassed our top dotted yellow resistance and will now possible look to retest it as new solidified support. We can see we are mere weeks away from a weekly golden cross which would greatly increase the probability that we maintain the dotted yellow line as solidified support. There is now a bigger pattern on a more macro scale to focus on so immediately after I post this idea I will be posting another one with only the larger pattern which is a double bottom that will also likely trigger and lead to much more upside and a confirmed bull market altseason for the alt market.
TOTAL2 - Critical PointHello Traders!
Looking at the TOTAL2 chart, we are in a critical point, if we get rejected on the upper trendline, we might expect a pullback, or a reversal of the trend.
If you take a look at the daily chart, you can see that there has been a fiercely fight between the bears for almost 3 days on this area, and it seems that the bulls are finally winning, but lets see how it works out.
Looking at the monthly and weekly MACD they have an upward trend, what might help to overcome the 93B critical Market cap.
Hope this information is useful.
Good luck!