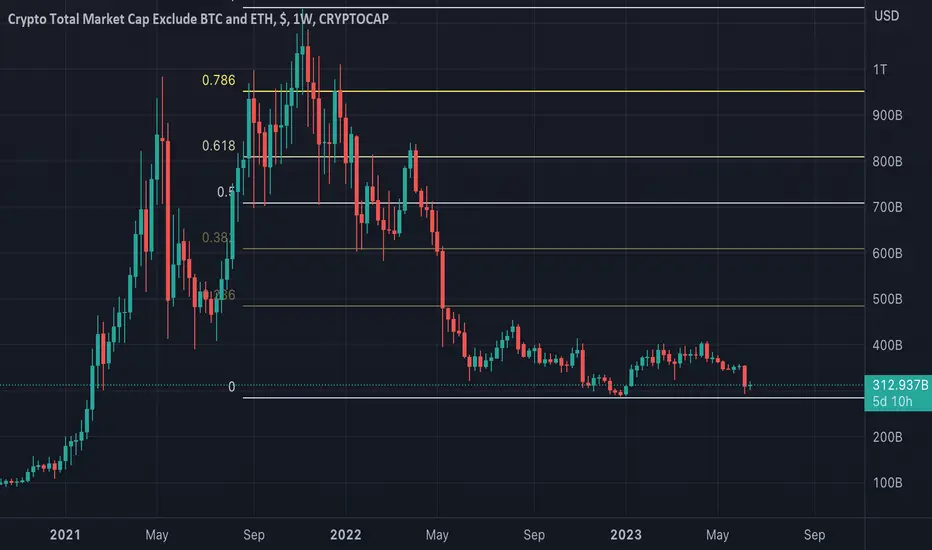
Altcoin Marketcap hitting SupportThis chart shows the total Crypto Market Cap excluding BTC and ETH which at time of writing represent approximately 70% of the market capitalization (look at Dominance for BTC 49% and ETH 20%).
The chart indicates a bounce at the levels where we bounced in January 2023.
We can surely drop lower, BTC dominance and ETH dominance may possibly breakout more to the upside before an altseason. But i think that the risk/reward in this zone for buying alts is relatively low, especially when comparing certain alts to their BTC and ETH pairs.
Time to get the Alt Scoop out once this week and all the data is out. CPI was good at 4% we still await the following though:
Wednesday 14th June
- US PPI
- Fed's interest rate decision
- FOMC press conference
Thursday 15th June
- ECB European Central Bank interest rate decision
- US Retail Sales
- US Jobless Claims
Friday 16th
- BOJ Japan Central Bank interest rate decision
I want to see what the market reaction is going to be to all of the above before deploying more capital into altcoins
ALTS
Altcoins' Downturn & Bitcoin's Unmatched SupremacyLet's cut to the chase. As an advanced analyst, I see a cataclysmic drop in altcoins on the horizon (obviously). This isn't just a hunch; my trusted charts reveal a looming dive to super low levels. Even stable-coins like tether, which often a safe haven, are part of this story, affecting the Total2 index. Stable coins make up about 120 billion dollars (20% of Total2) as of June 13, 2023.
But don't worry! Bitcoin stands tall amidst this chaos. It's the clear leader, shining in technical prowess and visuals. Altcoins, in comparison, are garbage securities which just don't measure up.
As altcoins lose steam and get sued to zero, I see money moving back into Bitcoin, further solidifying its top spot. In short, brace for an altcoin shake-up, stay prepared, and always trust the charts. Especially mine. Not these SCAM ARTISTS who know ASBOLUTELY NOTHING about financial markets.
See my inverse - Bullish Bitcoin idea linked below...
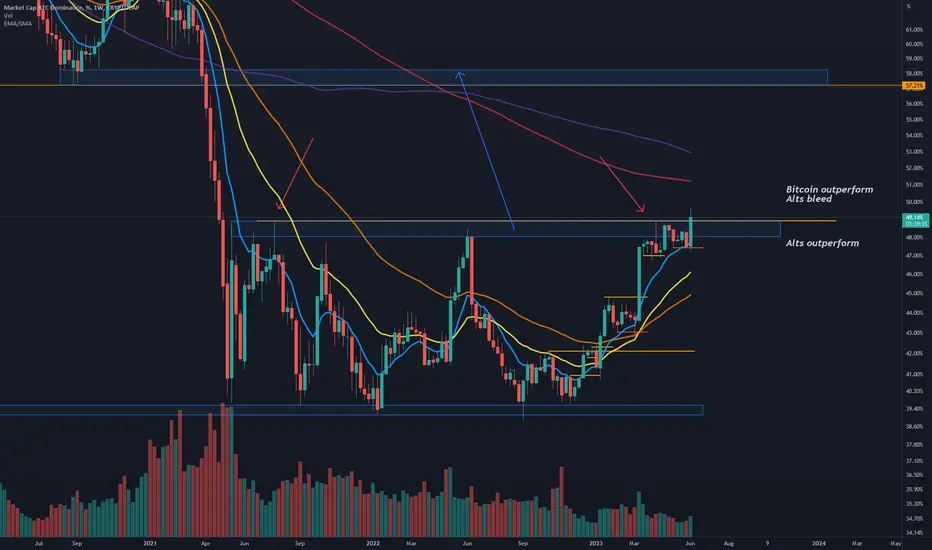
Bitcoin Dominance BTC.D. Bitcoin will outperform?Bitcoin Dominance trying to break a key level ~49%. If price stays on top of it, the rectangles target is around 58-60%.
Bitcoin will outperform most of the alts at that point, and alts bleed against BTC.
SEC has labeld some alts as securities so Bitcoin outperforming makes sense. For now.
I'm interested to see how this weekly candle closes. Does it close above 49%?
I also made an analysis from a micro-cap project which I think can 20-100x in few years.
Check it here
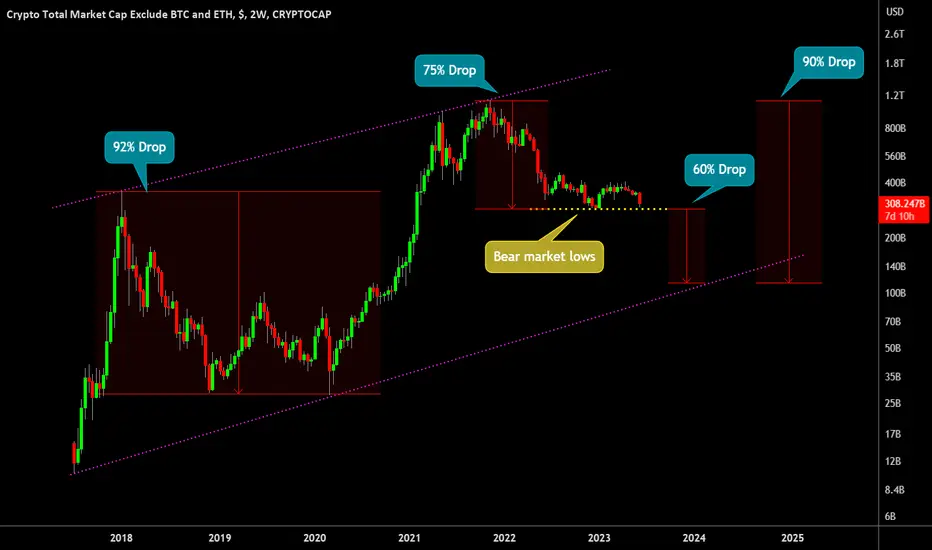
🔥 Altcoin Extermination: Worst Case Scenario ExplainedAfter Friday nights' massive drop, the total altcoin marketcap (TOTAL3) is hugging it's bear market lows of December 2022. Bitcoin is still holding up, but alts have been losing exponentially against Bitcoin, with no immediate end in sight.
In this analysis I'd like to explore my personal worst case scenario for the altcoin market. Where the alts dropped (on average) over 92% last bear market, they've 'only' dropped 75% thus far., see yellow dotted line This makes one believe that the bears still have more to ground to gain in the near future.
In my view, the worst case scenario would bring the altcoin marketcap all the way towards the lower dotted purple support. This would mean that the average altcoin will drop another 60% from it's current levels. One might think this is far-fetched, but I believe that this scenario is plausible if BTC will start dropping more.
However, we're not there yet. Some serious problems have to arise if we ever want to get at the worst case scenario. But, as we've seen last Friday, crazy things can happen randomly.
Do you think this is a possible scenario? What is your view on the altcoins? Share below 🙏
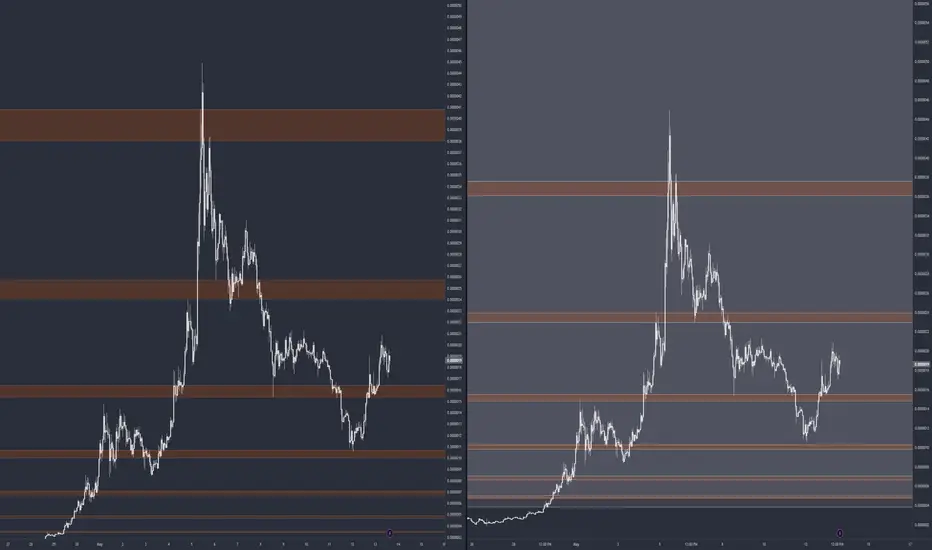
PEPE Market Maker LevelsPepe is a shitcoin run by market makers. This is for entertainment purposes only for Viewing a Brand New Market that the MM's control in totality.
The algorithms are heavy on this one.
FOLLOW FOR MORE
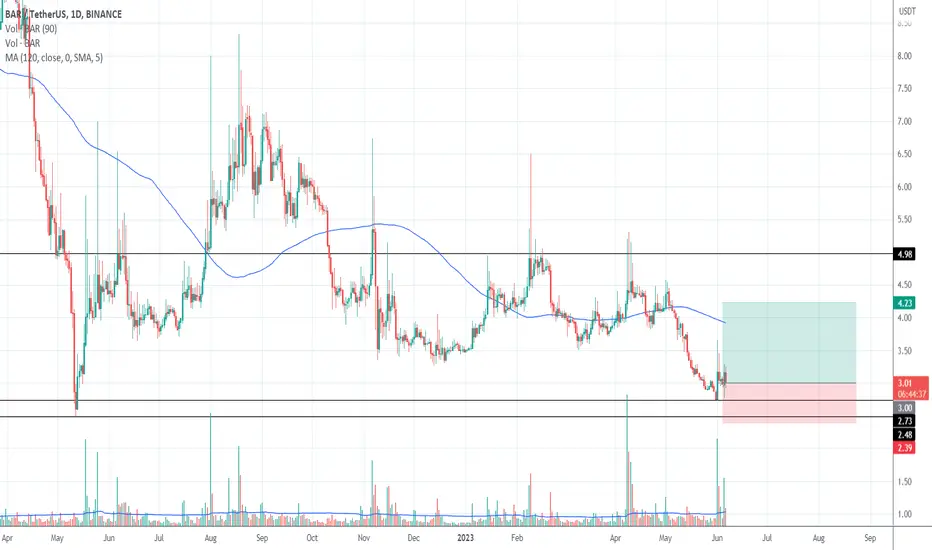
BAR buying from global support.Buying activity at the lower boundary of the range. Risk/return 1k2, investment horizon 8-12 weeks.
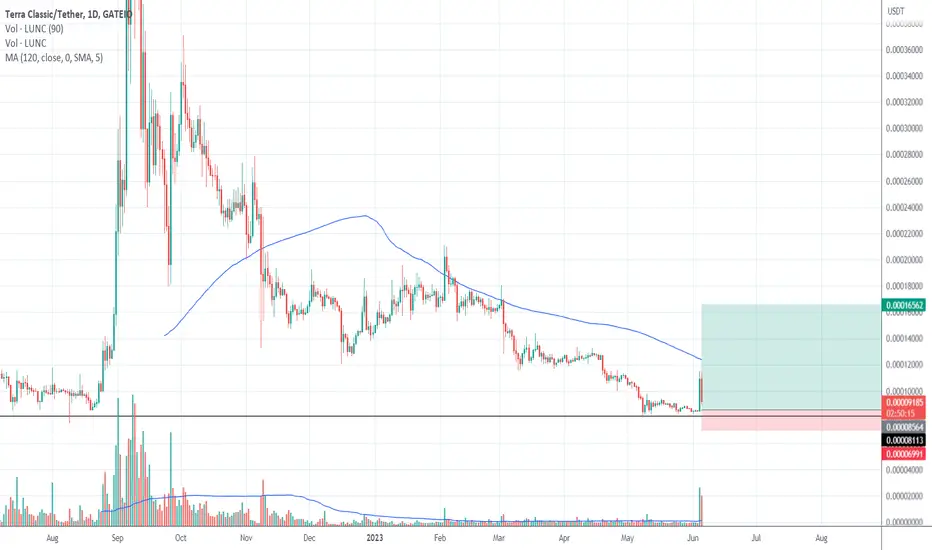
LUNC buying from global supportBuying activity at the lower boundary of the range. Risk/return 1k5, investment horizon 12-16 weeks.
POLIS buying from the bottom of the range.Risk income 1k3, investment horizon 8-12 weeks, buyer activity from the bottom of the range.
One target of +70% at -23% risk

MDA purchase at the lower limit of the range.Buying activity at the lower boundary of the range. Risk/return 1k3, investment horizon 12-16 weeks.

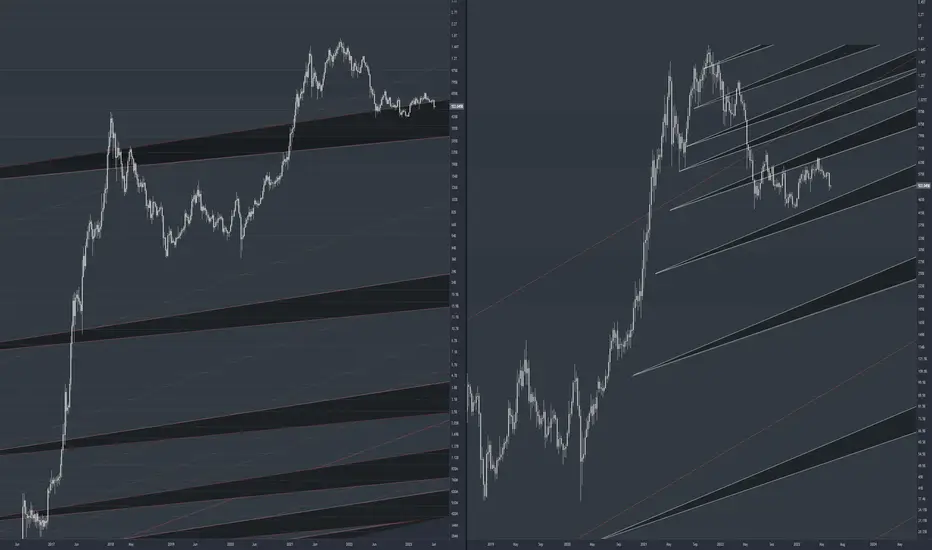
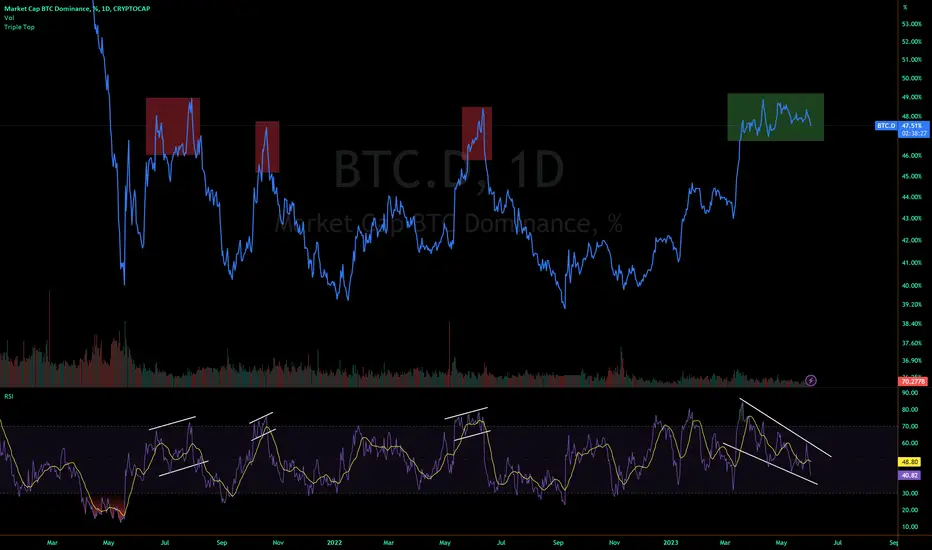
This Time is Not Like the OthersPrevious tops for Bitcoin Dominance in this range have behaved similarly, as has RSI. Each time we topped out, RSI moved higher and higher and then dropped hard. This time RSI has formed a falling wedge, and it looks indecisive.
It could be seen as a bearish divergence, as RSI moves down while price moves up or sideways. However, as RSI has already fallen significantly lower, it has room to spike upward along with price.
I think the likely scenario here, is a move up to 50-54% and then a strong move down. It could make a move down before doing so, but not back to the lower range.
WICC buying in implied spring zone.Risk income 1k6, investment horizon 12-24 weeks, it is possible that after accumulation we are in the spring zone.
Target of +120% at a risk of -20%

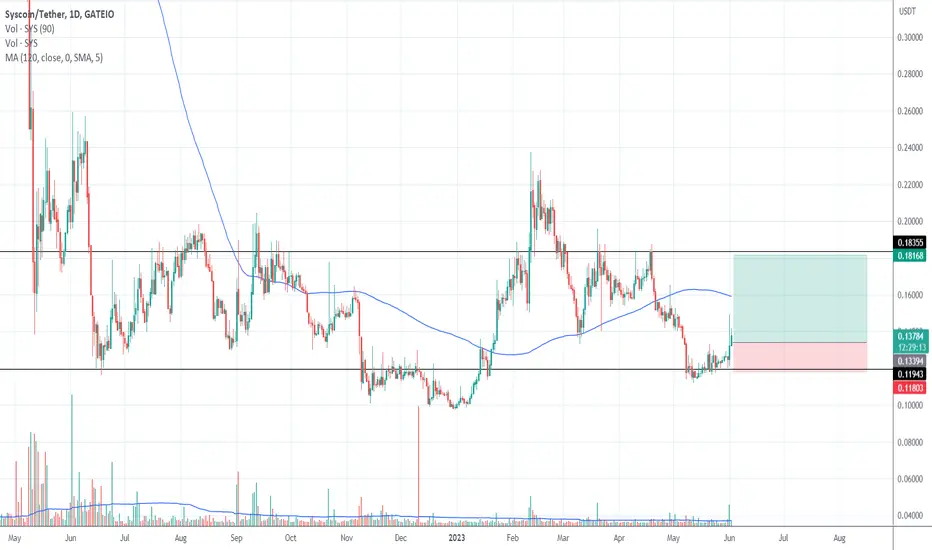
SYS short targets inside the range.Radar registers buyer activity at the lower boundary of the range. Risk/return 1k3
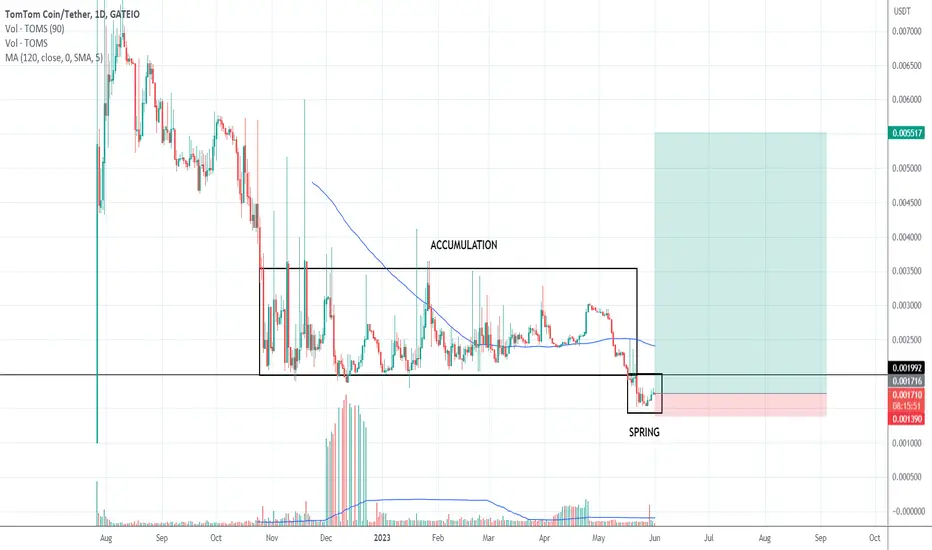
TOMS buying in implied spring zoneRisk income 1k11, investment horizon 12-24 weeks, it is possible that after accumulation we are in the spring zone.
Target of +220% at a risk of -20%
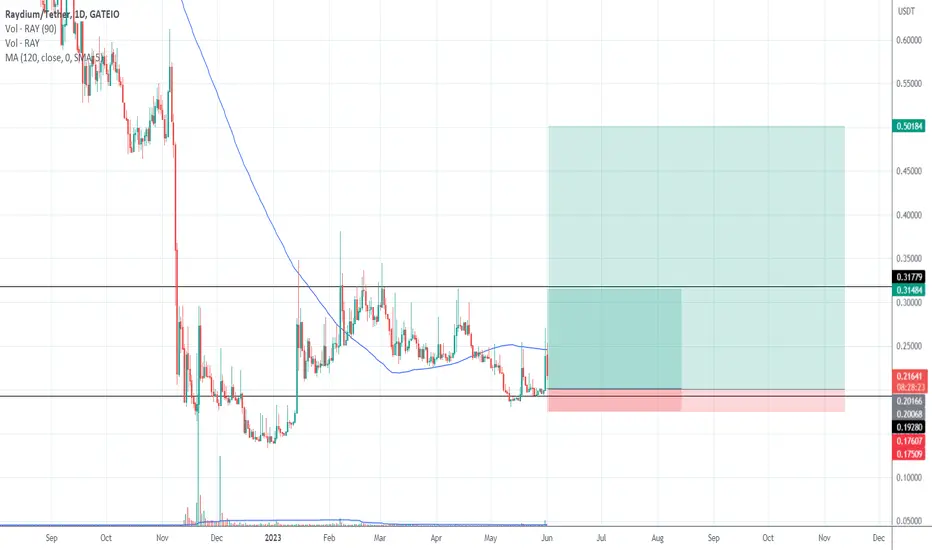
RAY buying from the bottom of the range.Risk income 1k7, investment horizon 12-18 weeks, buyer activity from the bottom of the range.
Two targets of +50% and +150% at -12% risk
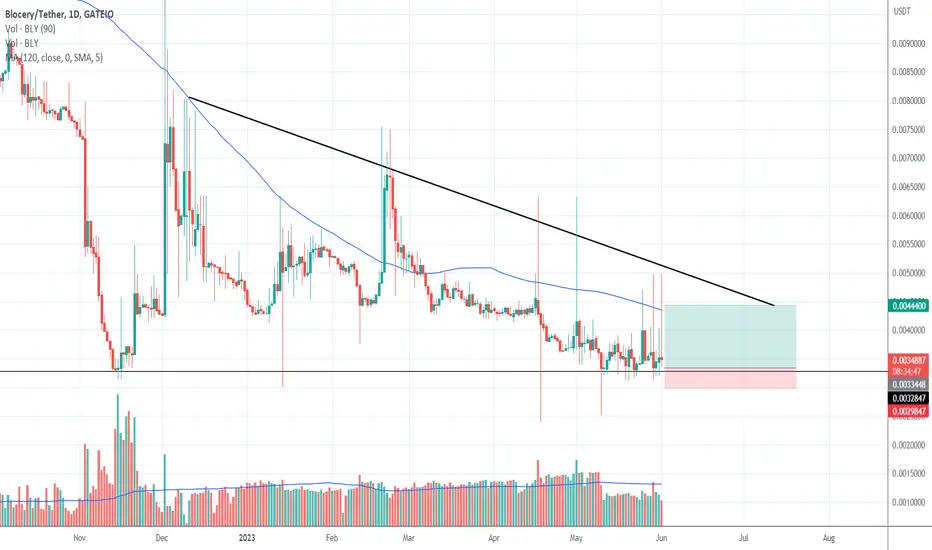
BLY buying from the bottom of the range.Risk income 1k3, investment horizon 4-6 weeks, buyer activity from the bottom of the range. Waiting for the next peak.
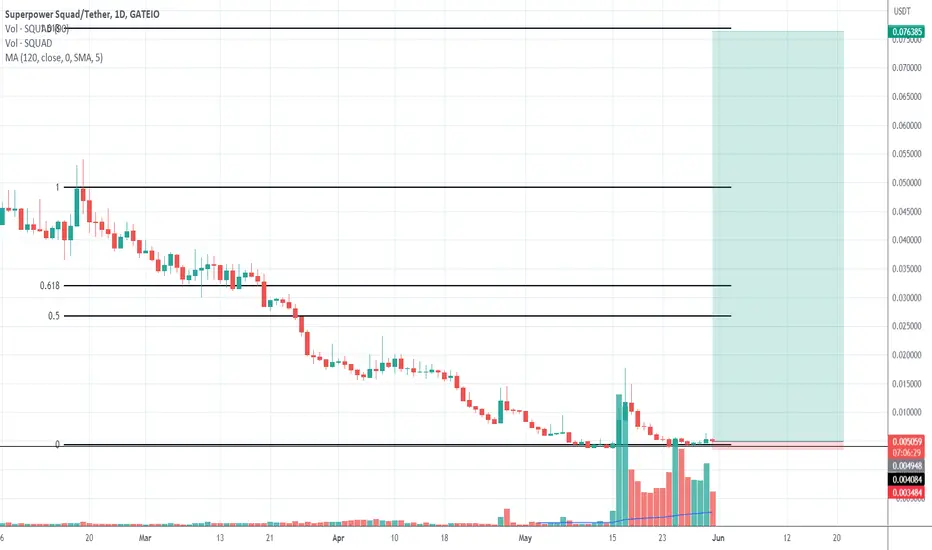
SQUAD incredible potential at x15A small-capitalized coin with a real game product could very well turn out to be a unicorn.
Risk 30%, we can get +1500%
Found at radar.trading