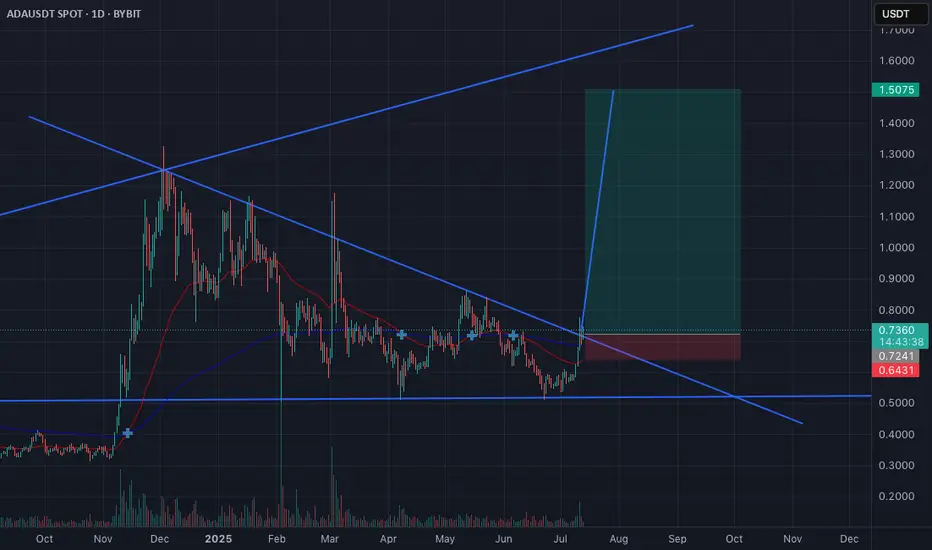
ADA LONG TRADE ADA has broken out of its long-term wedge pattern and looks poised for a move higher. With such a strong risk-to-reward setup, the trade makes sense even without a large position—especially important given the uncertainty around current tariff discussions.
Altseason
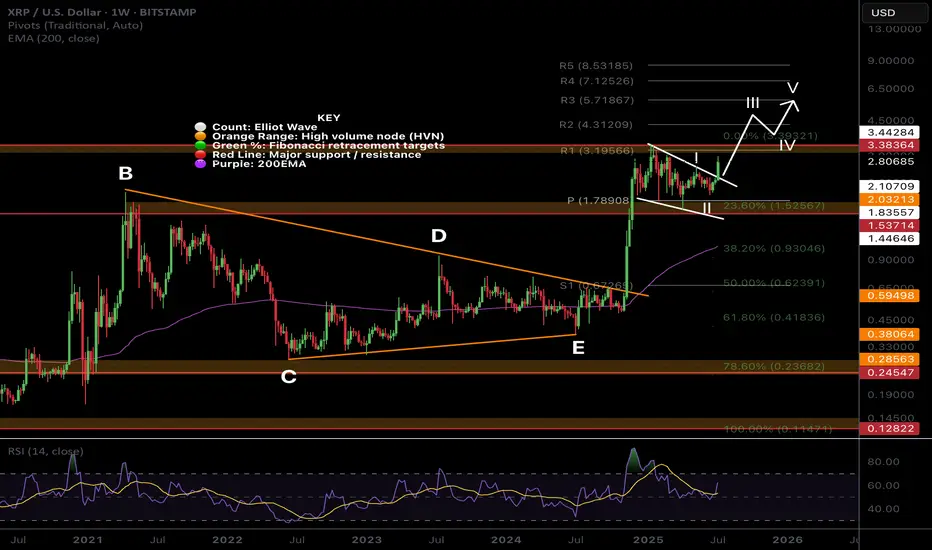
$XRP Macro Tiangle Final Thrust ContinuationCRYPTOCAP:XRP completed a macro triangle pattern last year. Triangles proceed a terminal motif wave which already completed a wave 3.
Wave (3) of (5) is underway with a terminal target around $5.7 after price broke out of the pennant / wedge pattern.
Weekly RSI confirmed bullish divergence.
Safe trading
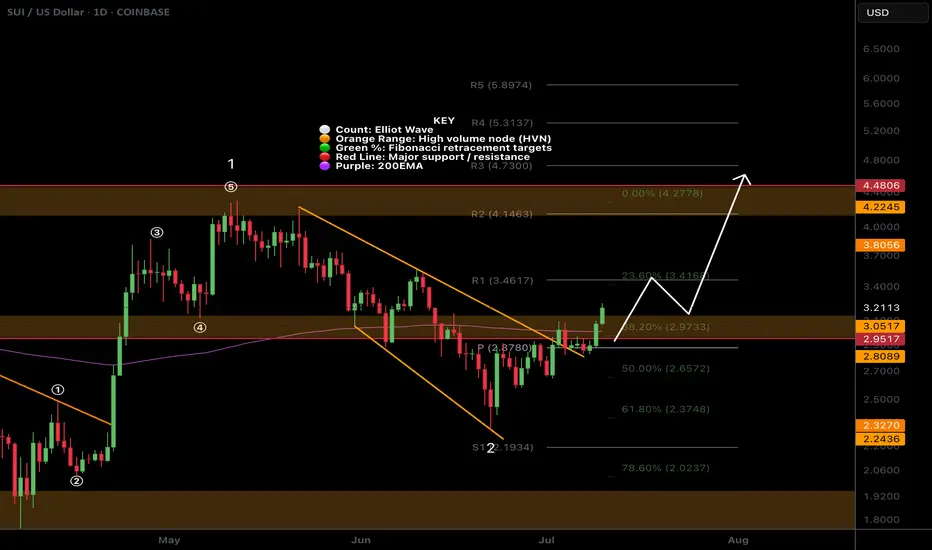
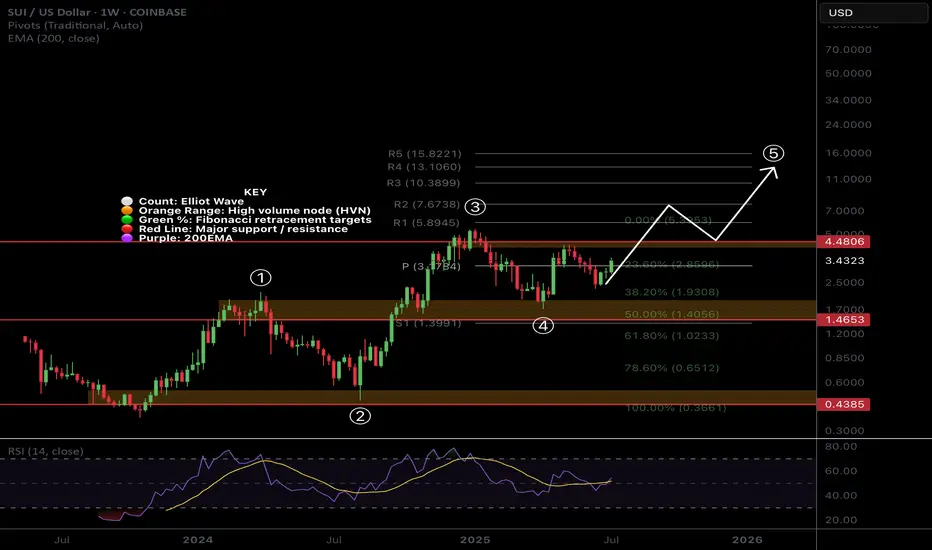
$SUI Wave 3 to Continue with a Strong Weekly CloseCRYPTOCAP:SUI printed a great weekly candle that will be closing today above the weekly pivot point with RSI trying to flip bullishly.
Price found support at 0.5 Fibonacci retracement and High Volume Node.
Wave 4 penetrated wave 1 which we potentially have a ending or leading diagonal Elliot Wave count limiting the potential upside with my current terminal target being around $10-13. Wave 4 could also actually be another wave 2 which would give us ridiculous targets but this is my preferred count for now.
Safe trading
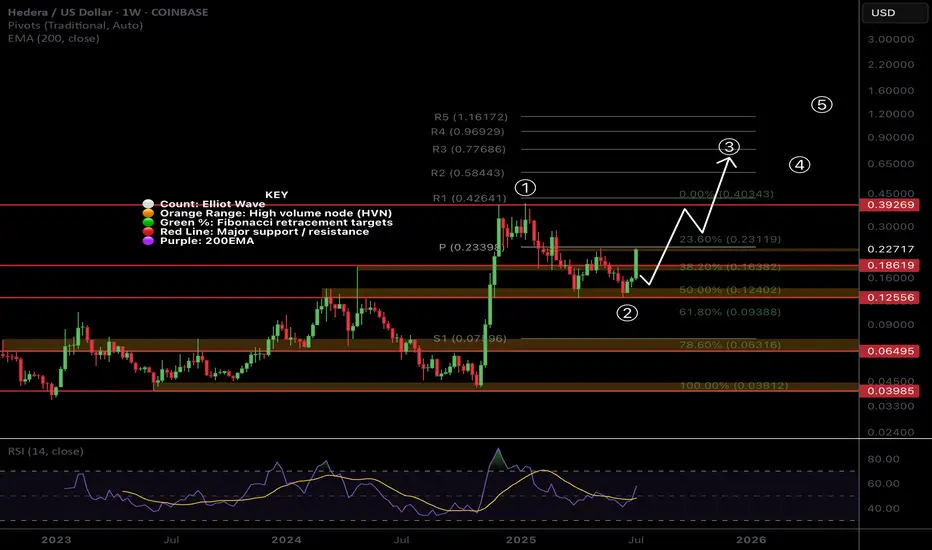
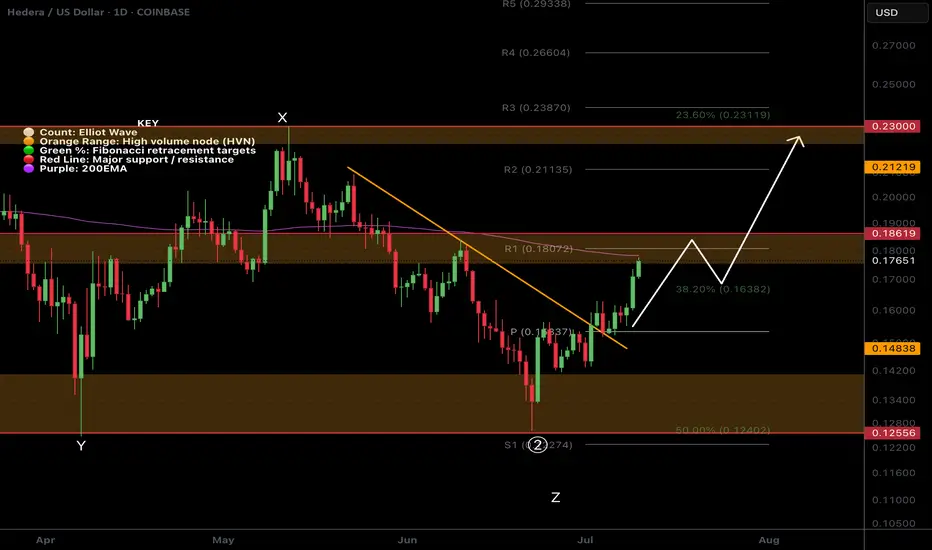
$HBAR Shooting Up in Wave 3CRYPTOCAP:HBAR is flying off the High Volume Node and 0.5 Fibonacci retracement with Elliot wave 3 characteristics keeping the count alive.
Price is testing the weekly pivot point which should act as resistance for the time being but a break straight through will demonstrate a very bullish trend. Traders should be cautious about entering here.
RSI confirmed a weekly bullish divergence
Safe Trading
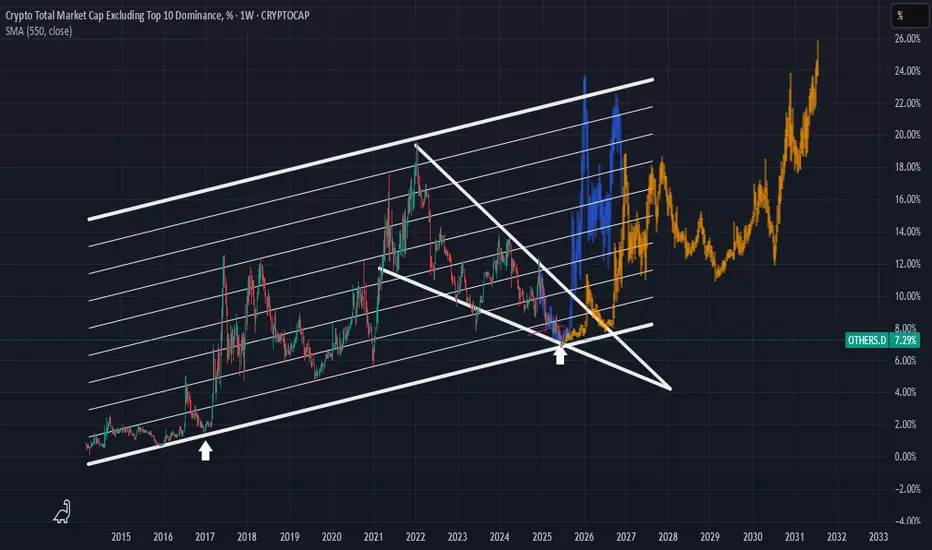
Very similar to January 2016You are looking at the Crypto Total Market Cap Excluding the Top 10 cryptocurrencies (OTHERS.D) on a weekly timeframe. This chart is often used as an "Altcoin Index" to gauge the strength of the broader cryptocurrency market beyond the major players like Bitcoin and Ethereum.
Here's my observation about being in a period similar to January 2016.
The technical analysis on this chart is built around a few key concepts:
1. Long-Term Ascending Channel: The dominant feature is a large parallel ascending channel that has contained the altcoin market cap's movements since 2015. The upper line has acted as a resistance level during bull market peaks, and the lower line has served as a major support level during bear market bottoms.
2. Historical Fractal (The "January 2016" Idea): My idea centers on a historical comparison, or a "fractal."
- The first white arrow points to a period in late 2016. At this time, the altcoin market cap found a bottom right on the support line of the ascending channel. This bottoming phase preceded the explosive 2017 bull run.
- The second white arrow points to a projected time in late 2025 / early 2026. The chart suggests that the market is currently in a similar bottoming pattern near the same long-term support line.
3. Falling Wedge: I've drawn a large falling wedge pattern starting from the peak in late 2021. This is typically a bullish reversal pattern, suggesting that the long downtrend could be nearing its end. The price is currently interacting with the apex of this wedge, a critical decision point.
4. Price Projection: The orange and blue bar patterns are copies of the price action that followed the 2016-2017 bottom. By pasting this fractal to the current time, the chart visualizes a potential future where history rhymes, leading to a massive new bull market for altcoins extending into 2027 until the end of the roaring 20s.
The Bullish Case (According to the Chart)
The argument presented by this analysis is clear:
• The altcoin market is at a historically strong support level (the bottom of the ~10-year channel).
• This is the same support level that kicked off the massive 2017 bull market.
• The market is consolidating within a falling wedge, which has a higher probability of breaking to the upside.
If this analysis holds true, the current period could be seen as a significant accumulation zone before the next major market expansion, much like the period around January 2016 was.
Important Considerations and Risks
While this is a compelling technical setup, it's crucial to maintain a balanced perspective. Here are some factors to consider:
• Past Performance is Not a Guarantee: This is the most important principle in financial markets. While historical patterns can provide valuable insight, they do not guarantee future results.
• Market Dynamics Have Changed: The cryptocurrency market of 2025 is fundamentally different from that of 2016.
• Maturity and Size: The market is significantly larger and includes substantial institutional investment, which can alter market behavior and volatility.
• Macroeconomic Factors: Global economic conditions, such as interest rates and inflation, now have a much stronger influence on the crypto market than they did in its earlier days.
• Regulatory Environment: Increased global regulatory scrutiny can introduce uncertainty and risks that were not present in the 2016-2017 cycle.
• Subjectivity of Technical Analysis: The trendlines and patterns are drawn based on an analyst's interpretation. Another analyst might draw them slightly differently, leading to a different conclusion.
Conclusion
The idea that "we're in January 2016 all over again" is a valid interpretation based on the technical patterns in this chart. The analysis points to the altcoin market being at a critical long-term support level, similar to the setup that preceded a major historical bull run.
This chart lays out a clear bullish roadmap. However, everyone should treat it as a potential scenario, not a certainty. I'll continue to monitor if the price respects these historical levels so that you guys are mindful of the broader market and macroeconomic factors that could influence the outcome.
Disclaimer: This analysis is for informational purposes only and is based on the technical analysis presented in the user-provided image. It should not be construed as financial advice. All investment decisions carry risk, and you should conduct your own research.
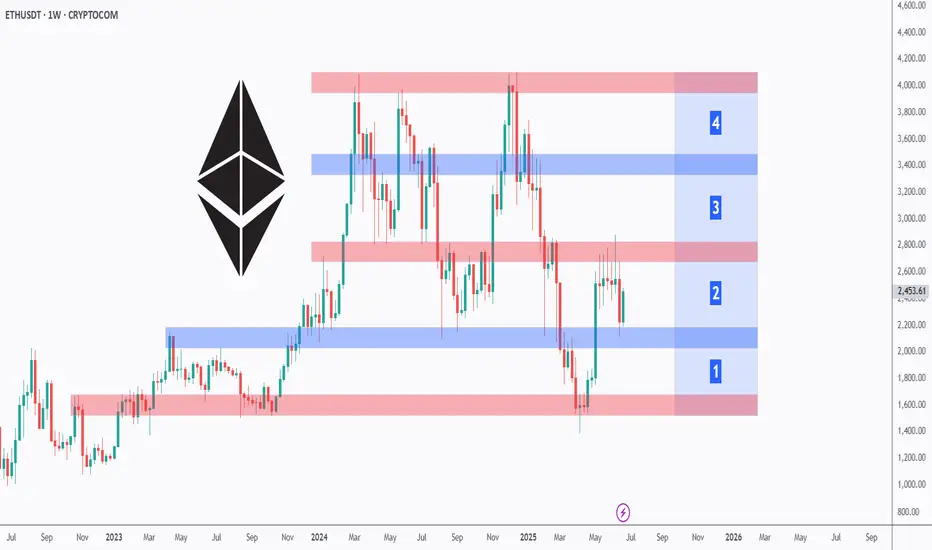
ETH Building Blocks - Keep it Simple🧱 Building Block - ETH Weekly Analysis 🧱
Ethereum has been trading within a well-defined structure, respecting key horizontal zones — each acting as a crucial building block in ETH’s macro journey.
🔹 Zone 1 ($1,700 - $2,100)
A strong demand and accumulation zone. ETH bounced from here multiple times, proving itself as the foundation of the current bullish attempt.
🔹 Zone 2 ($2,400 - $2,600)
We're currently hovering around this key mid-range resistance. A successful break above it would pave the way for the next major leg up.
🔹 Zone 3 ($2,900 - $3,400)
A major historical resistance turned supply area. ETH needs strong momentum and volume to break through this ceiling.
🔹 Zone 4 ($3,800 - $4,200)
The final building block before retesting ATH territory. A retest here could signal full bullish control in the coming months.
📍 As long as Zone 1 holds, ETH remains structurally bullish. Watch for breaks and rejections at each building block to gauge the next move.
Which block will ETH break next? 🔮
📚 Always follow your trading plan regarding entry, risk management, and trade management.
Good luck!
All Strategies Are Good; If Managed Properly!
~Rich
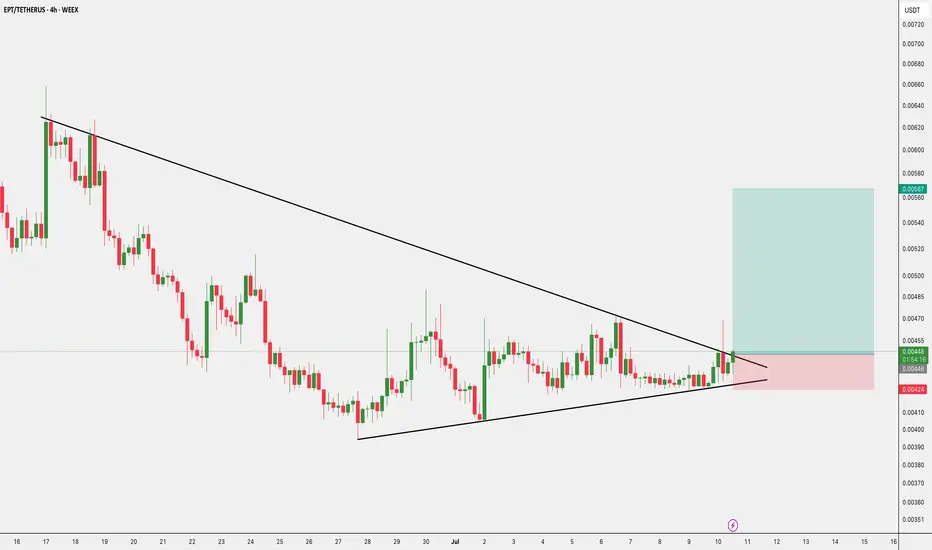
$EPT/USDT - Breakout Trade $EPT/USDT – Breakout Trade
- Entry: CMP
- SL: $0.00424
- Target: $0.00567, $0.00501
DYOR, NFA
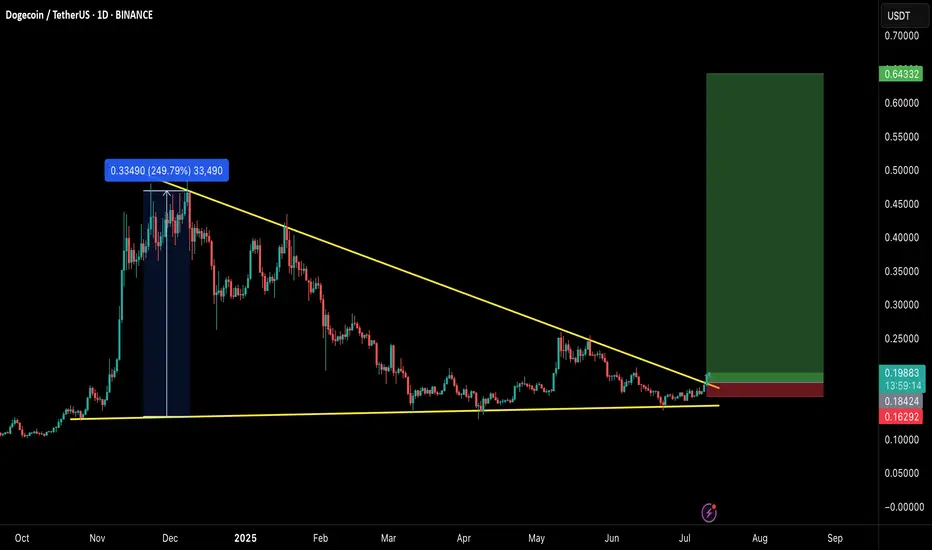
DOGE/USDT – Is Dogecoin About to Ignite Altseason Again?Hey Traders!
If you’re finding value in this analysis, smash that 👍 and hit Follow for high-accuracy trade setups that actually deliver!
Dogecoin just broke out of a multi-month descending wedge — and history tells us to pay close attention when this meme king wakes up. Let’s dive into why this setup could be the start of something massive.
📈 Chart Pattern
DOGE has been consolidating for months inside a falling wedge — a classic bullish reversal structure. It’s now finally broken out with strong volume confirmation, holding above the 50 EMA and showing signs of momentum building up.
🔍 Historical Clue
Remember what happened in the previous bull markets?
✅ 2021: DOGE exploded 2000%+ and triggered the craziest altseason ever.
✅ 2017: DOGE moved first, followed by hundreds of altcoins rallying massively.
Now, in 2025 — it looks eerily similar. Every time DOGE wakes up, it signals that retail and meme sentiment is heating up, a classic altseason ignition.
🎯 Trade Setup
Entry: $0.198 (Already triggered)
Targets:
TP1: $0.28
TP2: $0.42
TP3: $0.64
Stoploss: $0.162
Risk-Reward: Massive upside potential, with clearly defined invalidation.
💡 Final Thoughts
Altcoins are starting to follow. ETH has broken out. XRP is running. BTC dominance has rejected trendline resistance. Everything is aligning. If history repeats, this breakout in DOGE could mark the official start of Altseason 2025.
👉 Don’t sleep on DOGE. This might just be the trigger we’ve been waiting for.
📌 Follow for more setups & insights. Stay tuned!
#AltSeason #Coming #Crypto #Pump #Soon#AltSeason #Coming #Crypto #Pump #Soon
According to the Bitcoin chart and Bitcoin dominance, as well as the Tether index and the position of altcoins, a new altcoin season is expected to begin.
Depending on your style and strategy, you can purchase altcoins in steps for your spot basket. The best time to buy a new step is now.
We will soon see 100% growth in altcoins ranked 1 to 10 in coin market cap, and altcoins in the following ranks can also pump 300%, 500%, and 800% and experience attractive growth.
Based on your strategy and style, get the necessary confirmations for this analysis to enter the trade.
Don't forget about risk and capital management.
The responsibility for the transaction is yours and I have no responsibility for your failure to comply with your risk and capital management.
💬 Note: Note that this analysis will only be fully confirmed if Bitcoin continues to grow and Bitcoin dominance continues to decline, in which case altcoins will start their main growth and get pumped. Otherwise, the previous scenario could repeat itself, with a correction to remove liquidity, liquidate long positions, and throw out traders, and the main rise will begin. Anyway, the new altcoin season is coming and will begin soon. Hunt down the crypto market pump by obtaining the necessary approvals.
If you are not an analyst and are not familiar with step buying, ignore this analysis.
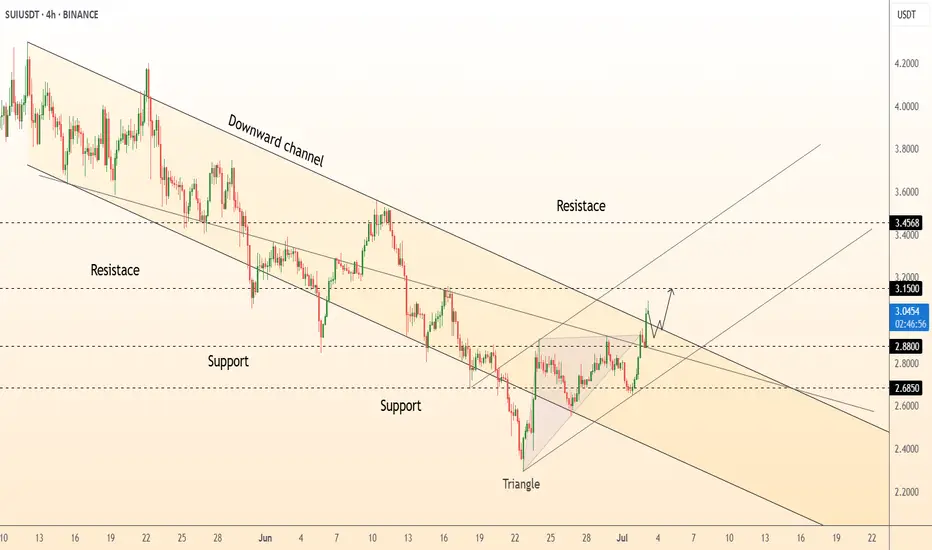
DeGRAM | SUIUSD got out of the channel📊 Technical Analysis
● Price pierced the four-week falling-channel roof and the apex of a contracting triangle, turning 2.88 support into a launchpad and carving a sequence of higher lows.
● Breakout measured move and channel mid-band converge at 3.15; a close above there exposes the next horizontal barrier and channel top at 3.46. Risk is framed by the former triangle base at 2.88 and major swing floor 2.69.
💡 Fundamental Analysis
● Sui’s on-chain TVL has climbed >15 % since 25 Jun after zkLogin main-net rollout and Mysten Labs’ new developer grants, underpinning demand despite broad market lethargy.
✨ Summary
Long 2.90-3.05; hold above 3.15 targets 3.46. Invalidate on a 4 h close below 2.88.
-------------------
Share your opinion in the comments and support the idea with a like. Thanks for your support!
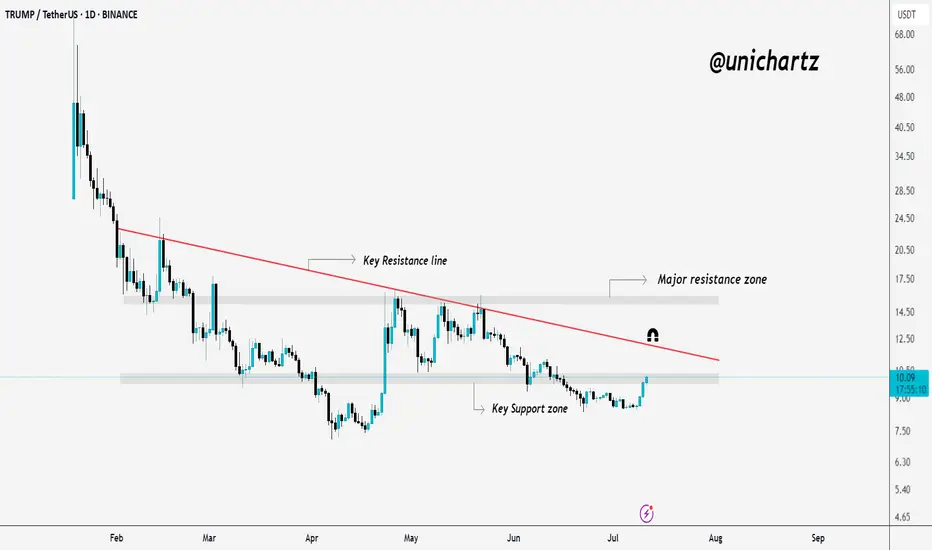
TRUMP/USDT Eyeing a Breakout – Key Levels Ahead!Trump is currently trading just below the resistance zone.
If we see a daily candle close above this key area, it could trigger a move toward the red trendline, and possibly even into the major resistance zone above.
Eyes on the breakout!
DYOR, NFA
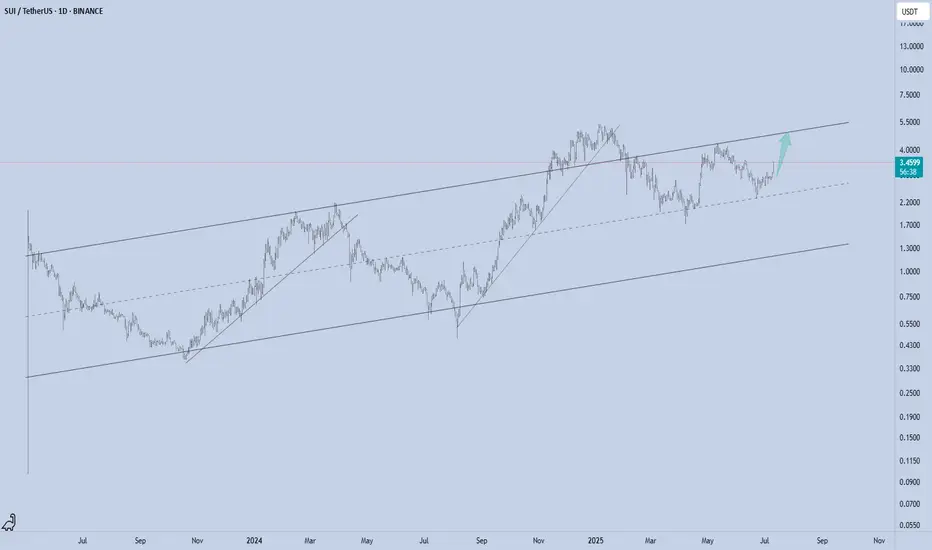
SUI - Channel Structure
SUI just printed a powerful +12.95% daily move, bouncing cleanly from the mid-range of its long-term ascending channel. This structure has been respected since mid-2023, guiding both impulse legs and corrective phases with precision.
Now trading around $3.47, the next logical magnet is the channel top near $5, especially if momentum persists and market sentiment remains risk-on.
Technical Structure:
Bullish trend within a well-defined ascending channel
Clean reaction from dynamic support (midline)
Clear higher low + breakout structure in play
Upside Target:
$5 (channel resistance)
As long as SUI holds above the rising midline (~$2.80 area), this setup remains valid for trend continuation toward the upper range.
📌 Risk Management:
Break below the midline flips the bias short-term. Until then, trend = friend.
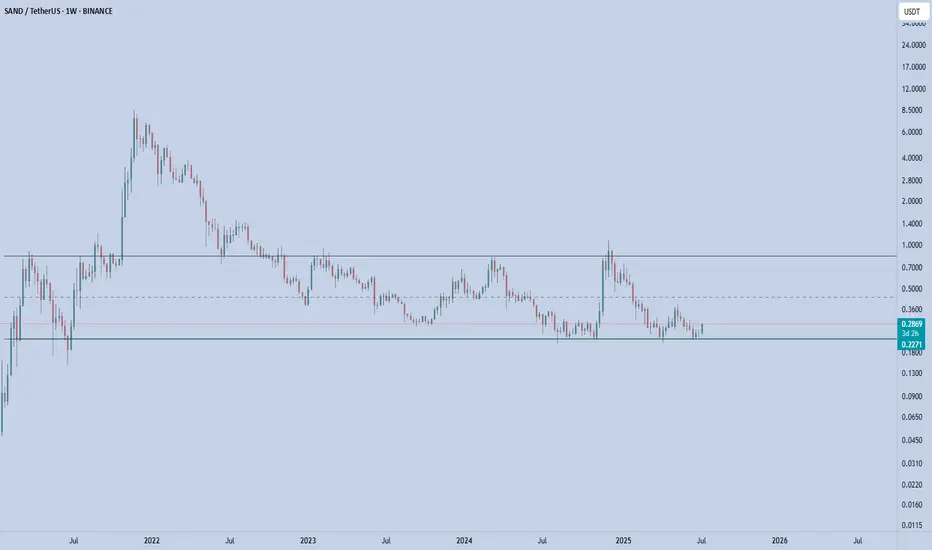
SAND – Rotation in PlaySAND is showing early signs of strength off the long-term demand zone near $0.23–0.24, where it's been accumulating for several months. Price just printed a strong weekly bounce, up +16%, reclaiming the bottom of the range.
This area has acted as a key base since mid-2023 — with each touch producing a notable reaction. Now trading at $0.286, SAND is attempting to rotate toward the top of the established range.
Key Levels
Support (Range Low): $0.23–0.24 (strong demand zone)
Resistance (Mid-Range): $0.43
Range High: $0.85
A clean flip of the mid-range ($0.43) could open the door to test $0.70+.
📌 Risk management: A break and weekly close below $0.23 invalidates this setup. As long as it holds, the upside potential is attractive from a risk/reward standpoint.
This is a classic accumulation > reclaim > expansion structure. Let the chart speak if the range holds, the rotation is in play.
Altcoins Rise Again – Off to 1.07T and 1.51T?🌊🚀 Total Market Cap (excluding BTC & ETH) is showing strength again, pushing off support and heading back into the heart of the channel.
💥 The bullish structure has been respected beautifully:
✅ Double bottom near channel base
✅ Clean bounce and new higher low
✅ Momentum building on macro trend
📈 As long as this channel holds, we're eyeing the next targets:
🔹 Mid-channel target: $1.07 Trillion
🔹 Channel top extension: $1.51 Trillion
From the "Escape" back in late 2023 to the clean retest — it’s now about confirmation and continuation.
This could be the altseason move everyone forgot about...
🛑 Long bias stays intact as long as the bottom channel support is respected.
Time to respect structure over noise.
One Love,
The FXPROFESSOR 💙
Disclosure: I am happy to be part of the Trade Nation's Influencer program and receive a monthly fee for using their TradingView charts in my analysis. Awesome broker, where the trader really comes first! 🌟🤝📈

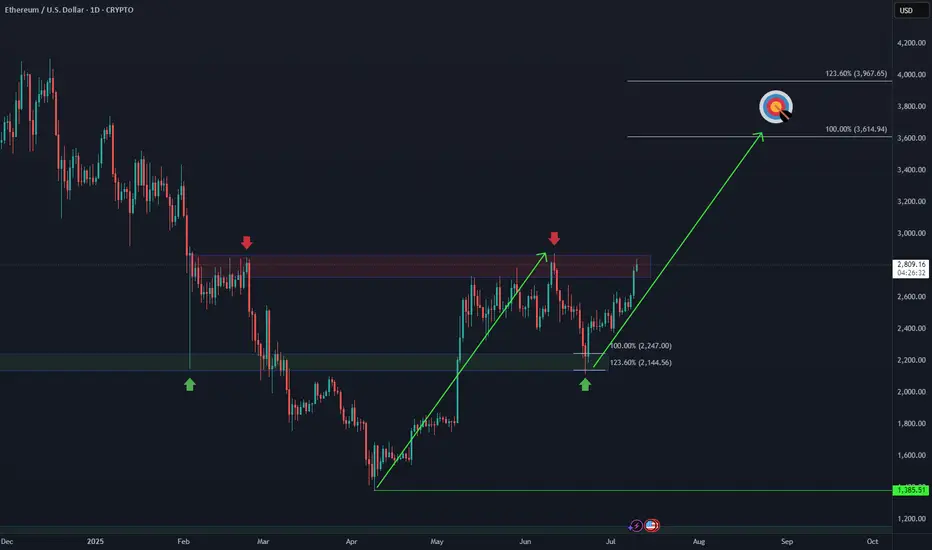
Ethereum Breakout Is Imminent!🚀 CRYPTO:ETHUSD is approaching the June peak, and a breakout would confirm a bullish sequence in play.
Upside targets are set at $3,600 – $3,960, aligning with key Fibonacci levels and challenging the 2024 highs.
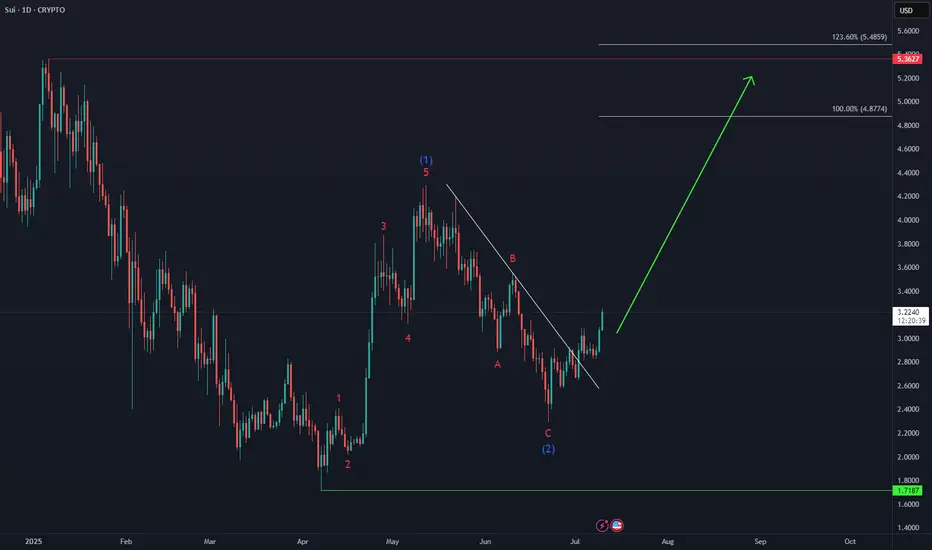
SUI Next Upside Target🚀 After holding above the April low and completing a 3-wave pullback in wave (2), CRYPTO:SUIUSD is now advancing in a potential wave (3).
Momentum is building, and the next upside target lies in the equal legs zone at $4.80 – $5.40, which could eventually lead to a new all-time high.
HolderStat┆ETHUSD retest of the resistance lineBINANCE:ETHUSDT has exited a falling wedge and is forming a bullish continuation pattern. With price action building above $2,500, a breakout toward $2,800 is in play, targeting the supply zone around $3,000. Structure favors bulls.

ETHEREUM BREAKOUT CONFIRMED!Hey Traders!
If you’re finding value in this analysis, smash that 👍 and hit Follow for high-accuracy trade setups that actually deliver!
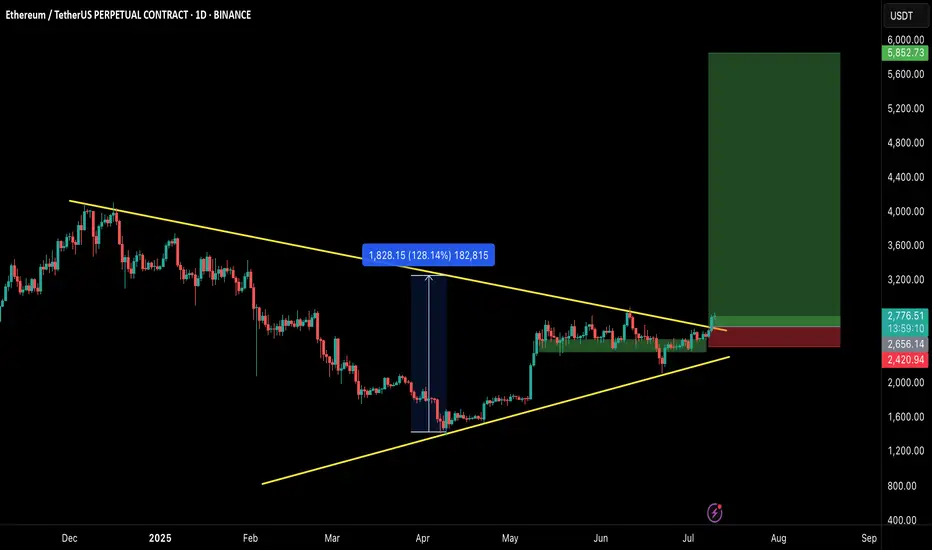
After months of consolidation inside this massive symmetrical triangle, ETH finally breaks out on the daily chart—and this could be the spark for the next major rally! 🔥
📈 Structure: Symmetrical Triangle
✅ Breakout Confirmed
📍 CMP: ~$2,760
🎯 Next Major Target: $5,000+
This is the breakout bulls have been waiting for! If momentum sustains, ETH could enter price discovery territory soon. Buckle up—the real move might just be beginning. 🚀
Let’s see how far it runs from here!
Drop your targets in the comments 👇
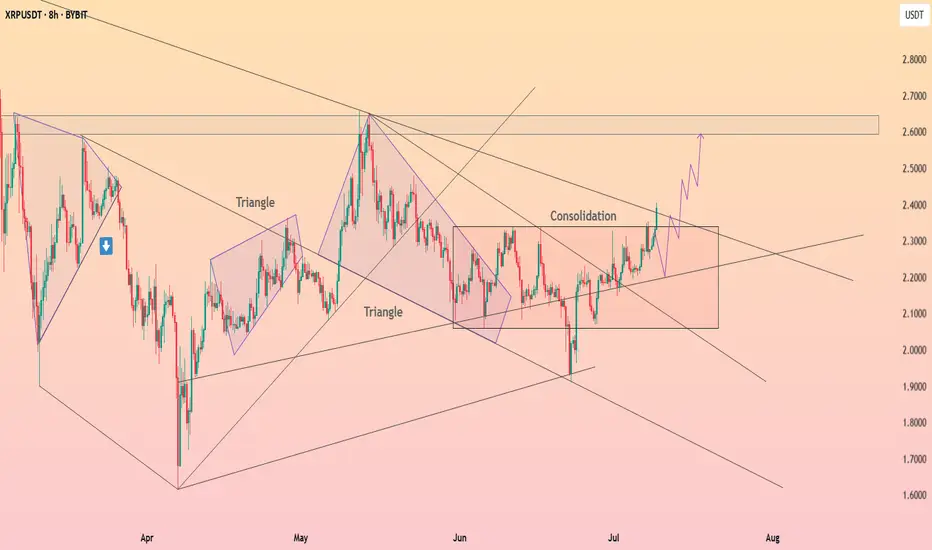
HolderStat┆XRPUSD got out of the consolidation areaBYBIT:XRPUSDT is building strength within a wide consolidation range after multiple triangle breakouts. Price is eyeing the 2.60 level, and structure suggests bulls are preparing for the next push.
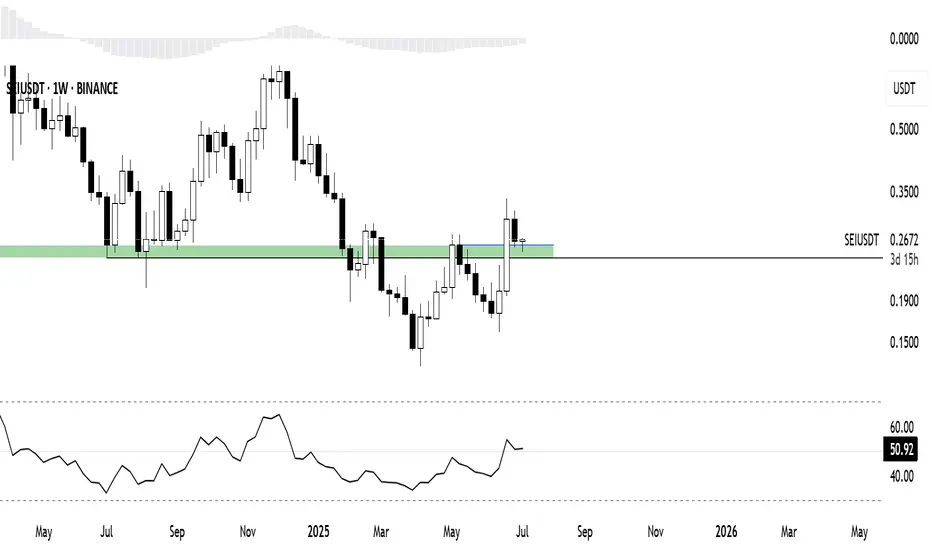
Recently Circle launched native USDC & CCTP on $SEIThis enables fast, low-cost stablecoin transfers on the efficient L1 blockchain, boosting liquidity and institutional adoption
This news made me curious about the chart
The price itself is reclaiming and holding a critical HTF level while breaking the bearish structure
The RSI above the 50 level is signaling a regaining of the bullish momentum
Perfect alignment to grab some for the longterm portfolio
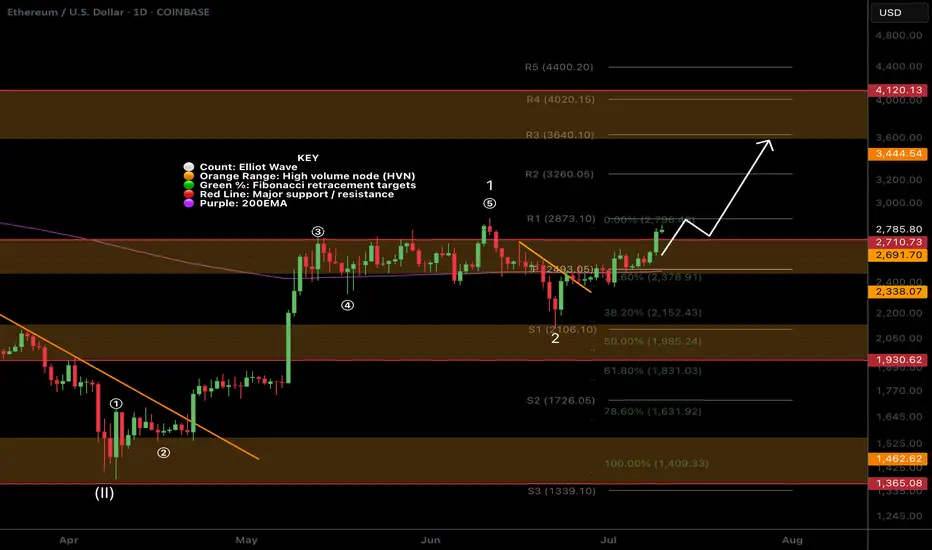
$ETH clear for an impulsive move to $3600?CRYPTOCAP:ETH has slowly but surely cleared resistance, with just the swing high to tackle which will activate another trade signal in my Trade Signals Substack.
Major support High Volume Node, daily pivot and daily 200 EMA proved tough support and demand continues to come in.
ETFs had an astonishing amount of inflows yesterday at $200M+
Analysis is invalidated below $2100
Safe trading
$HBAR Resistance at daily 200EMA!CRYPTOCAP:HBAR analysis continues to play out but should consolidate for a while before moving to the next target at $0.22.
This area should be tough resistance as its the daily 200EMA and major High Volume Node resistance and R1 daily pivot.
The CRYPTOCAP:HBAR signal has now hit take profit #1 from my Trade Signals Substack posted last week.
Safe trading
$SUI Big Breakout Happening?CRYPTOCAP:SUI is smashing above triple resistance: a major High Volume Node , daily 200EMA and the daily pivot. The signal I posted in my trading signals Substack is now live, and the HBAR one is about to hit take profit 1.
Target for this rally remains $4.2 High Volume Node near the swing high.
Analysis is invalidated below the daily pivot at $2.8
Safe trading