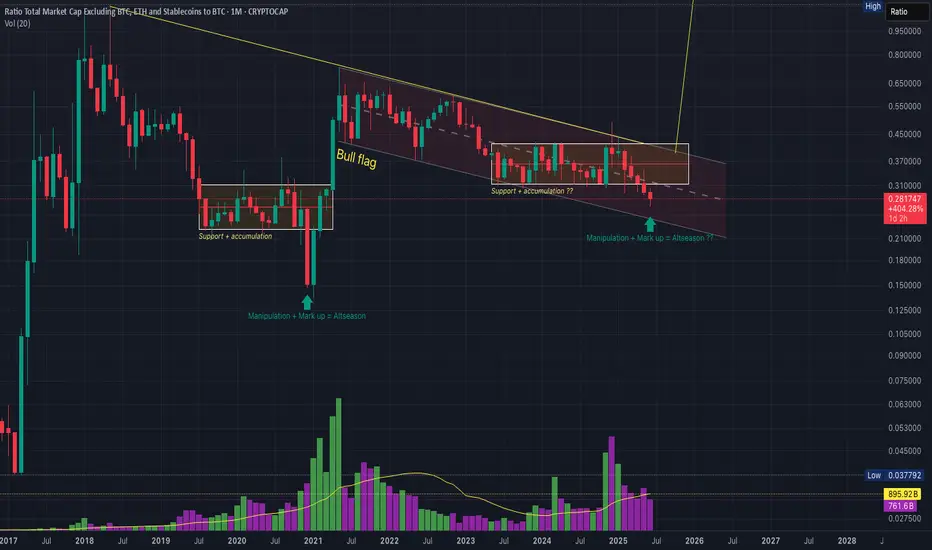
Altseason, just a thought ! Basically, right now we’re chilling in a major confluence zone — a whole bunch of important levels are stacked right here.
We’ve got:
The 0.78 Fib retracement holding it down
Volume profile support giving us a comfy cushion
That good old accumulation support from 2019–2021 saying “welcome back”
…just to name a few.
IMO, we’re in that sneaky “deviation/manipulation” phase before the real markup begins — a.k.a. altseason is warming up in the locker room.
If we actually hit the bull flag target… well, let’s just say the numbers start looking spicy. But hey, let’s not get ahead of ourselves — things can (and probably will) move faster than you think.
Alright, that’s the vibe. Let’s see how it plays out. Good night! 😴🚀
Altseason
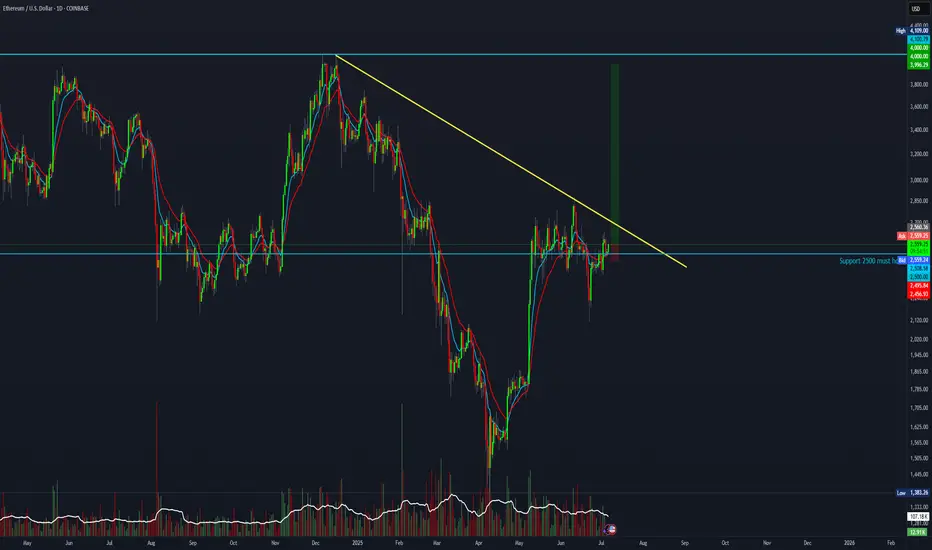
ETH Gearing Up for Lift-Off — Eyes on $4,000+ETH Weekly Outlook
ETH is currently trading around $2,660 on the weekly timeframe and holding up well at these levels.
If the momentum continues, the upper resistance zone near $3,550 could act like a magnet — pulling price higher. A breakout above this zone may trigger a strong rally toward $4,000+.
And when ETH starts to move big… altcoins usually follow.
Keep an eye on it. The next few weeks could get interesting.
DYOR, NFA

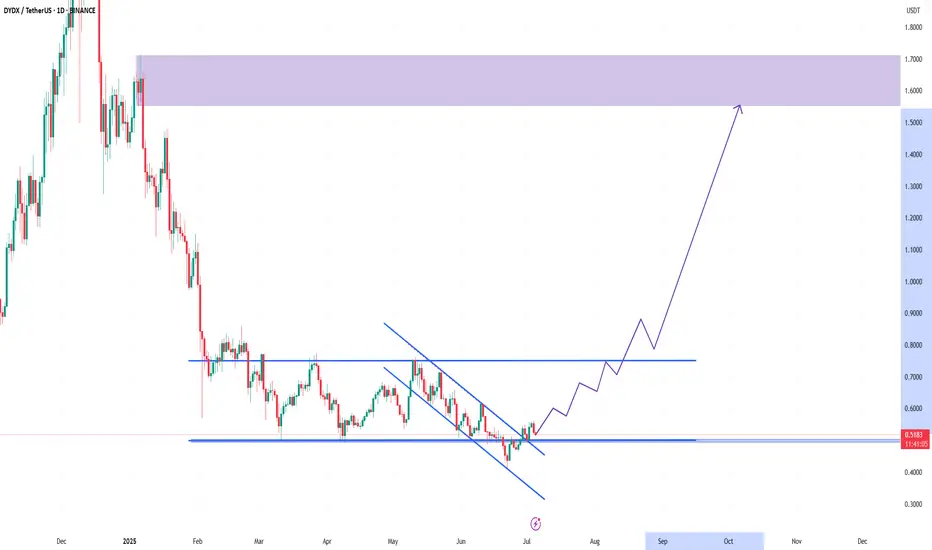
DYDX Breakout from Falling Wedge | Targeting $1.60+# DYDX Breakout from Falling Wedge | Targeting $1.60+
📈 **DYDX/USDT Analysis – Daily Timeframe**
DYDX has just broken out of a falling wedge pattern – a classic bullish reversal formation – after holding a strong support zone around **$0.50**. This zone has acted as a reliable demand area for several months.
---
🔍 **Technical Highlights:**
- ✅ Falling wedge breakout confirmed with daily candle close above resistance
- 🟢 Strong support at $0.50–$0.52
- ⚠️ Horizontal resistance at $0.75 may act as a short-term barrier
- 🚀 Potential rally toward major resistance at **$1.60–$1.70** (target zone)
---
🎯 **Profit Targets:**
- First Target: **$0.75**
- Final Target: **$1.60 – $1.70**
❌ **Invalidation (Stop-loss idea):**
- If price breaks below $0.48 with volume, the bullish scenario may be invalidated.
---
📊 This setup is based on breakout structure and potential trend reversal. If volume confirms, this could be the beginning of a new mid-term uptrend.
💬 Let me know what you think about this setup! Would love to hear your feedback.
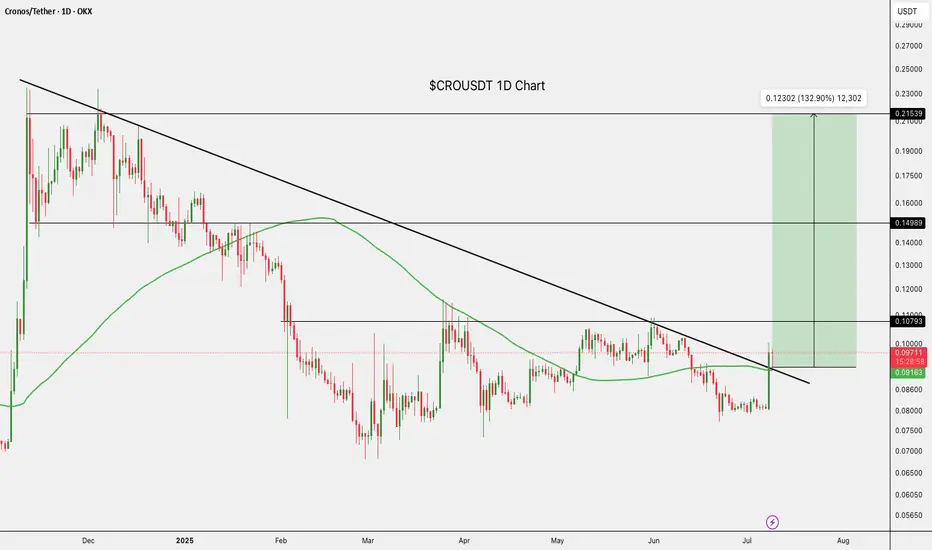
$CROUSDT Just Broke Out, Is a 130% Pump Coming?GETTEX:CRO has broken out above a long-term descending trendline and reclaimed the 100-day moving average, a bullish signal.
If it holds above this zone, the next targets are $0.1079, $0.1498, and potentially $0.2155, offering up to 132% upside.
Watch for a successful retest to confirm momentum.
DYOR, NFA
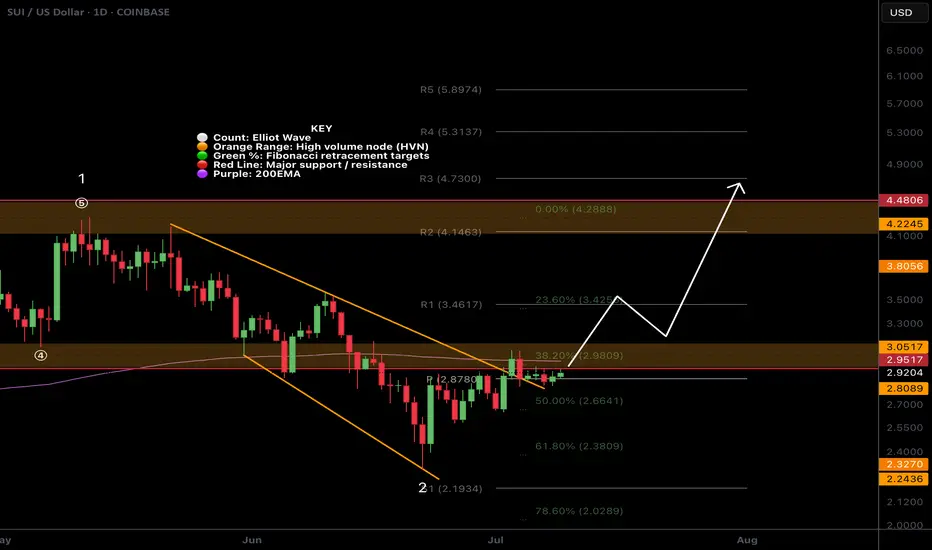
$SUI Gearing Up to Break Triple Resistance?CRYPTOCAP:SUI is consolidating under resistance which often leads to a breakthrough but can take some time.
Price is sat above the daily pivot after breaking the downward trend resistance, but still under the daily 200 EMA and High Volume Node resistance. A pop above $3.09 swing high would be a bullish signal to long towards a first target of $4.2 High Volume Node.
Analysis is invalidated with a move below $2.7, leaving heavy resistance still ahead.
Safe trading
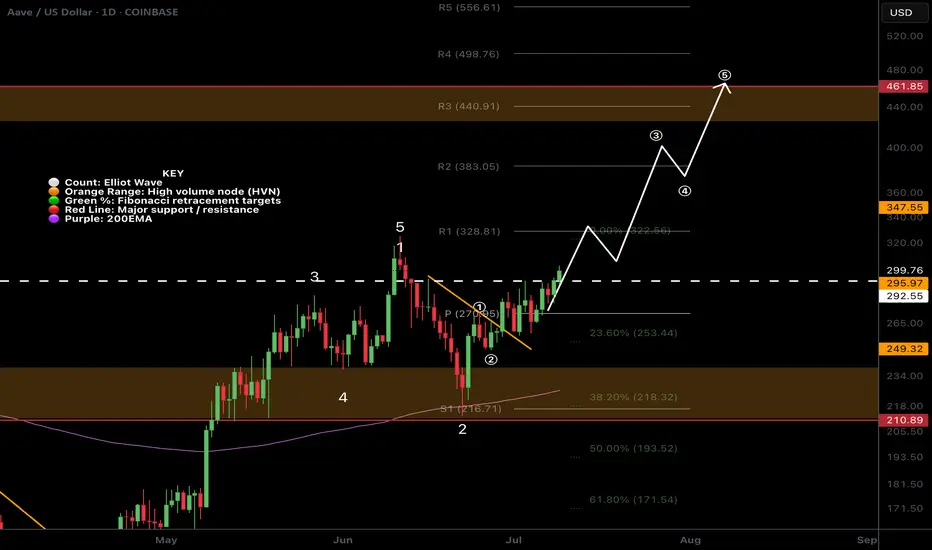
$AAVE Ready to Pop?EURONEXT:AAVE long signal is now active.
Price is still well above the daily pivot and daily 200EMA showing a strong local trend.
I am still expecting a decent move to test the all time high, High Volume Node at $460.
Safe trading
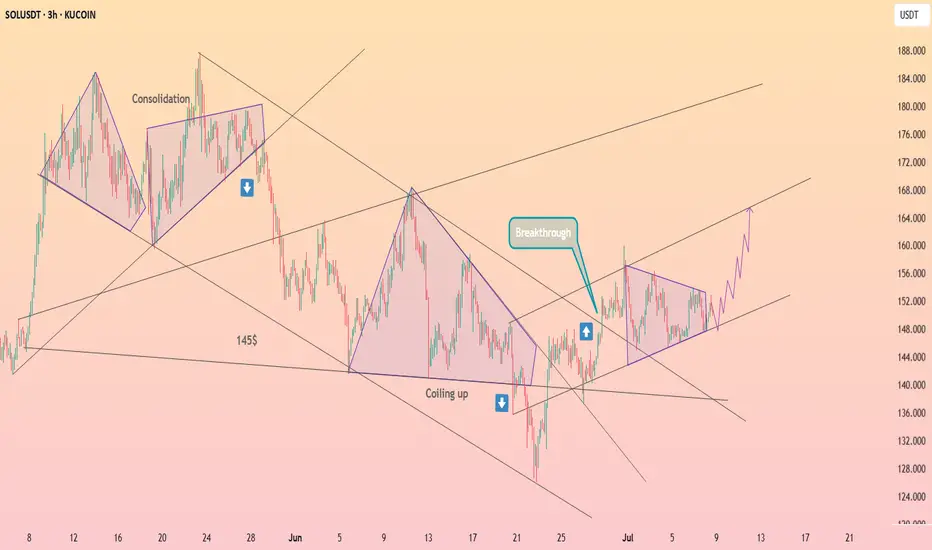
HolderStat┆SOLUSD seeks to the resistance lineBINANCE:SOLUSDT has broken out of a descending wedge and is coiling in a symmetrical triangle above 150. The setup supports a push toward 165–170, with momentum favoring bulls if the triangle resolves upward.
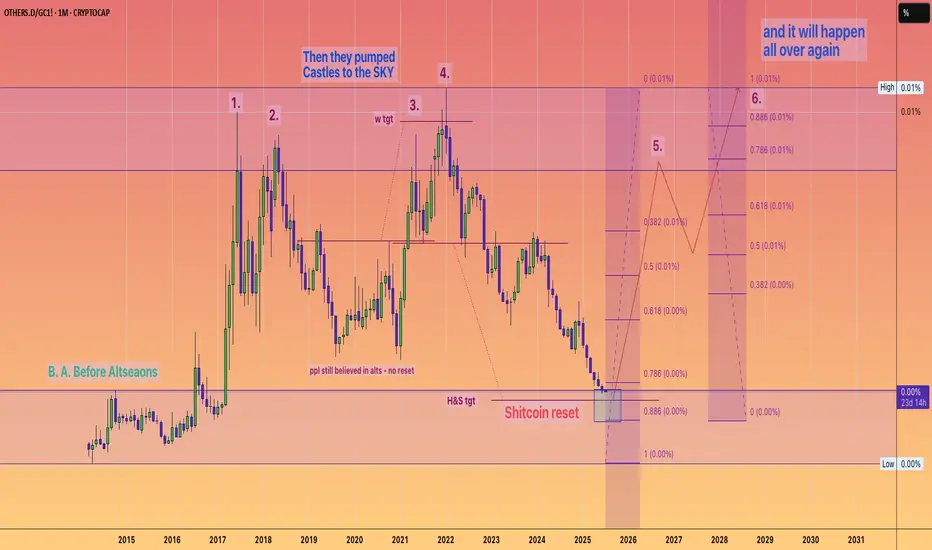
#OTHERS.D ~ Do you believe in Castles in the SKY?I believe that the Others dominance metric divided by an ounce of real money #Gold gives us a valuable insight into the fabled altseasons.
Because as this chart shows theres only been 4 in actuality
and you normal get a double bubble in a cycle.
So I believe we are at the cusp of turning things around as most people have given up on the concept of altcoins ever pumping again.
But it was just the business cycle #PMI that has depressed prices for the past few years.
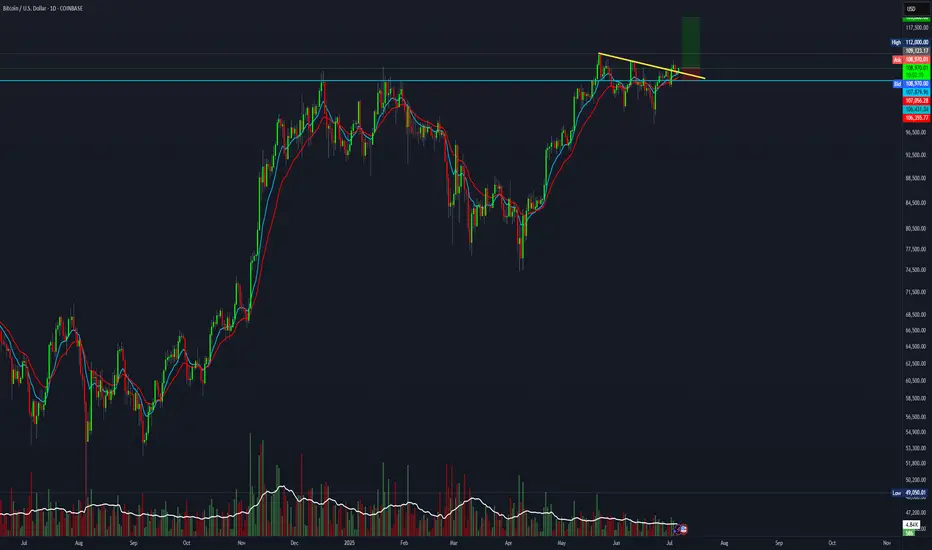
BTC setup with a 3.9 risk-to-reward ratio.Is BTC beginning a bullish move toward 120K?
This setup offers a 3.9 R:R with an
Entry at 109,000
Stop loss at 106,355
Target 120,000
Not financial advice.
Ethereum setup with a 14 R:R.Let’s see if this time marks the beginning of bullish momentum.
This setup offers a 14:1 risk-to-reward ratio
Entry at 2560
Stop loss 2457
Target at 4000.
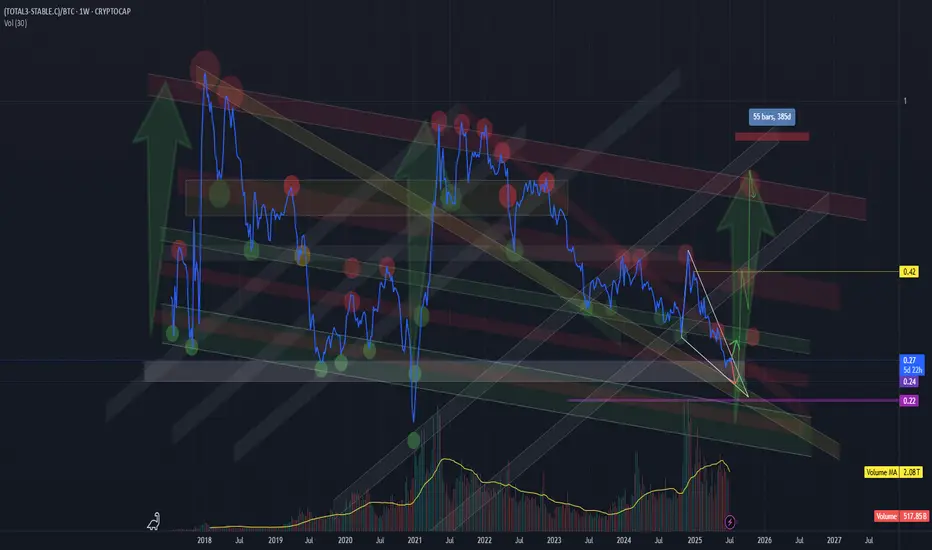
True altcoin-to-BTC strength indicator(CRYPTOCAP:TOTAL3-CRYPTOCAP:STABLE.C)/CRYPTOCAP:BTC
This formula strips out the noise and gives a true altcoin-to-BTC strength indicator.
STABLE.C removes all major stable coins (USDT, USDC, DAI, etc.).
The chart clearly shows previous capitulation zones and launch points for altseasons since 2017
Current formation – potential triangle:
Market makers appear to be coiling price action, forming a triangle-like structure.
This often precedes a volatile breakout — likely to the upside if history repeats.
Market psychology:
Many traders are already heavily positioned in altcoins, which suggests we could be nearing final capitulation.
Historically, altseasons never began with euphoria — but rather fear, exhaustion, and apathy.
BTC halving occurred in April 2024, and typically, the peak of the altseason follows 12 to 16 months later.
The seasonal strength of Q4, often fuels altcoin rallies.
!!! A final washout into a key support zone (on this ratio) could mark the trigger for the next major altseason — possibly starting around August 2025 !!!!!!!!
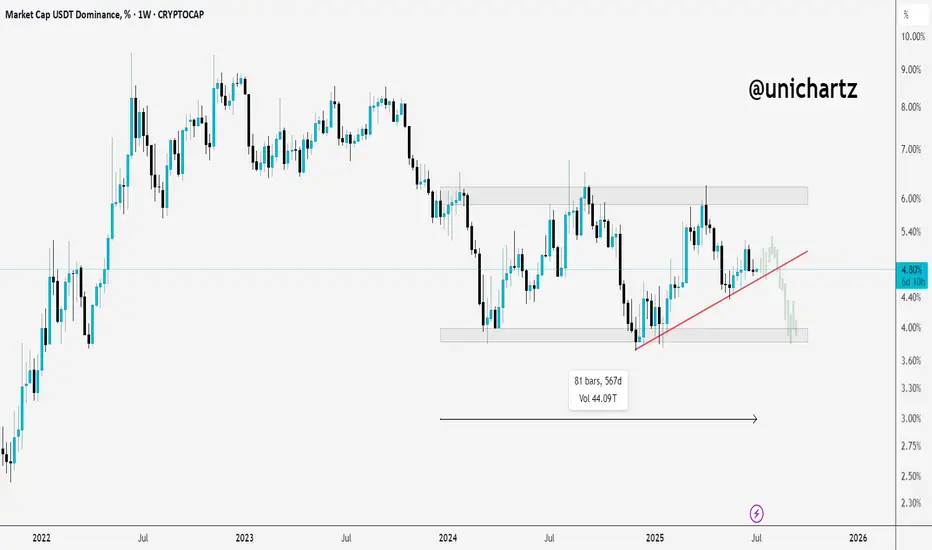
USDT Dominance Locked in Range – Altseason Not Ready Yet?USDT Dominance has been trading inside a wide sideways range for the last 567 days — bouncing between the 3.6% demand zone and the 6% supply zone.
The recent price action shows a rejection from the top of the range and now heading toward the mid or lower part of the channel. A minor trendline (in red) had shown some short-term support, but it looks weak now.
As long as this range holds, true altseason may remain on pause. The big move will come only when USDT.D breaks out or breaks down from this range.
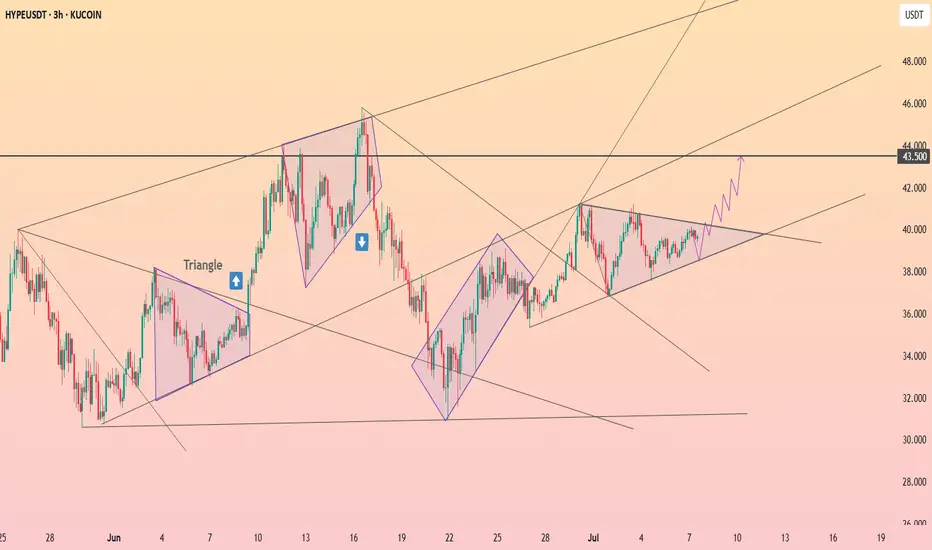
HolderStat┆HYPEUSD forming the triangleKUCOIN:HYPEUSDT has entered a narrowing triangle formation with a bullish trajectory, forming higher lows from the 33 USDT base. Price is nearing resistance around 40 USDT, and if breached, the pattern projects continuation toward the 43.5 USDT level.
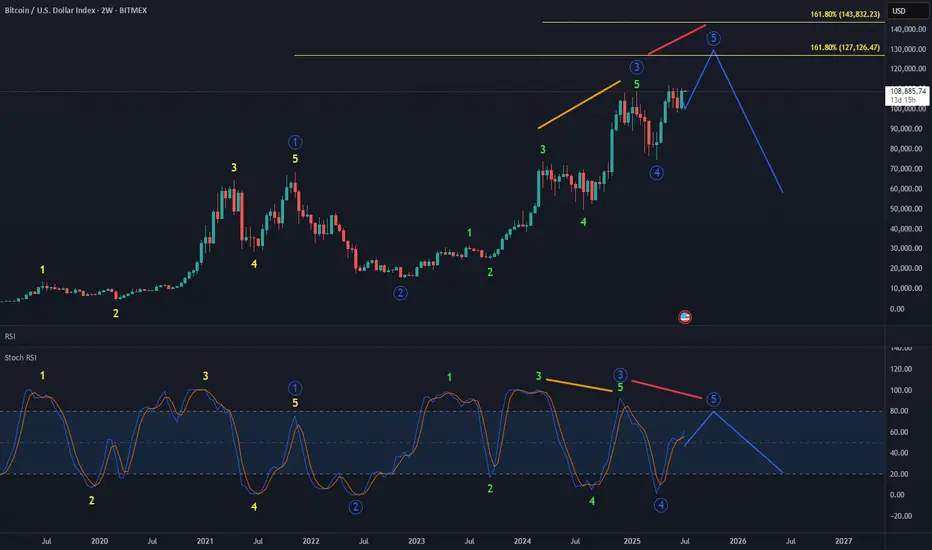
Bitcoin Bullish Continuation in Progress🔵 Bitcoin Weekly structure confirms higher highs & higher lows, reinforcing the bullish trend.
📈 As long as CRYPTO:BTCUSD holds above key support near $106K, the next leg could target $127K–$143K within the coming 2 months.
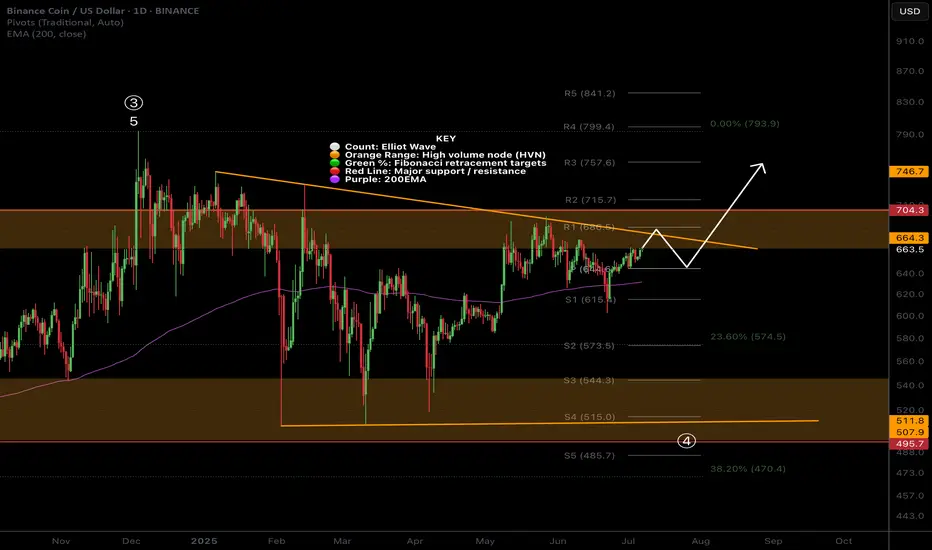
BNB Stuck in Barrier Triangle?CRYPTOCAP:BNB appears to be in a macro wave 4 barrier triangle, and for some time.
It has held up particularly well during the alt coin massacre, not even reaching the .382 Fibonacci retracement.
Price is testing the upper boundary for the 4th time, that starts to give us the higher probability breakout which increases with each test. The daily 200EMA and pivot were tested as support successfully.
Safe trading.
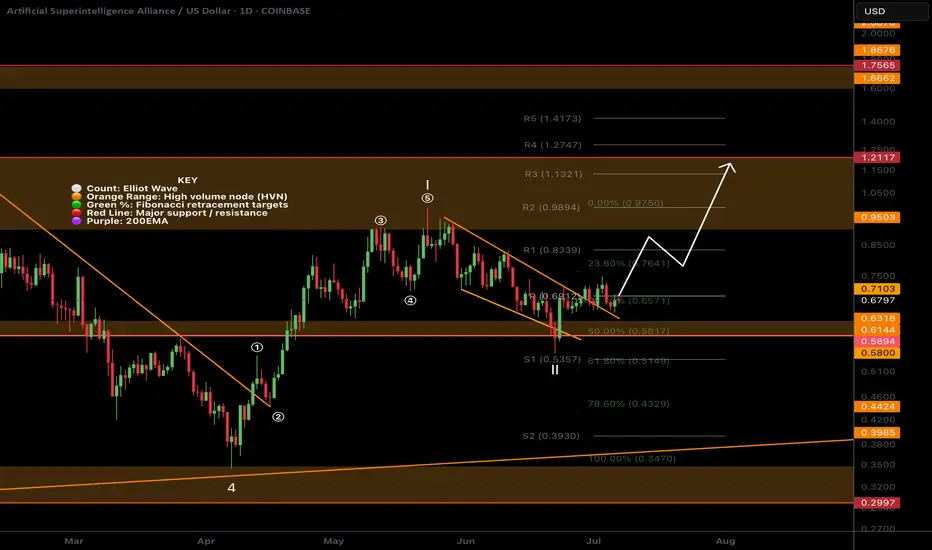
$FET Ready for the next move up?NYSE:FET looks ready for the next move up with a similar analysis to many other alts I have shared.
It is breaking out of descending resistance after testing the .618 Fibonacci retracement and High Volume Node (HVN) as support. Price broke above the daily pivot and is now swinging below, a recovery above the local swing high will be a bullish signal to go long with a wave 3 target of the R3 daily pivot and major resistance HVN at $1.13.
Analysis is invalidated below $0.54
Safe trading
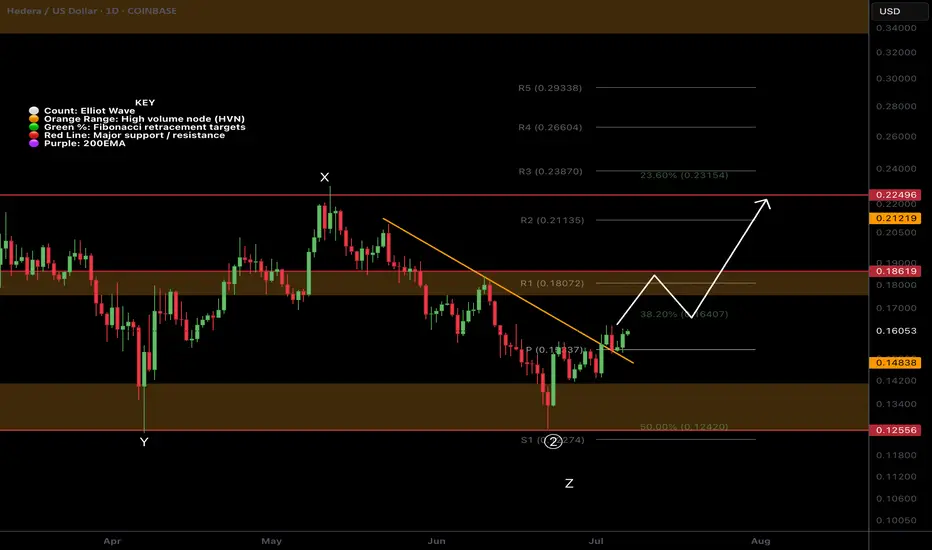
$HBAR Ready for a move up?CRYPTOCAP:HBAR appears to have completed its wave 2 WXYXZ complex correction
It has broken its descending resistance & daily pivot, retested both as support and is approaching the local swing high which would be a bullish long signal.
Cautious traders may want to take partial take profit at the first resistance High Volume Node and R1 pivot $.18 and a secondary target with good RR is the swing high resistance node at $0.22.
Analysis is invalidated below $.14 swing low.
Safe trading
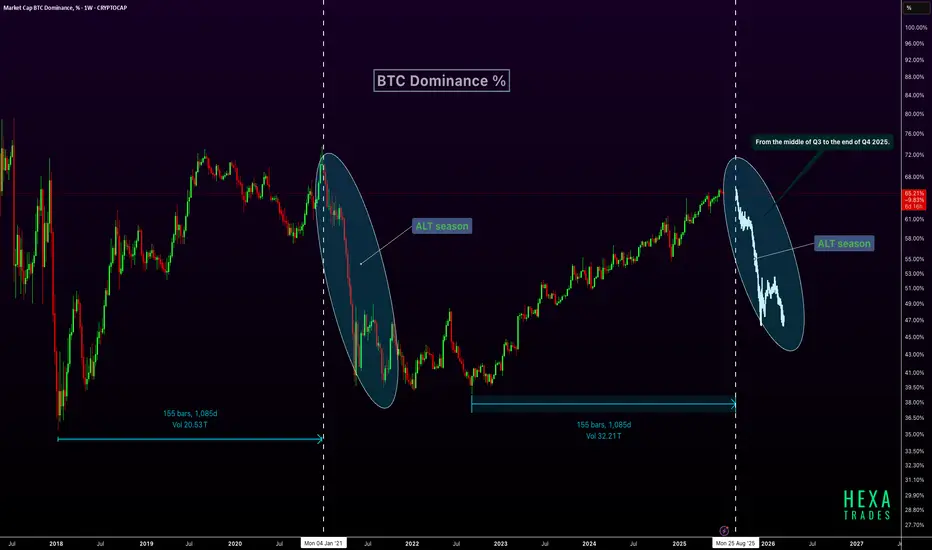
Altseason Ahead? BTC Dominance Cycle RepeatsBTC dominance is forming a pattern similar to the 2021 cycle, where dominance peaked after a long uptrend and then sharply declined, triggering a major altseason. Interestingly, that drop occurred after a 1,085-day rise, a time span we are once again approaching in 2025, projected to end around late August. If history repeats, BTC dominance could start declining from mid-Q3 2025, leading into a strong altcoin rally that may last through the end of Q4. This setup aligns with typical post-halving behavior, suggesting the final phase of the cycle could heavily favor altcoins.
CRYPTOCAP:BTC CRYPTOCAP:ETH CRYPTOCAP:XRP
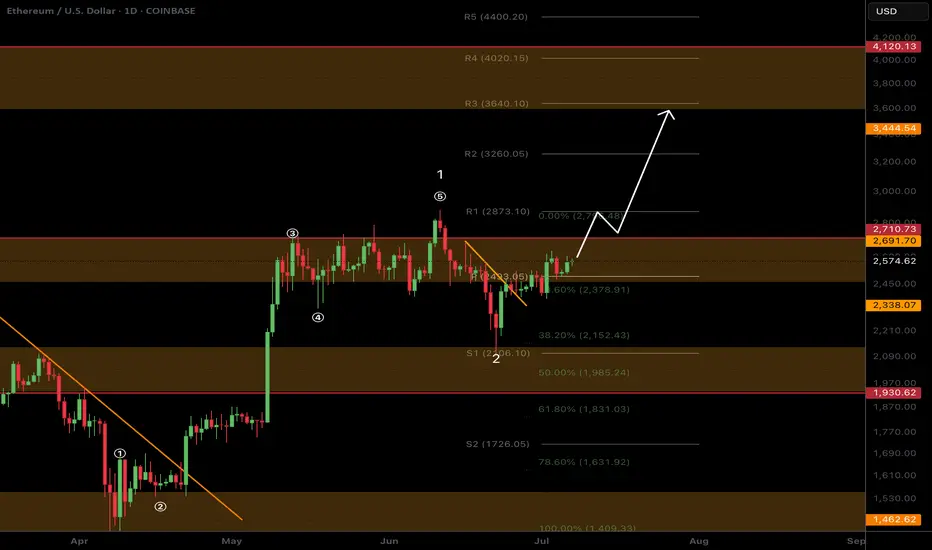
$ETH Breakout this week?CRYPTOCAP:ETH local chart looks ready
I think were looking at a decent ETH breakout this week to the next resistance High Volume Node at $3600 minimum target.
👉 BTC is consolidating under all time high resistance after multiple tests which is usual a sign of bullish continuation. Usualy giving alts room to room.
👉 Ethereum is above the daily 200EMA, daily pivot and also consolidating under resistance once more after testing the 0.382 Fibonacci retracement and S1 daily pivot adding confluence to that being the local bottom. This appears to be Elliot wave 2, a shallow wave 2 retracement (less than 0.5) is a show of strength and investor impatience.
Analysis invalidated below the daily pivot and daily 200EMA as this will lock in 3 waves up and look corrective.
Safe trading
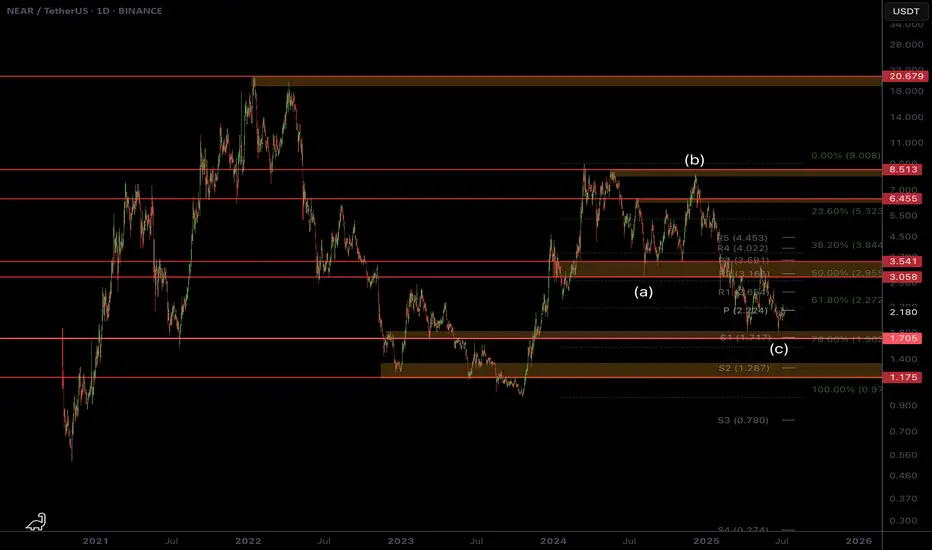
$NEAR Disappointing so far...CBOE:NEAR is disappointing me as it continues towards the lows
Testing the .786 alt-coin golden pocket High Volume Node so should see a decent reaction from here as it appears a an ABC correction is complete after an Elliot wave motif wave.
Safe trading
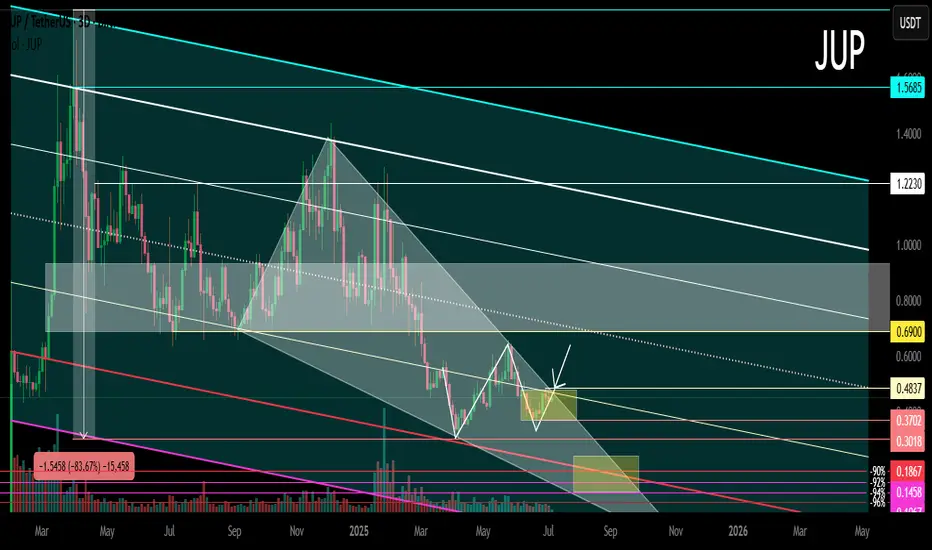
JUP Main trend. Channel. Wedge. Double bottom. 06 07 2025Logarithm. Time frame 3 days. Decline from the maximum -84% (this is not enough), but given the capitalization of 59th place, if the market is positive in the near future, then it is quite possible to reverse this cryptocurrency through a double bottom.
All long-term consolidation above with high volatility is the distribution of ladies and gentlemen. Also study the vesting of this cryptocurrency. There are less than half of the tokens on the market, and there are also pauses for 1 year, which is good.
Jupiter (JUP) is a key player in the decentralized finance (DeFi) space, especially in the Solana blockchain.
Main trend is downward. Descending channel.
Secondary trend is downward. Descending wedge.
Local trend is sideways. Potential double bottom in case of a breakout.
The price will move in the corridors of this descending channel from the dynamic lines of its support/resistance. Remember this and use it in your trading strategy, observing money management.
Local breakout zone
Understand where the zones are cheap, and where, on the contrary, the zones are expensive. If you work (tear out movements, there should be short-term or conditionally medium-term transactions, with very mundane goals) conditionally in expensive zones, then limit losses. Do not let yourself be fooled by news noise and the opinions of the majority.
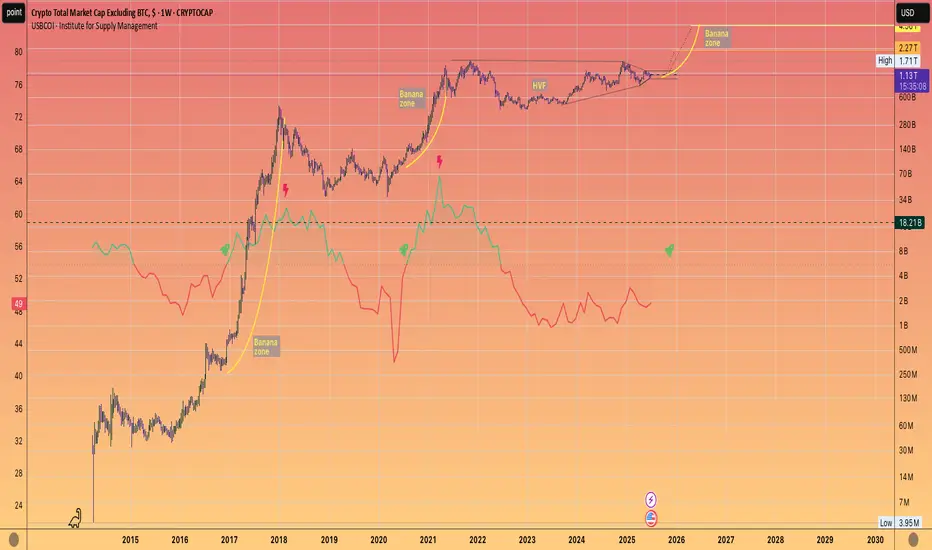
Banana zone starts when PMI is above 53.Check your charts to verify this fact.
Total 2 with the US Purchasing Managers Index overlain.
The PMI is one of the most reliable leading indicators for assessing the state of the U.S. economy.
Previous Banana zones have coincided with the PMI above 53.
so not just when the economy is growing, but when the economy has entered humming along approaching full acceleration.
This is when most people will feel confidence and WANT to take on more risk as they are most optimistic about the future when the economy is in this state of being.
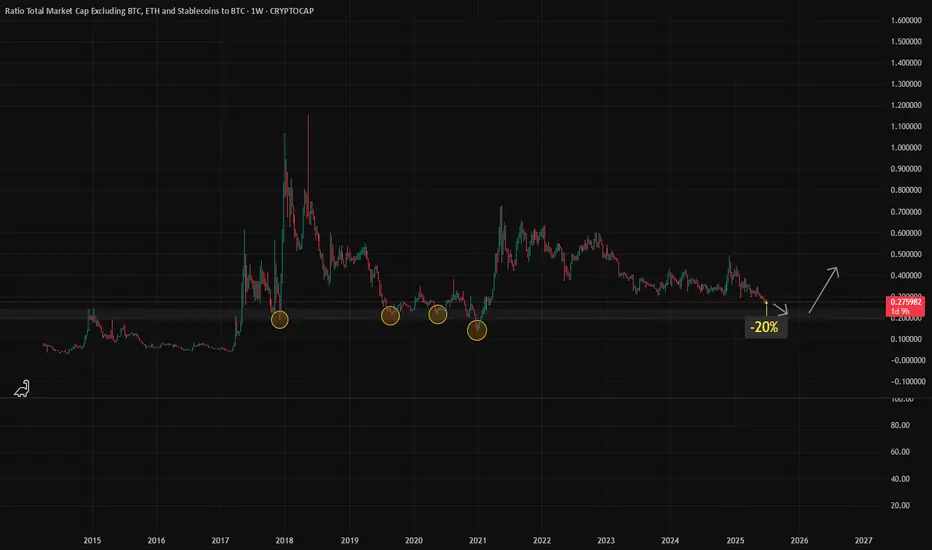
Altcoins Near Key Support, Possible -20% Drop before reversal ?Sharing my analysis on the altcoin market cap (excluding BTC, ETH, and stablecoins) compared to BTC over the past 10 years
I have marked important zones (yellow circles) where altcoins have historically bounced after strong corrections.
Current Outlook:
- I expect a possible -20% more downside, bringing it near 0.22, which aligns with a key historical support zone.
- This level has acted as a strong base multiple times, in 2018, 2020 and 2021
What I’m Watching:
- If price reaches that zone and holds, it could signal the start of the next altseason.
- Past patterns show similar moves before big reversals.
- However confirmation through volume and market sentiment is important before making any move
Final Note:
Not financial advice, just sharing what I see on the chart. If the ratio hits 0.22 and shows strength, it could be a key level to watch. Thanks