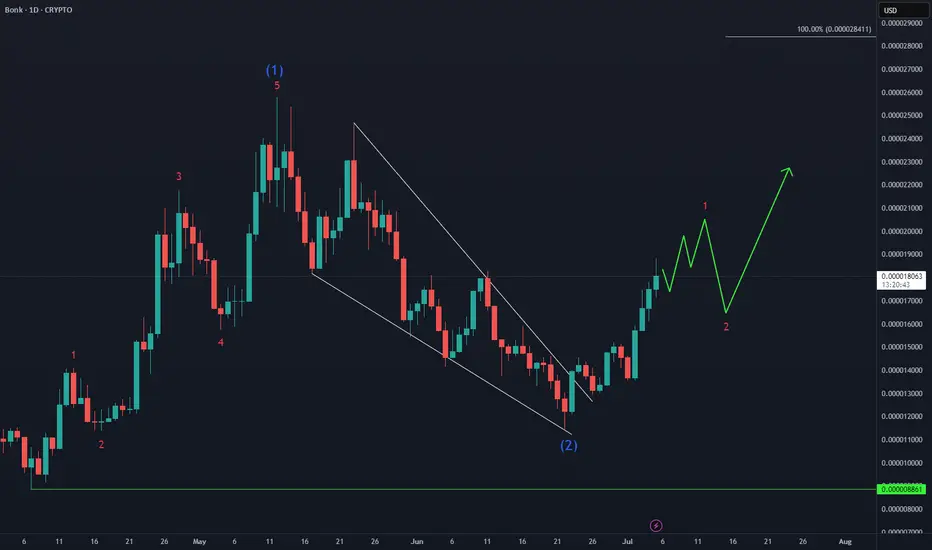
BONK Bullish Reversal in PlayAfter a clean 5-wave advance from the April low, CRYPTO:BONKUSD corrected 55%, then carved out a higher low last month. Now it’s eyeing a breakout above the May peak as the next leg higher begins.
Altseason
PARTI Setup: Key Reversal Zone Could Spark +50% RallyToday, I want to analyze the Particle Network ( BINANCE:PARTIUSDT ) project for you, which has a chance of increasing by +20% to +50% in the short term .
Let's first take a look at the fundamental state of the Particle Network (PARTI) project .
Particle Network is building a modular Layer-1 blockchain with a focus on Chain Abstraction, aiming to unify user experiences across multiple chains through:
Universal Accounts – Single account across all chains
Universal Liquidity – Access liquidity without bridging
Universal Gas – Seamless cross-chain transactions without gas token concerns
The project has:
Raised $25M+ funding from top-tier investors (Binance Labs, Animoca Brands, Spartan Group)
Integrated with 60+ blockchains and 900+ dApps
Reached over 1.3M testnet accounts and 27,100 daily transactions (Messari Q1 2025 report)
Recently launched UniversalX (a cross-chain DEX) as its flagship dApp
Summary:
Particle Network shows strong fundamentals with innovative tech, a growing ecosystem, and backing from major players in crypto. Long-term success will depend on user adoption of Universal Accounts and dApps like UniversalX.
------------------------------------------------------
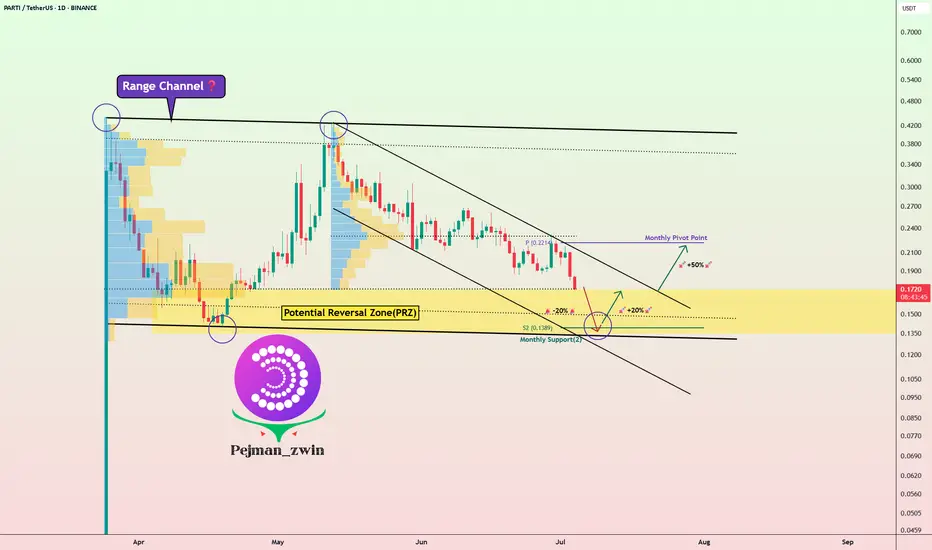
Now let's take a look at the PARTI token chart on the daily time frame .
PARTI token is currently trading near Potential Reversal Zone(PRZ) , Monthly Support(2) . There is also a possibility of a Range channel forming, we should wait for the confirmation of the second bottom .
I expect the PARTI token to start rising again from the Potential Reversal Zone(PRZ) and near $0.14 .
Note: Stop Loss(SL)= $0.1177
Please respect each other's ideas and express them politely if you agree or disagree.
Particle Network Analyze (PARTIUSDT), Daily time frame.
Be sure to follow the updated ideas.
Do not forget to put a Stop loss for your positions (For every position you want to open).
Please follow your strategy and updates; this is just my Idea, and I will gladly see your ideas in this post.
Please do not forget the ✅' like '✅ button 🙏😊 & Share it with your friends; thanks, and Trade safe.
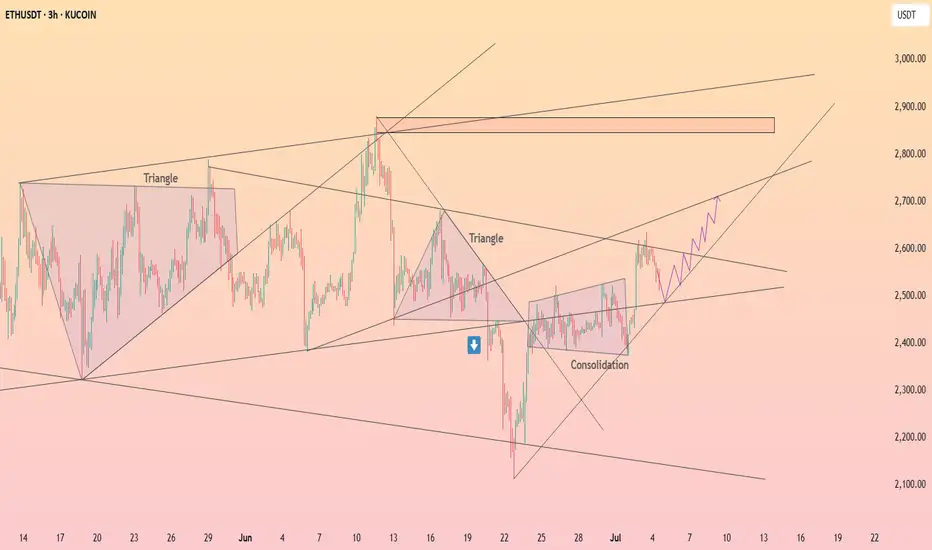
HolderStat┆ETHUSD correctedKUCOIN:ETHUSDT is moving inside a rising wedge after reclaiming support near $2,500. Recent breakout from consolidation supports a continuation push toward $2,720–$2,760. The current trendline structure and bullish price action suggest upside potential.
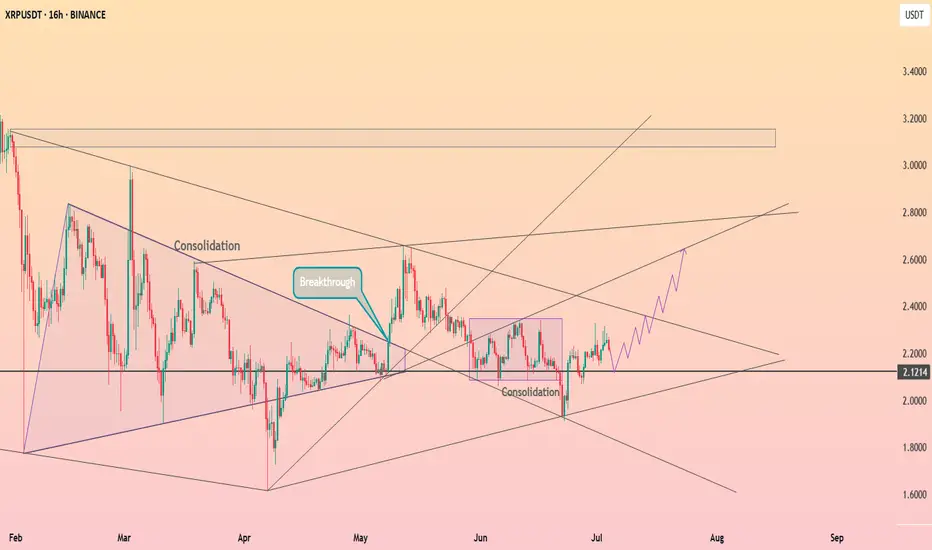
HolderStat┆XRPUSD forms an ascending structureBINANCE:XRPUSDT is forming a stair-step bullish pattern after breaking out of consolidation above 2.12. The current trajectory suggests continued movement toward 2.70, with multiple support bounces validating the structure. Price action remains favorable for bulls.
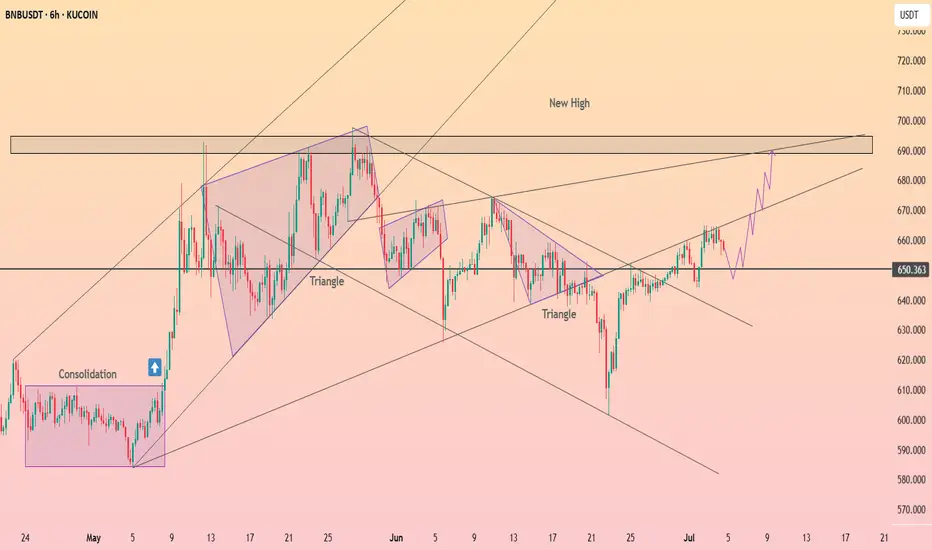
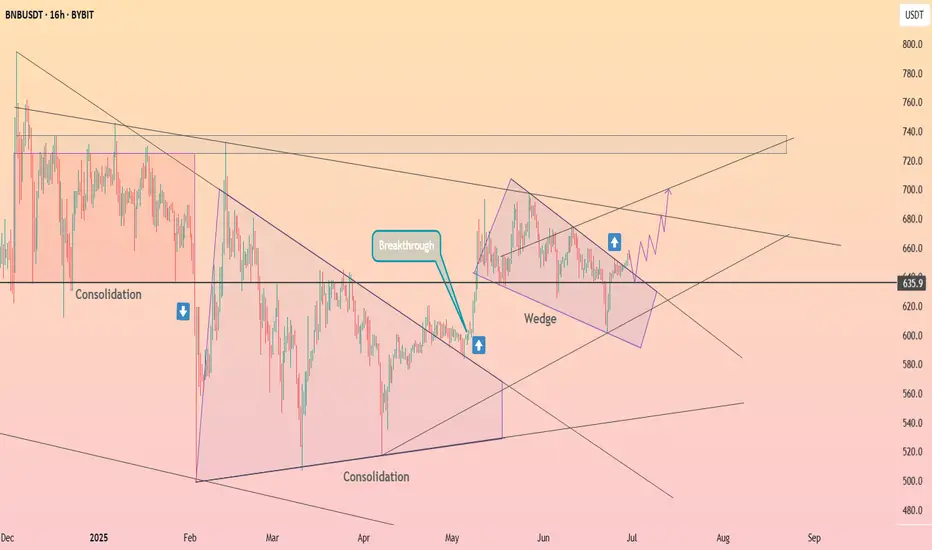
HolderStat┆BNBUSD consolidated above the $650 levelKUCOIN:BNBUSDT is holding firm above 650 after breaking through a symmetrical triangle. The price structure is supporting a bullish continuation toward the upper resistance zone at 690–700. A clear uptrend is forming with tight consolidation along support, hinting at a breakout move.
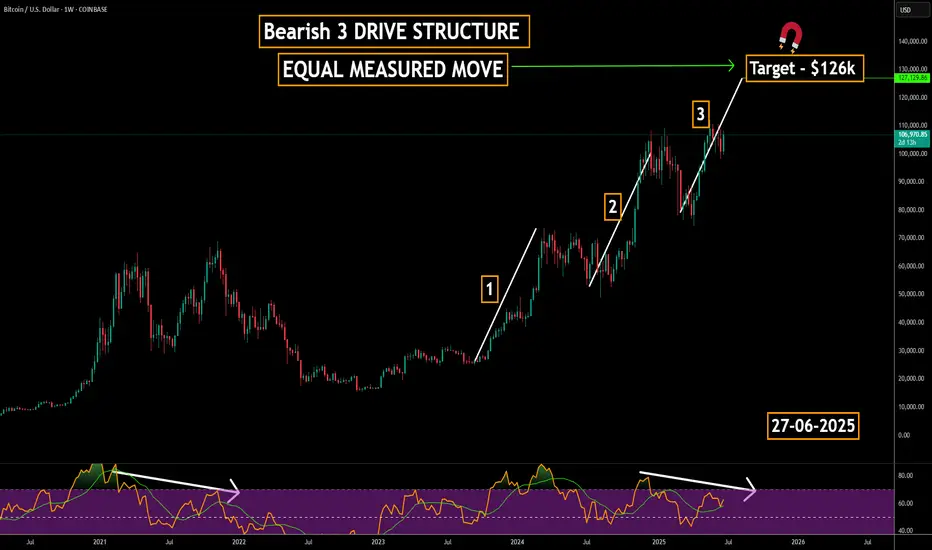
MACRO 3-Drive Pattern on Bitcoin | Major Reversal Ahead?Is Bitcoin completing a massive 3-drive structure on the macro chart?
Three clear pushes higher, each with fading momentum, are flashing a major reversal signal.
This could be the final phase before a long-term shift — are you ready for what’s next?
📚 3-Drive Structure Trading Strategy — Full Breakdown
The 3-Drive Pattern is a powerful reversal-based price structure used to spot major turning points in trending markets. It works by identifying three consecutive drives (or pushes) in one direction, typically ending with exhaustion and a high-probability reversal.
Each drive forms a new high or low, but with weakening momentum — especially visible using RSI, MACD, or volume divergence.
🔍 What is the 3-Drive Pattern?
3 consecutive higher highs (or lower lows)
Each drive followed by a shallow pullback
Momentum weakens on each push (divergence forms)
Fibonacci symmetry often present:
- Drive extensions: 127.2%–161.8%
- Pullbacks: usually 61.8%
📉 Bearish 3-Drive (Reversal from Uptrend):
Drive 1: Price makes a higher high with strong momentum
Drive 2: Another higher high, weaker strength
Drive 3: Final high with clear divergence
Reversal: Entry when price breaks below structure
🎯Entry Criteria:
Wait for all 3 drives to form
Confirm with divergence on Drive 3
Use a confirmation candle or structure break
Stop-loss: just beyond the 3rd drive’s high
🎯 Targets:
Conservative: Return to Drive 2 base
Aggressive: Full trend reversal (50%–100% Fib retracement)
🧠 Pro Tips:
Best on 4H, 1D, 3D or 1w timeframes
Confirm with RSI, MACD, or volume divergence
Combine with key S/R or supply-demand zones
💡 Summary:
The 3-Drive pattern is one of the most reliable reversal structures when combined with divergence and Fibonacci symmetry. It's especially powerful at market exhaustion zones and works best with confirmation-based entries.
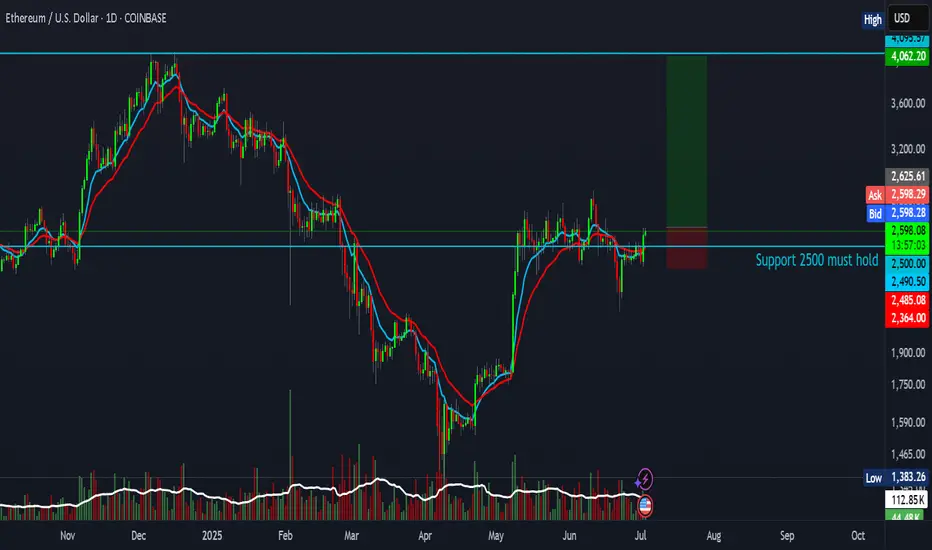
Ethereum Trading Strategy: 5:1 Risk-to-Reward Ratio"Ethereum Showing Strength on the 4-Hour Chart — A New Bullish Trend Emerging?"
The 4-hour timeframe is starting to show strong bullish momentum. Could this be the beginning of a new uptrend?
A potential 5:1 risk-to-reward setup is forming:
Entry: 2,620
Stop Loss: 2,364
Target: 4,062
Support 2500 must hold!!!
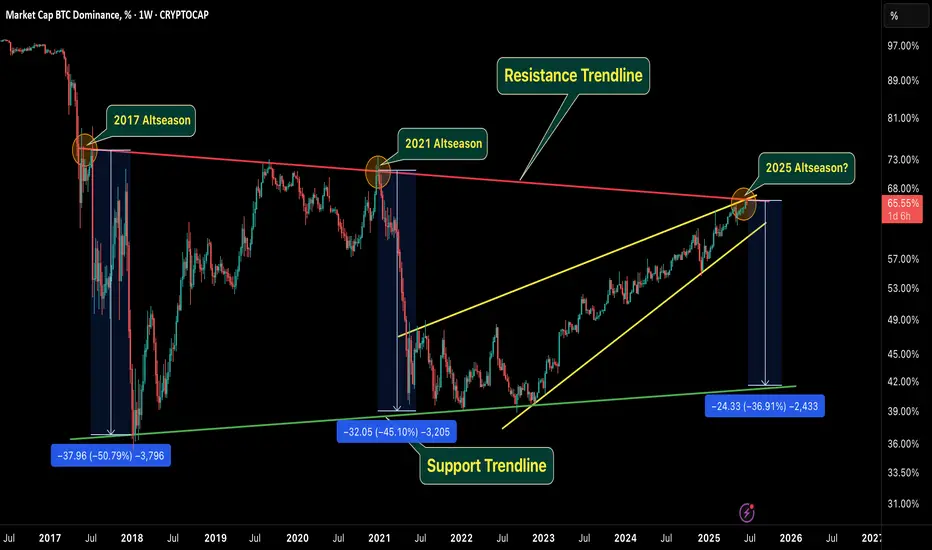
BTC Dominance – History Repeating? Altseason 2025 Loading? Hey Traders!
If you’re finding value in this analysis, smash that 👍 and hit Follow for high-accuracy trade setups that actually deliver!
This chart is SCREAMING for attention 👀
We’re at a critical inflection point on the weekly BTC Dominance chart — and if history has taught us anything, it’s that altseasons are born when dominance collapses from resistance.
🧠 Key Observations:
🔺 Macro Resistance Trendline:
Rejected in 2017 → Altseason 🔥
Rejected in 2021 → Altseason 🔥
Now (2025?) — BTC.D is again touching this same red trendline...
🟢 Support Trendline:
BTC.D formed a clean long-term support from which previous dominance drops have bounced — currently lining up around 42–45%.
📉 Previous drops after rejection:
2017: –50.79%
2021: –45.10%
2025 projection? –36.91% (which would bring us to the same support zone again)
🟡 What It Means:
If BTC.D gets rejected from this resistance again, it could mark the start of the long-awaited Altseason 2025. A breakdown from this wedge would likely result in capital rotation from BTC into altcoins — just like in previous cycles.
🔍 What to Watch:
A confirmed rejection from this red resistance line
Drop below the yellow wedge support
BTC sideways / ETHBTC strength = green light for ALTS
💥 This could be the altcoin opportunity of the next couple of years.
Conclusion:
All eyes on BTC Dominance — because when it falls, altcoins usually FLY.
📊 Stay updated, stay ready.
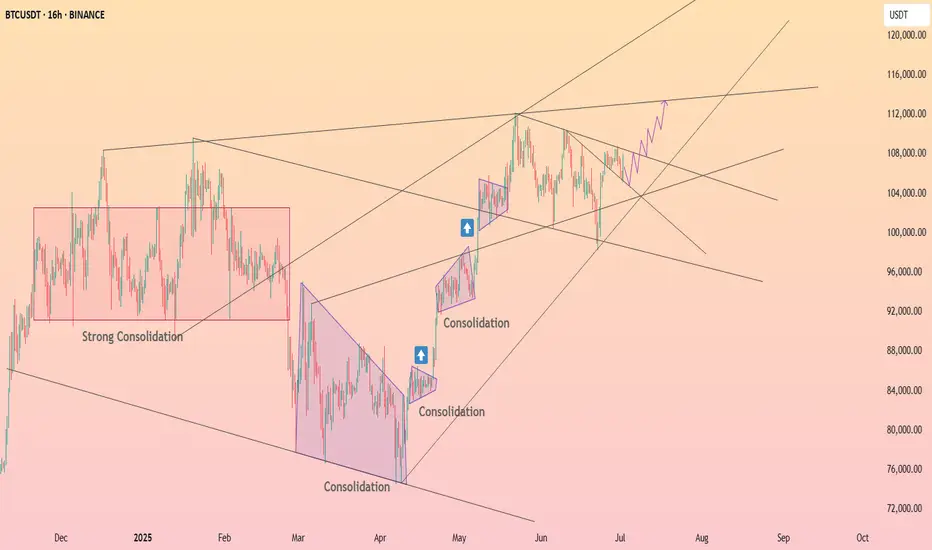
HolderStat┆BTCUSD ready to break through the resistanceBINANCE:BTCUSDT has completed another consolidation breakout and is coiling near key resistance. The price action points toward a move to 114,000 if the 102,000 level holds and volume confirms the continuation trend.
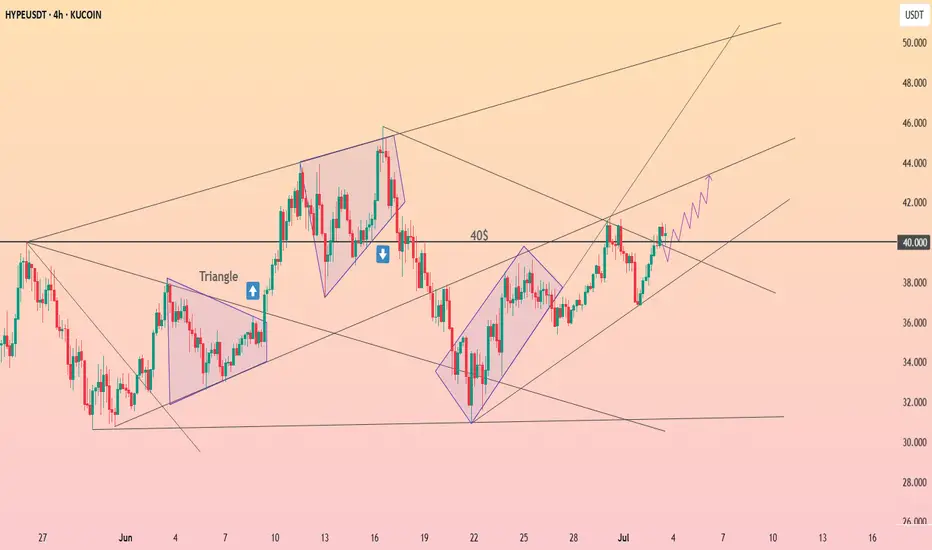
HolderStat┆HYPEUSD above the $40 resistanceKUCOIN:HYPEUSDT has reclaimed $40 resistance and is now trending in a rising channel. Past triangle breakouts signal that $43–$45 could be next if the current momentum continues to build.
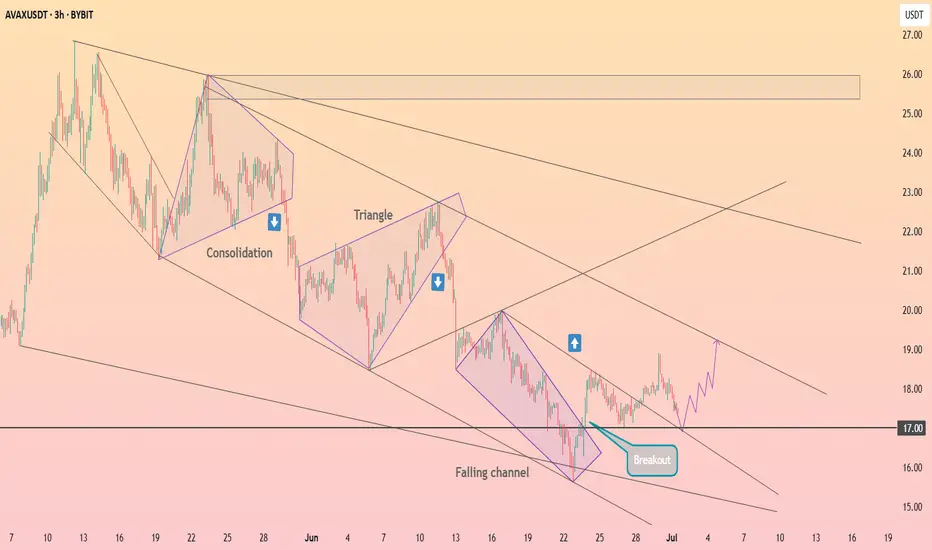
HolderStat┆AVAXUSD seeks to retest $17BINANCE:AVAXUSDT is pushing upward after a breakout from the falling channel structure, reclaiming the $17 support area. The short-term projection points toward $19, with upside potential toward $22 if the channel resistance breaks. Momentum is building from the breakout zone.
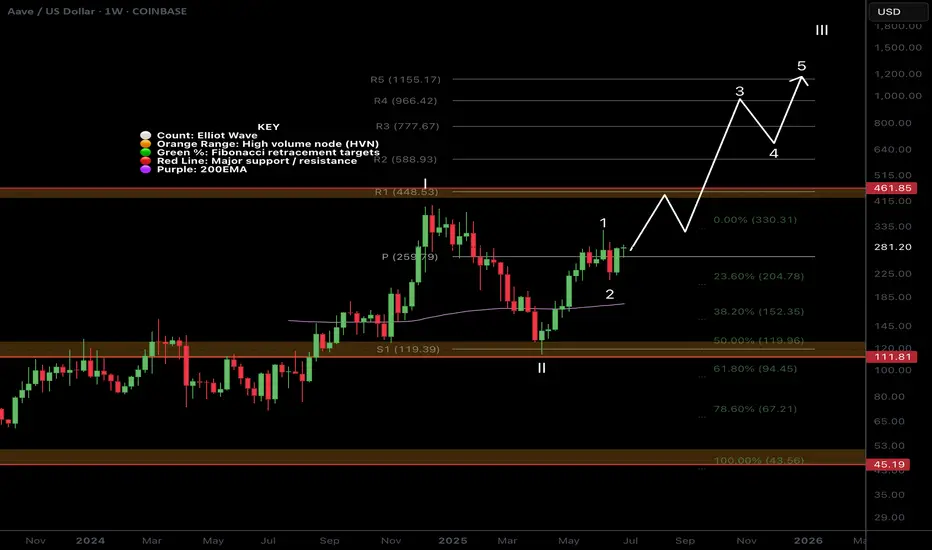
$AAVE Going Through a Major Bullish Trend Shift!CRYPTOCAP:AAVE continues to outperform on pumps and retracements this cycle after being beaten down for many years!
Price consolidated below the weekly pivot and found support, only retracing to the .618 Fibs.
Wave 3 of iii pf a new Elliot Motif Wave looks well underway with the next price target being the R1 weekly pivot High Volume Node at $448.
Long term outlooks is very bullish for AAVE with a terminal target of the R5 weekly pivot £1155
Safe trading
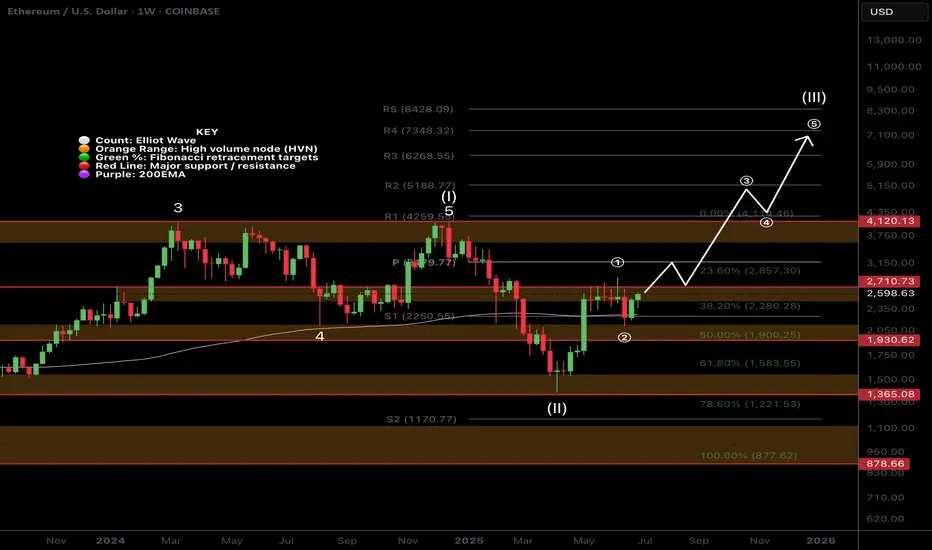
$ETH Wave 3 of 3 Underway?CRYPTOCAP:ETH is back into the range EQ as alt coins pump on the back of CRYPTOCAP:BTC breakout
Price caught a strong bid after testing quadruple support: the major High Volume Node (HVN), daily 200EMA, 0.5 Fibonacci Retracement and daily S1 Pivot. Last week I posted about this area holding to kick off wave 3.
There is still work to do to overcome the recent swing high at HVN major resistance but things are certainly looking bullish. The daily pivot point sits at $3150 as the next target.
Long term terminal target for wave 3 is still the R4 daily pivot at $7340, I don't expect the terminal wave 5 to extend much beyond this, perhaps a wick above to trap retail at the top with a lot of media hype attached.
Analysis is invalidated if we fall below wave (2) swing low $2050.
Safe trading
BSW Bull Trap:Binance Delisting + Weak Fundamentals = -50% AheadToday, I want to analyze the Biswap project ( BINANCE:BSWUSDT ) with the BSW token for you and examine the opportunity for a short position on the BSW token from a Fundamental and Technical perspective.
First, let's examine the conditions of the Biswap project from a Fundamental perspective.
Biswap is a decentralized exchange (DEX) built on the BNB Chain, offering features like token swaps, farming, staking, and an NFT marketplace. It became popular due to its very low trading fees (0.1%) and an aggressive referral & reward system.
However, the project is facing key fundamental issues:
Decline in trading volume and user activity
Drop in TVL rankings among DEX platforms
Inflationary tokenomics with constant reward emissions, increasing sell pressure
Most critically, Binance announced the delisting of BSW (effective July 4, 2025), shaking investor confidence severely .
In summary, while Biswap started strong, its fundamentals have weakened significantly, especially after the Binance delisting, which casts doubt over its future viability.
---------------------------------------------------
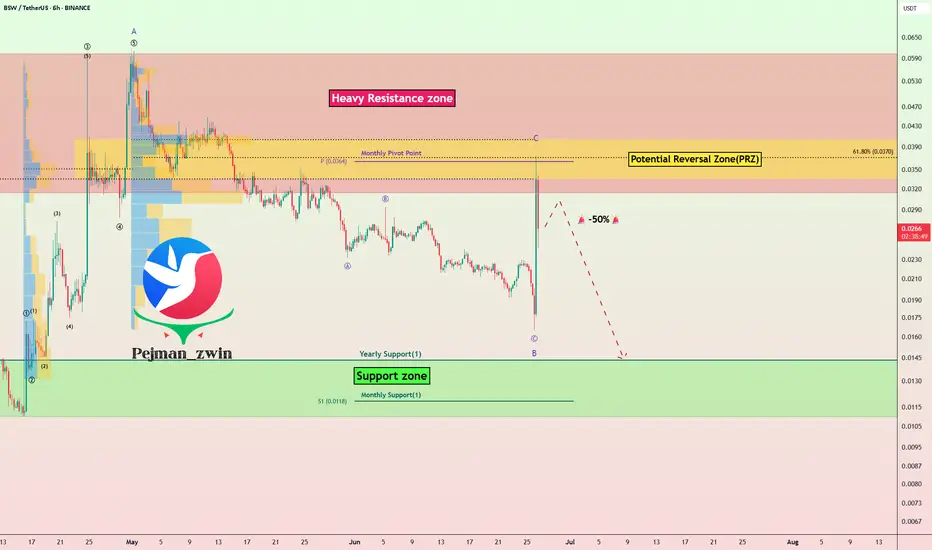
In terms of Technical Analysis , the BSW token managed to reach the Heavy Resistance zone($0.060-$0.0315) and Potential Reversal Zone(PRZ) with the previous hours' pump( more than +100% ), but then started to decline again.
In terms of Elliott wave theory , I consider the recent hours pump as a wave C of the Zigzag Correction(ABC/5-3-5) .
I expect that given the delisting(soon) of the BSW token and the technical analysis of the BSW token, it will fall by at least -50% . In fact, this pump could act as a Bull Trap .
Note: Stop Loss(SL)= $0.0422 = We can expect more pumps.
Please respect each other's ideas and express them politely if you agree or disagree.
Biswap Analyze (BSWUSDT), 1-hour time frame.
Be sure to follow the updated ideas.
Do not forget to put a Stop loss for your positions (For every position you want to open).
Please follow your strategy and updates; this is just my Idea, and I will gladly see your ideas in this post.
Please do not forget the ✅' like '✅ button 🙏😊 & Share it with your friends; thanks, and Trade safe.
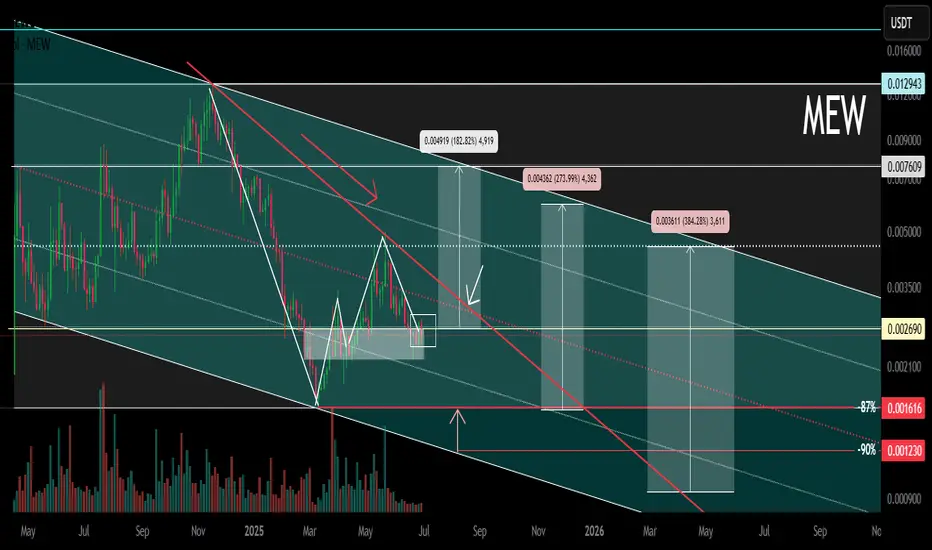
MEW Main Trend. Memcoin. 2025 07 02Logarithm. Time frame 3 days.
Cat in a dogs world (MEW)
X -133 thousand subscribers (this is not enough).
Reduction from the maximum -87%. For such assets, this is not enough.
I imposed a descending channel on the chart (current descending trend of the main trend), and a horizontal one, if by some miracle this local Ross hook is broken upwards (not forming a local head and shoulders), not only to the resistance of the secondary trend (red line), but to break through it. Percentages to key zones of support/resistance levels are shown for clarity.
After the downward trend is broken, such "psychological-fundamental" assets are usually pumped up by +800-1000% from the minimums or more. Low liquidity, and the contingent of people who subscribe to these projects, allows this to be done easily at the right time: "the hamster is not scared". After pumping — a slow death, with pumps an order of magnitude smaller. Therefore, do not forget to sell in the alt season.
When working with such cryptocurrencies by liquidity, observe money management, use partial entry or on a breakout. Do not use margin leverage, as there may be snot in any direction for a large percentage, which will lead to liquidation "out of the blue".
HolderStat┆BNBUSD came out of the wedgeBINANCE:BNBUSDT just cleared a multi-week wedge resistance, signaling a bullish breakout above $635. The price is now poised to retest the upper channel boundary near $700–730. If bulls maintain momentum, this breakout could mirror prior impulsive legs higher, especially following similar consolidation patterns earlier this year.
HolderStat┆SOLUSD aims for the $170 levelBINANCE:SOLUSDT has broken above triangle resistance, retesting the $146.60 level as new support. The breakout echoes earlier consolidation-based rallies, opening the path toward $170. As long as the structure remains intact, bulls could extend the climb over the next few sessions.

The Telcoin Explosion Starts Now!Telcoin reminds me of the early days of the Bitcoin cycle. I see strong potential for a massive pump coming soon. When cycles are this undervalued—when the community is strong, the fundamentals are solid, and the chart looks amazing—almost nothing can stop a parabolic run from happening.
As always, stay profitable.
– Dalin Anderson

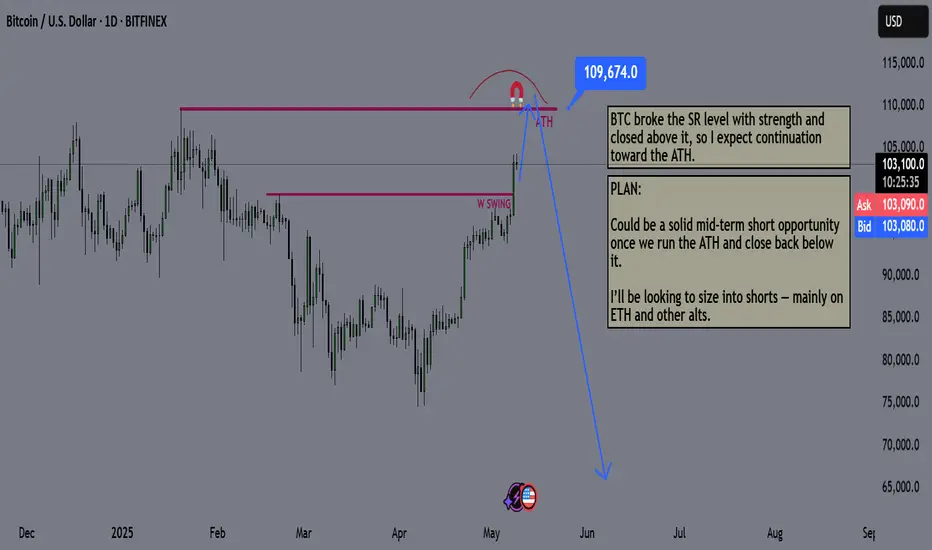
Bitcoin Mid Term Game Plan - BTC PLANBitcoin just broke a key resistance level with strength.
I expect a new all-time high soon, likely the summer top.
Summer markets are usually weak for risk assets and strong for gold. Seasonality matters, keep that in mind.
I expect risk markets to sell off until mid-July to early August. I’ll start buying once we break structure again.
The plan:
Wait for BTC to hit $110K
Look for a reversal from that level
Start aggressively shorting alts, beginning with ETH and memecoins
Hold shorts until late July / early August
Close positions and shift back to buying
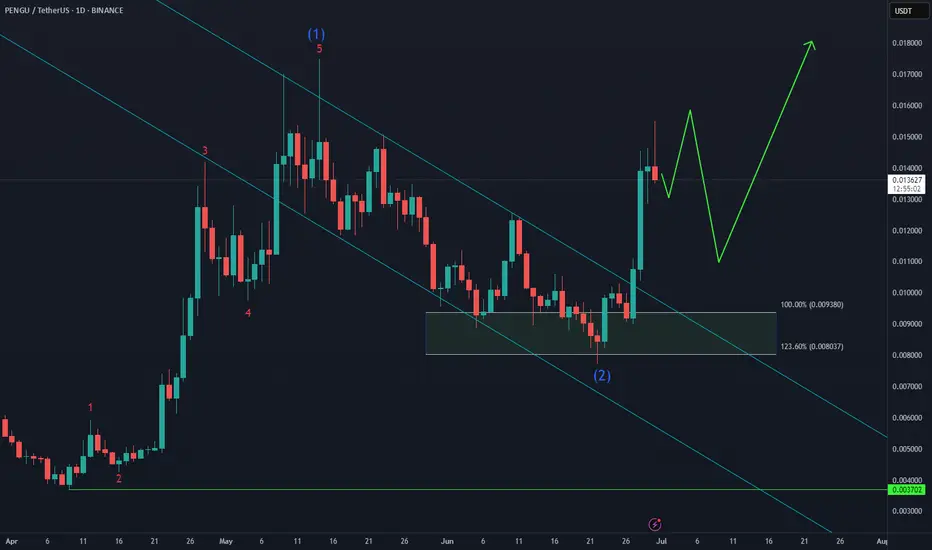
Pudgy Penguins PENGU Bullish Reversal Taking Shape🐧 Pudgy Penguins BINANCE:PENGUUSDT has bounced twice from the $0.009–$0.008 buying zone, showing resilience despite the choppy structure. As long as the June low holds, the setup favors a higher low formation next month, potentially setting the stage for the next impulsive leg higher.
Momentum is building — now it’s about follow-through and confirmation.
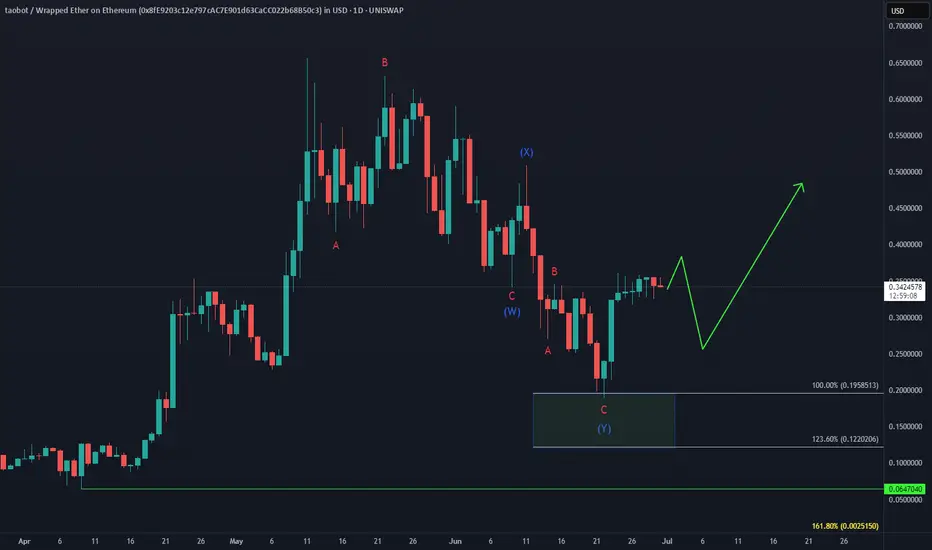
TAOBOT Bullish ReversalWill UNISWAP:TAOBOTWETH_8FE920.USD outperform BINANCE:TAOUSD ?
After the failed early June bounce, price completed a double correction into the $0.195–$0.12 equal legs zone, triggering a sharp 90% reaction higher.
As long as $0.19 holds, the setup favors continuation to the upside, with a break above the May peak in focus.
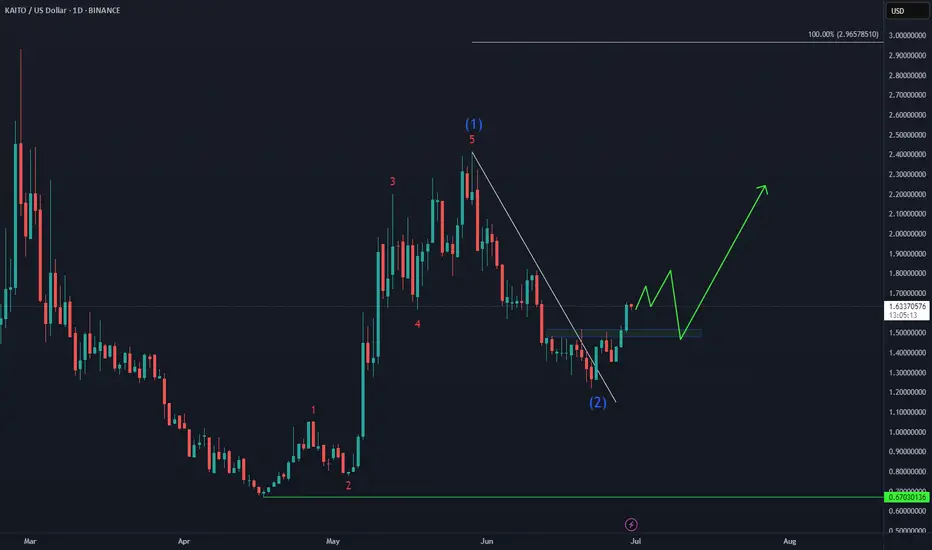
KAITO gears up for liftoff!CRYPTO:KAITOUSD
The correction from the May peak has wrapped up within wave (2), and price is now pivoting from the June low at $1.22. Holding above that level keeps the bullish roadmap intact—with eyes firmly on the $2.96 target to unlock fresh all-time highs.
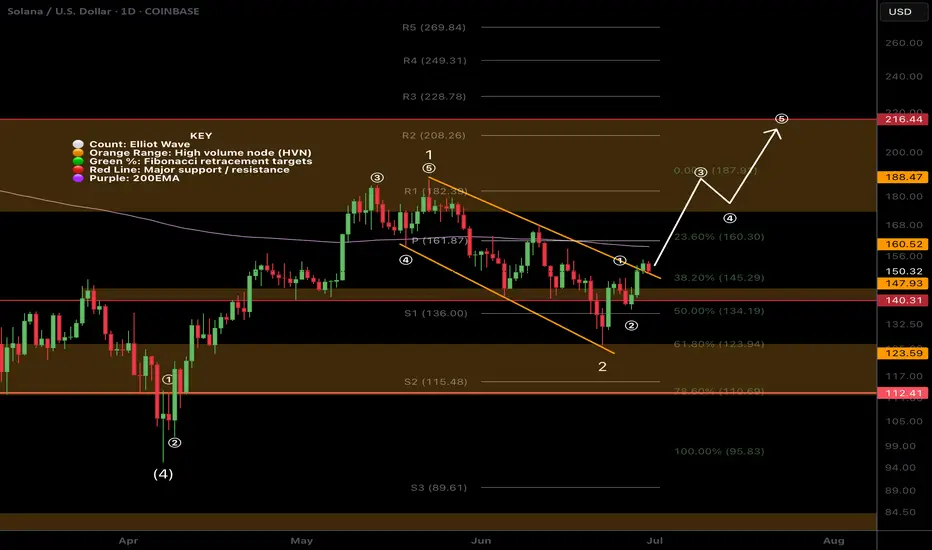
SOL Ready To Breakout?SOL had a decent move this weekend overcoming descending resistance and now testing as support.
Price appears to have a completed a wave (2) at the .618 Fibonacci retracement and S1 daily pivot and a larger degree wave 2 at the channel bottom, High Volume Node support and .618 Fibonacci retracement.
If a wave (3) of 3 is underway then we should expect a strong move sooner rather than later with an initial target of the swing high resistance a/ R2 daily pivot $208-$216 range
Safe trading.