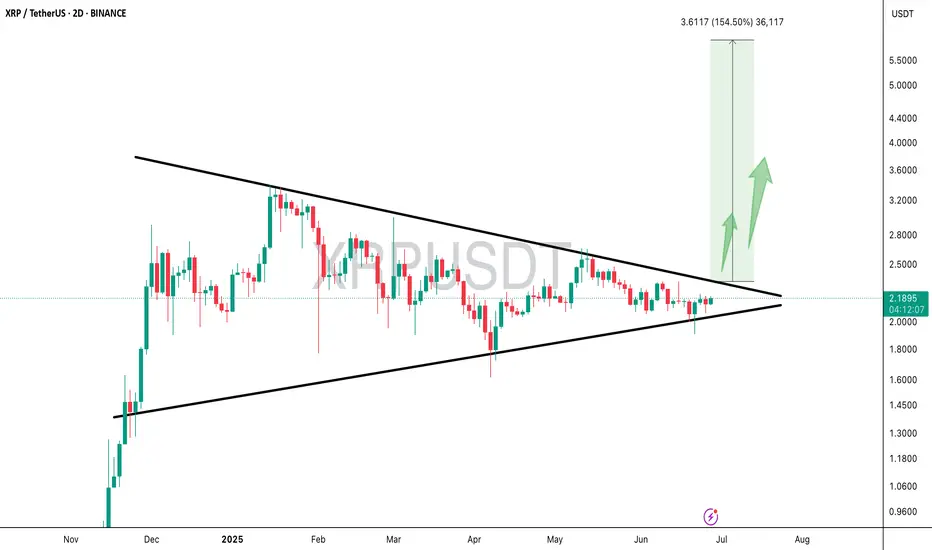
Breakout loading on $XRPBreakout loading on CRYPTOCAP:XRP 🚀
Accumulating heavily here as the price coils inside a massive triangle.
Q3 could be explosive, chart points to a breakout toward $4.60
Retweet if you're BULLISH !!
Altseason
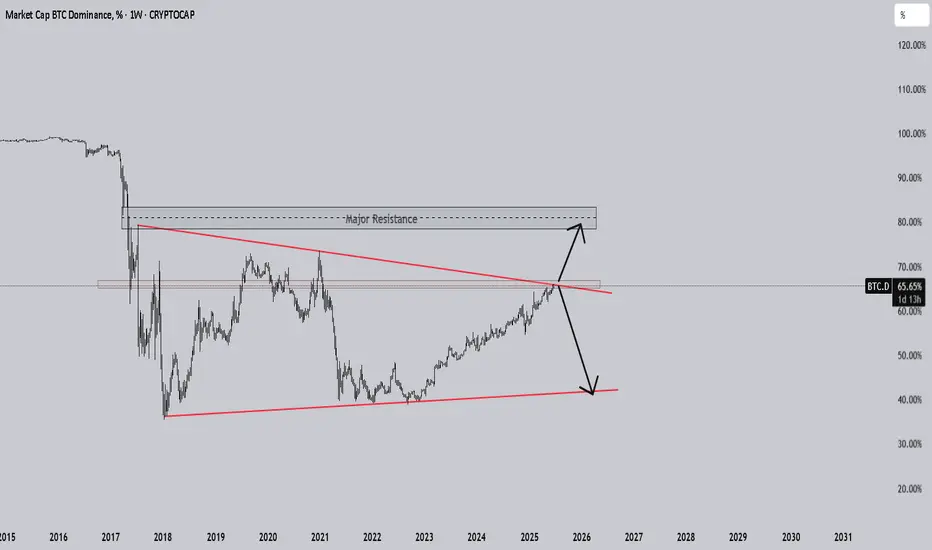
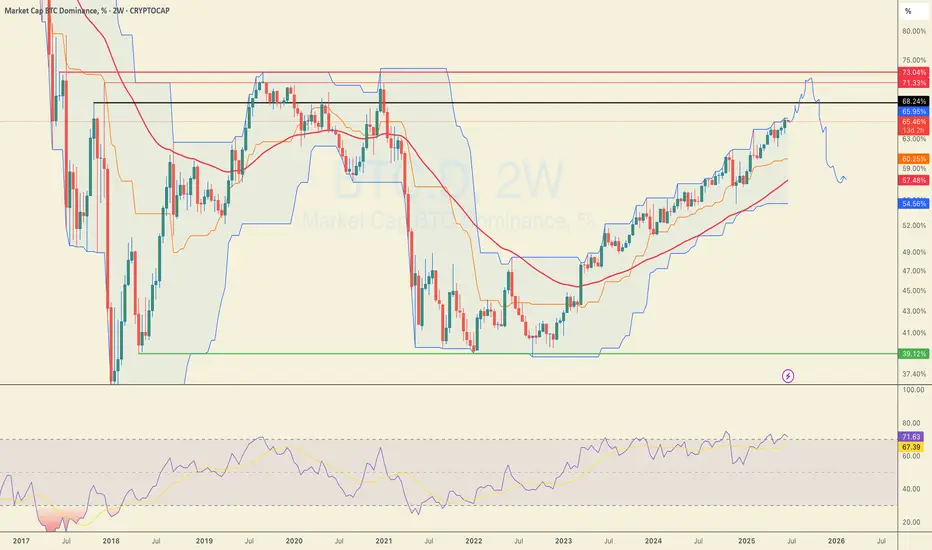
Bitcoin Dominance Is at the Edge and Fundamentals Are PushingCRYPTOCAP:BTC.D Bitcoin dominance (BTC.D) is pressing right into a massive multi-year trendline that has capped it since 2018. We have seen higher lows building since 2022, tightening this squeeze even more. Now it is decision time.
The fundamentals might just tip the scales.
David Sacks says July could be a huge month for crypto. Bakkt is lining up a 1 billion dollar shelf offering that could directly buy BTC. Meanwhile US regulators are pushing hard to finalize crypto market structure rules by September. On top of that, ETFs and big institutional players keep funneling money primarily into Bitcoin, not altcoins.
All this is fueling the case for a breakout in BTC dominance. If it happens, Bitcoin will likely outperform the rest of the market for a while, pulling more of the crypto share back into its hands.
If the chart rejects, we might see altcoins catch some wind and take the spotlight for a bit. But right now with this macro pressure building, the odds seem to favor Bitcoin leading the next leg.
Keep an eye on this chart. A clean breakout above the trendline could set the stage for a very Bitcoin-heavy next few months.
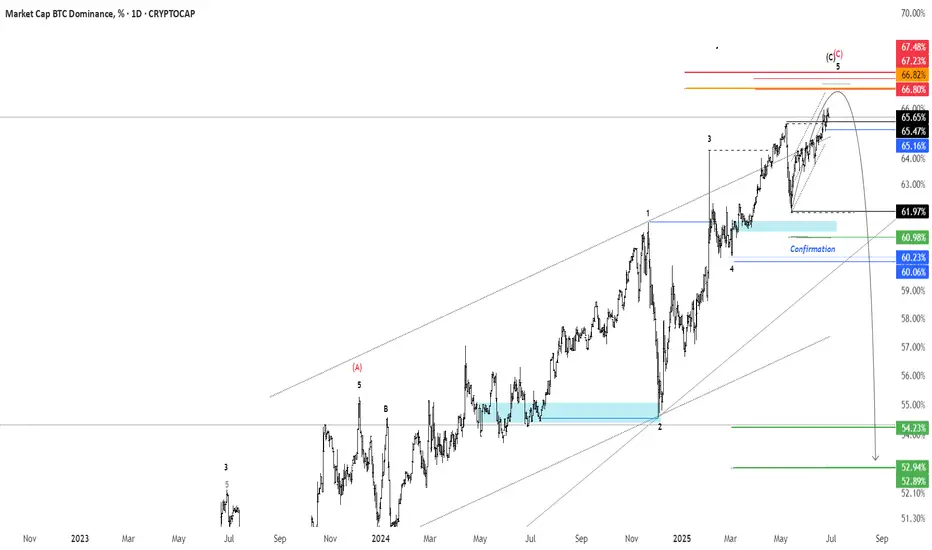
BTC.D - 1D Timeframereversal zone 66.8 : 67.2%
Confirmation : 60.23%
Targets : 52.94% / 31.03
invalid : 67.48%
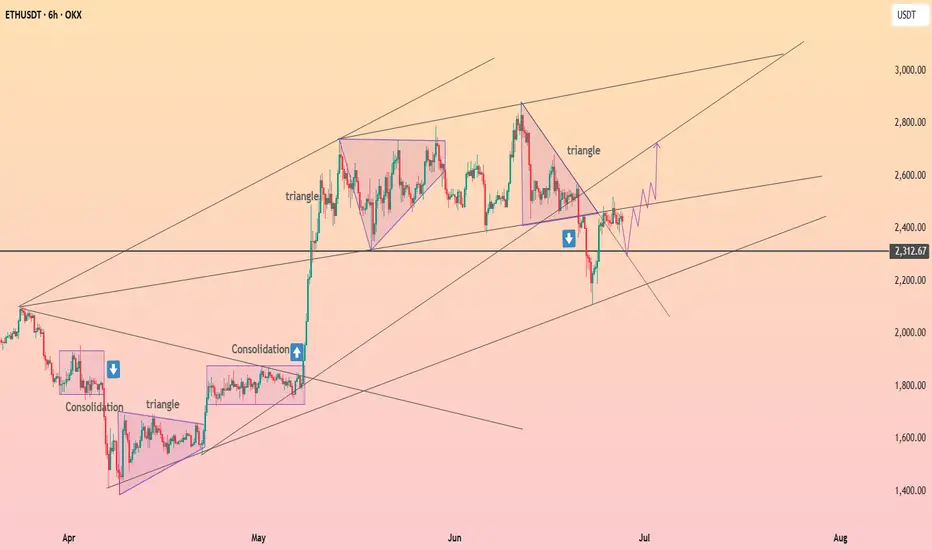
HolderStat┆ETHUSD trying to break through the resistanceBINANCE:ETHUSDT has confirmed a triangle breakout above the 2,312.67 level and is forming a bullish staircase structure. The chart shows a history of breakout rallies from similar formations, and this current setup targets 2,700+. Maintaining higher lows is essential for follow-through.
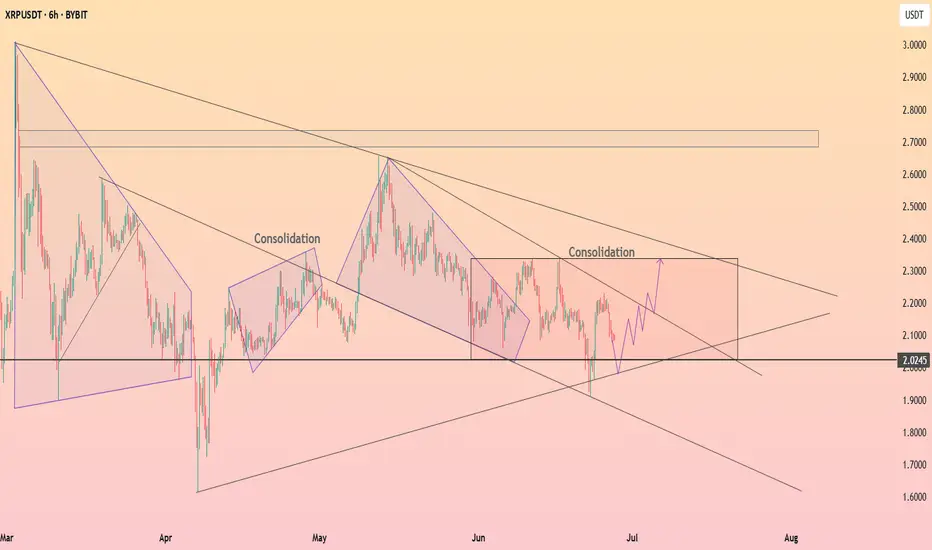
HolderStat┆XRPUSD consolidation of the assetBINANCE:XRPUSDT has bounced from the 2.02 level and is approaching the upper edge of a large consolidation structure. Multiple prior consolidation zones have led to breakouts, and the current bounce hints at continuation toward 2.30. A clean close above resistance would confirm bullish intent.
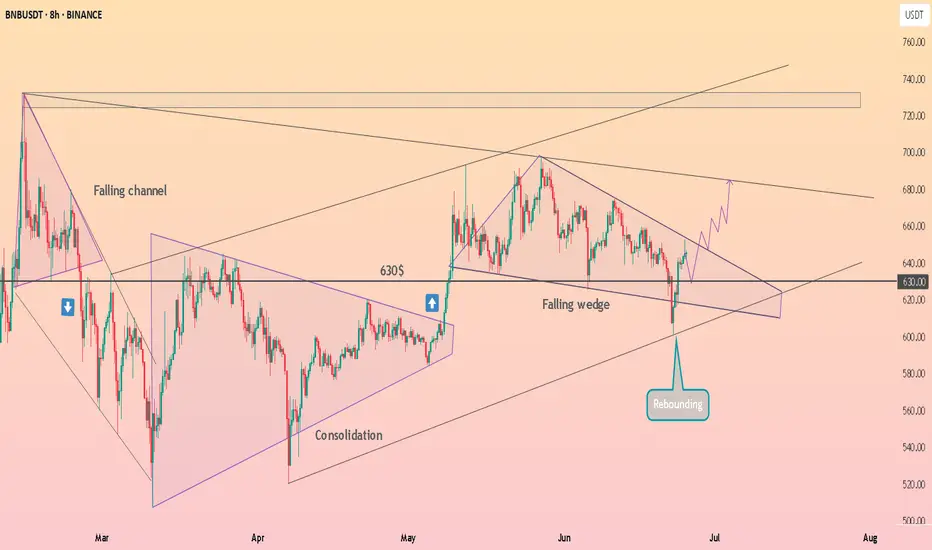
HolderStat┆BNBUSD forming the falling wedgeBINANCE:BNBUSDT on the 8h chart rebounded from a falling wedge and reclaimed the $630 support. Price structure shows growing strength as it aims for $680 next. Watch for a breakout confirmation to ignite a push toward $740.
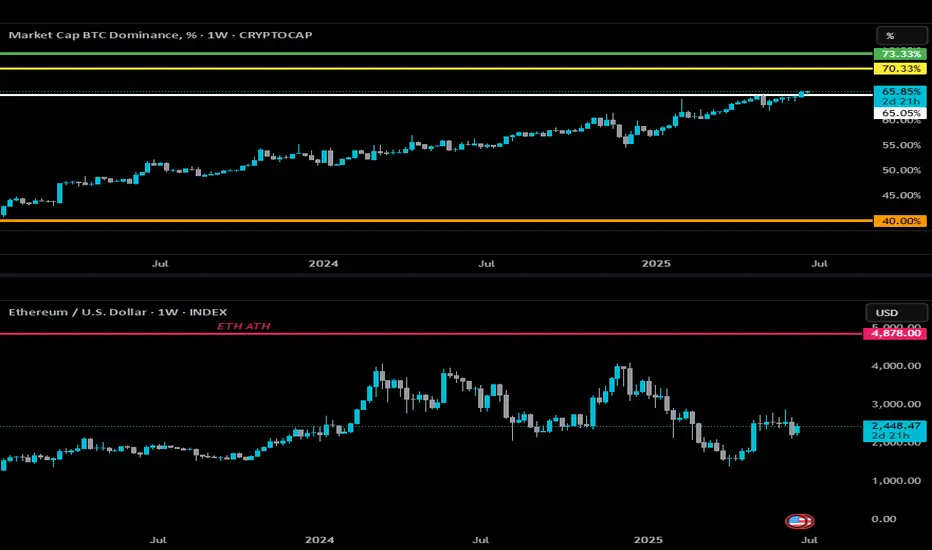
I'm having illusionsBTC.D is back at 65% (White Line) — same level we saw 5 years ago (5 years is a natural market cycle). In Dec 2020, it spiked to 73% (Green Line) before dipping hard... and that drop kicked off the last real Altseason.
BTC.D dipped to 40% by May 2021 (Orange Line)
ETH pumped +470% 🚀 in that window. A few months later in Nov '21, ETH hit its ATH of $4,878 (Pink Line)
Fast forward to now:
BTC.D is climbing into a historic 70% (Yellow Line) resistance zone (pre-alt era levels). I’ve set an alert for 69%, which is just below that pre-altseason rejection zone (69 is also a natural number, if you know what I mean)… so it’s a critical level to watch.
Despite Ethereum being criticized by some as a “relic,” its market capitalization is still vastly higher than the next-largest alt, XRP, by over $166.9 billion. That’s a huge footprint in the crypto space; it's still very much a market heavyweight IMO. ETH/USD likely to decline near term. Watch for a potential rebound by end of Q3.. #NFA
Not saying history will repeat... But if it rhymes again — I might turn off the charts for a night and go dancing!
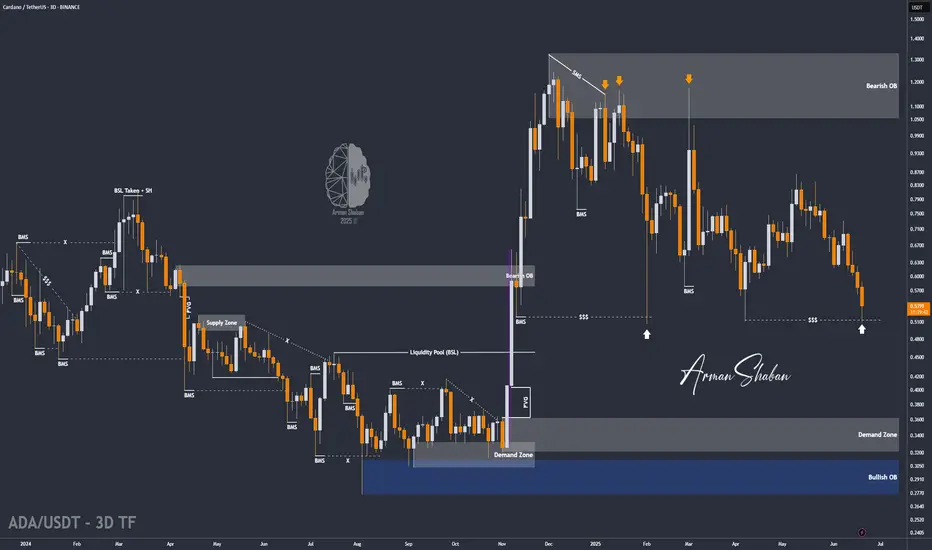
Cardano Correction or Opportunity? (READ THE CAPTION)By analyzing the #Cardano chart on the 3-day timeframe, we can see that after reaching 73 cents and amid rising war tensions, the price started a correction along with the broader crypto market. This correction has now brought ADA to attractive zones for potential laddered buying and long-term investment. Cardano is currently trading around 54 cents, and if the conflict continues, it may drop further, possibly below 45 cents.
Key demand zones are at $0.36, $0.45, and $0.52.
Short-term targets are $0.61 and $0.76, while long-term bullish targets are $0.93, $1.05, and $1.33.
Please support me with your likes and comments to motivate me to share more analysis with you and share your opinion about the possible trend of this chart with me !
Best Regards , Arman Shaban
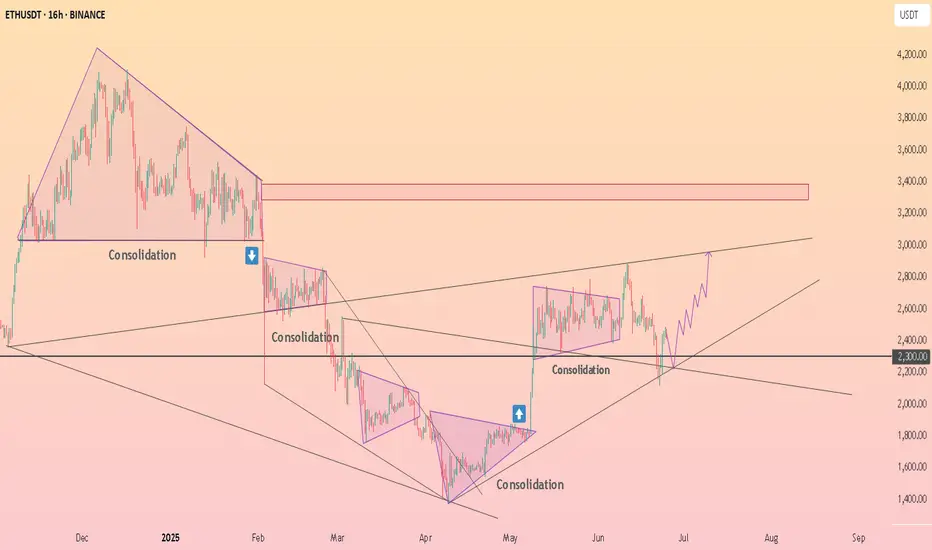
HolderStat┆ETHUSD formed the rising bottomBINANCE:ETHUSDT on the 16h chart is pressing upward inside a steep channel after reclaiming $2,300. Momentum is driving the price toward $2,800 and possibly $3,400. Previous breakouts from consolidation zones support the bullish bias.
HolderStat┆SOLUSD above the supportBINANCE:SOLUSDT reclaimed the $140 level after a wedge breakout and is now forming a stair-step recovery structure. The price is targeting the mid $150s with higher lows supporting the bullish thesis. Previous consolidations and wedge formations suggest buyers are regaining control. Continued strength above $140 reinforces the move.

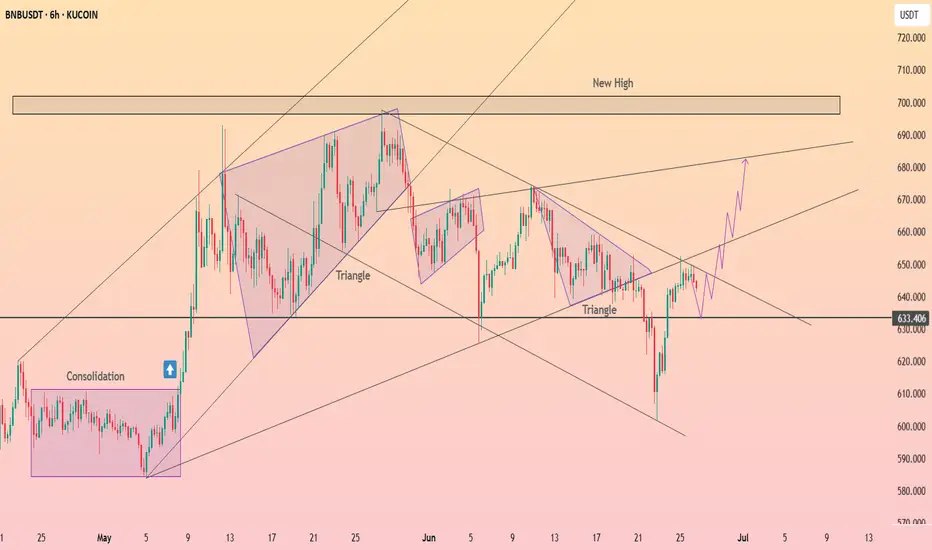
HolderStat┆BNBUSD retest of the channelBINANCE:BNBUSDT has completed a bullish reversal from the 633.4 level and is now testing upper trend resistance. A breakout from this wedge structure may lead to a rapid move toward the 680–700 region. Past triangle patterns have preceded strong rallies, and momentum indicators favor bulls. Traders will look for a breakout above 650 to confirm.
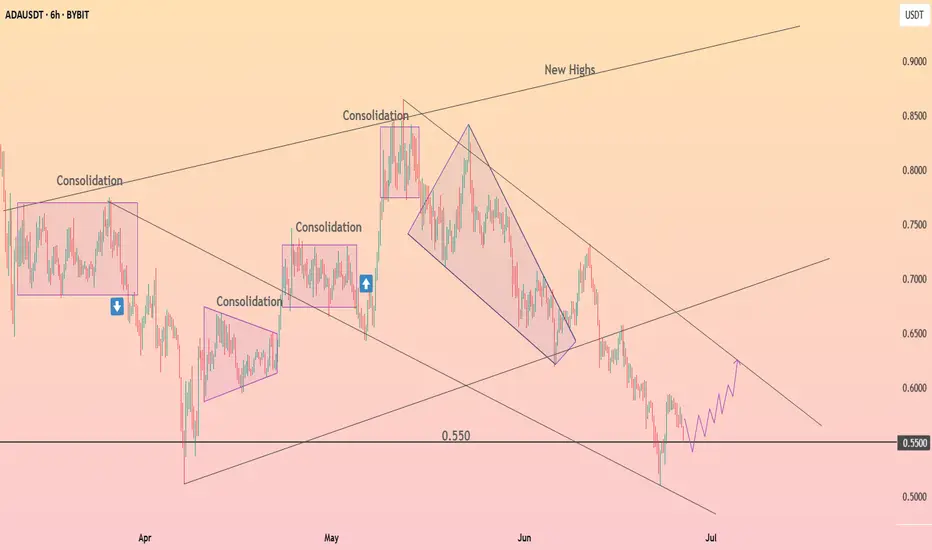
HolderStat┆ADAUSD retest of the supportBINANCE:ADAUSDT has bounced from the 0.55 support level, completing a falling wedge structure. The price now attempts to recover, with a visible bullish wave formation targeting the 0.62 resistance trendline. Multiple past consolidations have preceded breakouts, and if this pattern holds, a strong upside push is possible. Watch for confirmation of continued higher lows.
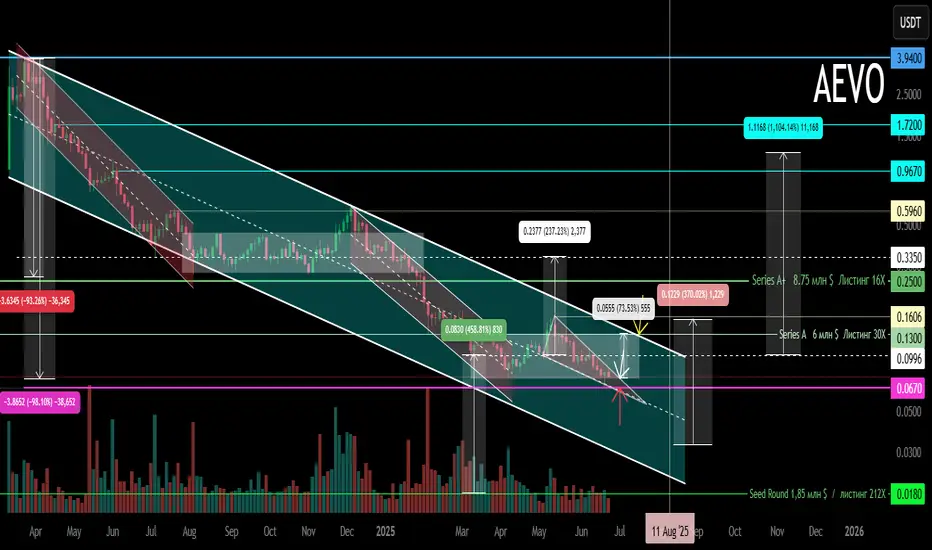
AEVO Main Trend DEX L2 Listing 212 X !) Decrease -98% 06 25Logarithm. Term 3 days.
Asset super hype in the past, listing with overly positive and aggressive marketing at 212X!
1️⃣Q1 2023 Private Seed $0.0185 / $1.85 million
2️⃣10 05 2023 Private Series A $0.13 / $6.01 million
3️⃣Q4 2023 Private Series A+ $0.25 / $8.75 million
4️⃣13 03 2024 Listing on the Binance exchange on the day of the secondary market trend reversal (I missed it, and it happens).
26 06 2025 now -98% decline after listing, which is 4.2X from the last prices of scammers, who gradually distributed, maintaining liquidity and the news background all this time their huge profit. Most of the coins are redistributed. You can think about collecting in this sideways, on a breakout of a local wedge (local trend), or on a breakout of a descending channel (reversal of the main trend).
Those who are far from trading can buy in equal parts (3 parts). From the position of the main trend and potential, the prices are now acceptable (you can buy the first part), so to speak (former "hype investors" are in wild horror).
Exit zones will be zones of previous consolidation, that is, those who previously bought on the hype will not be able to make a profit. In fact, it is always like this ... There are no “passengers”, then they will pump up well. As a rule, +800-1000% such assets of the previous excitement and such liquidity.
Local reversal zone.
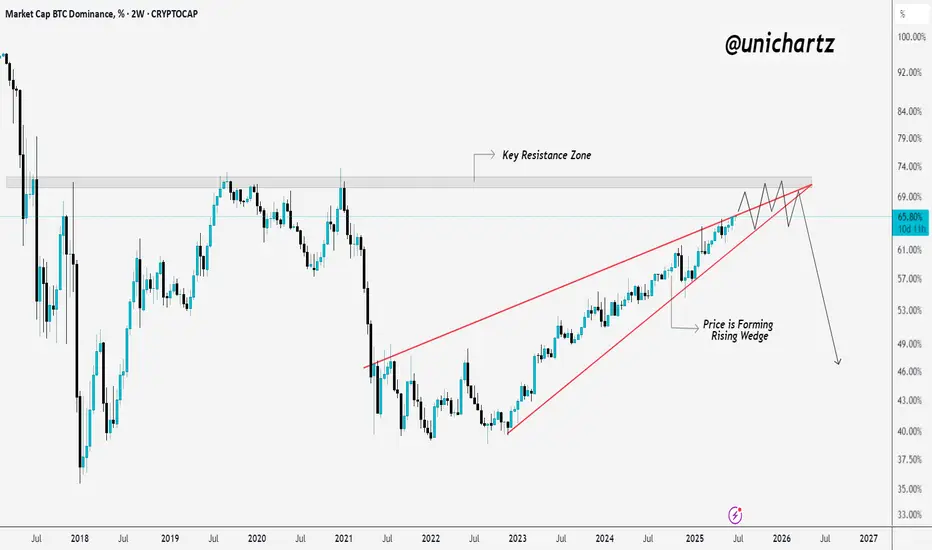
BTC Dominance Nearing Major Reversal Zone?Dominance has been grinding higher for months, but it's now walking into heavy resistance, and the structure looks like a rising wedge (not a great sign for bulls).
This setup often ends with a breakdown, which could be the spark altcoins are waiting for.
It’s not confirmed yet, but the chart’s starting to hint at a shift.
Watch closely, big moves usually follow tight squeezes.
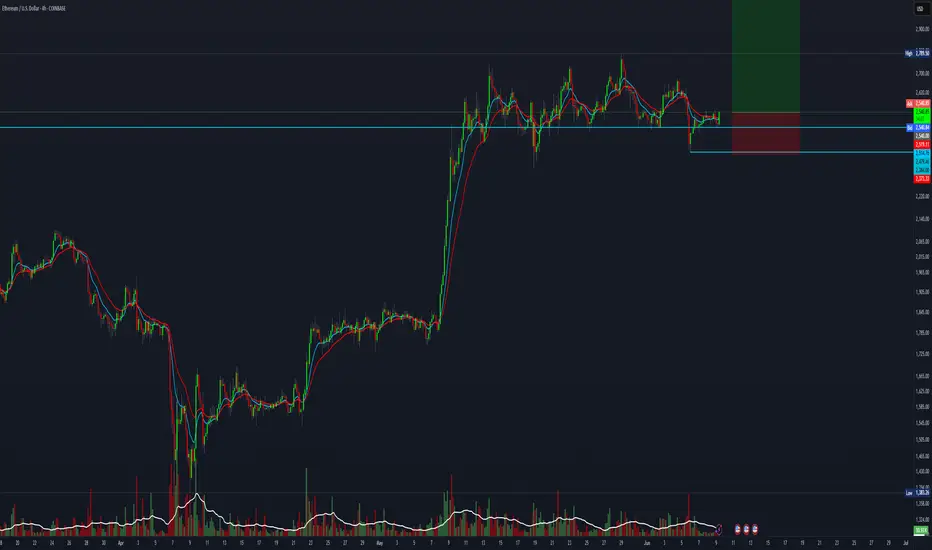
15 R:R setup for EthereumWe assume that this marks the beginning of a new uptrend for BTC. This setup offers an easy 15:1 risk-to-reward ratio.
Entry: 2534
Stop Loss: 2373.33
Target: 5000
This is for educational purposes only.
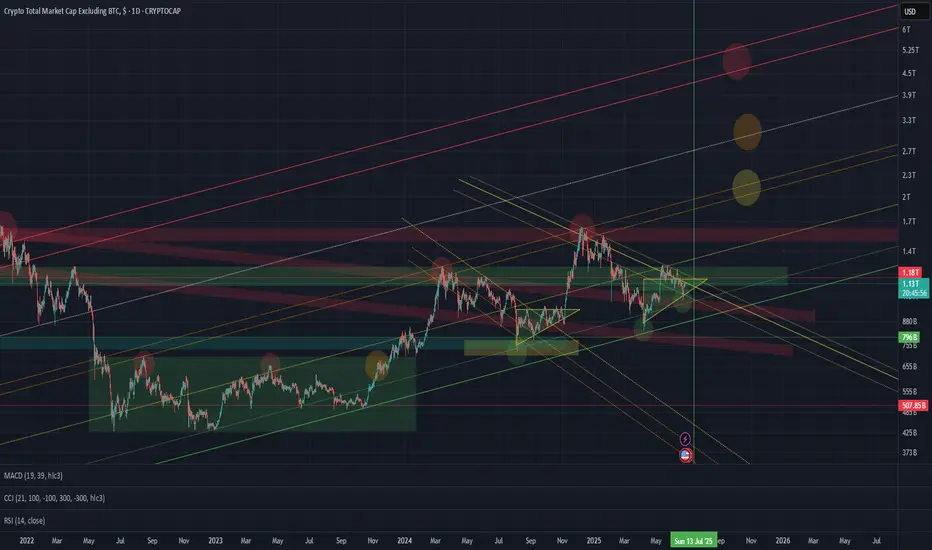
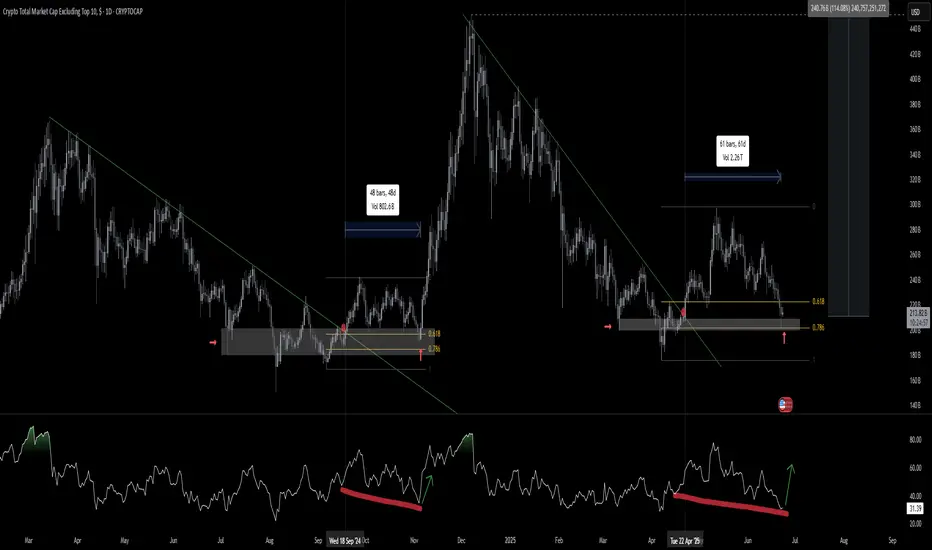
TOTAL2, TOTAL MARKET CUP without BTCTOTAL2, TOTAL MARKET CUP without BTC
Reasonable targets are within the yellow zone — these are high-probability levels based on current price action, volume, and market structure. They offer the best risk/reward and are ideal for primary take-profit planning.
Targets outside the yellow zone are still possible but come with higher risk. They typically require extended time, increased volatility, or external catalysts. These should be treated as secondary or speculative targets, best approached with reduced size or active trade management.
Summary:
Yellow zone = high probability, balanced risk/reward.
Beyond yellow = lower probability, higher risk, use with caution.
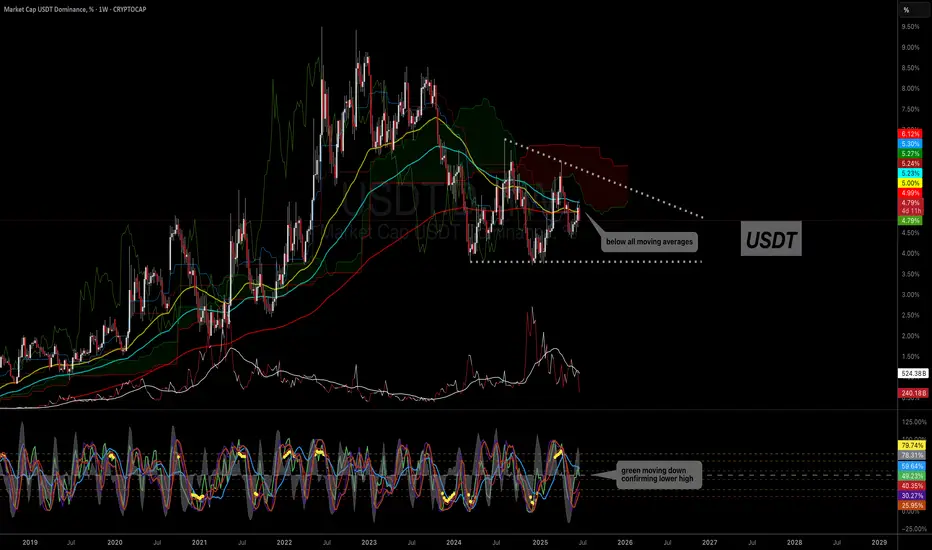
USDT - Hope AheadMorning my friends,
Figured I'd share a little bit of this USDT chart.
Deff showing a downtrend, even though our beloved coins are still suffering. Thats mainly because of BTC.D.
Once USDT moves lower, signaling a breakdown we should get a big relief, that if maybe paired with BTC.D moving lower as it is also near very strong resistance a bull market for alts will begin.
Keep an eye on this descending triangle breakdown.
Trade thirsty, my friends!
Altseason isn’t cancelled, it’s just delayed. Here's WHY!CRYPTOCAP:BTC Dominance Update:
Altseason isn’t cancelled, it’s just delayed.
The key zone to watch is 69.5%–73% dominance. That’s where we’re likely to see a strong rejection if it doesn't start soon, which seems unlikely given the current circumstances.
The longer it takes to reach that level, the stronger the altcoin rally will be once it hits.
This isn’t hope, it’s exactly what the charts are showing.
Historically, 70% dominance has acted as a major reversal zone.
If there are signs of reversal before this level, I'll let you know beforehand.
So follow me if you don't and share this chart with your crypto friends.
Do not forget to keep cash/stables!
Let me know what you think in the comments.
Thank you
#PEACE
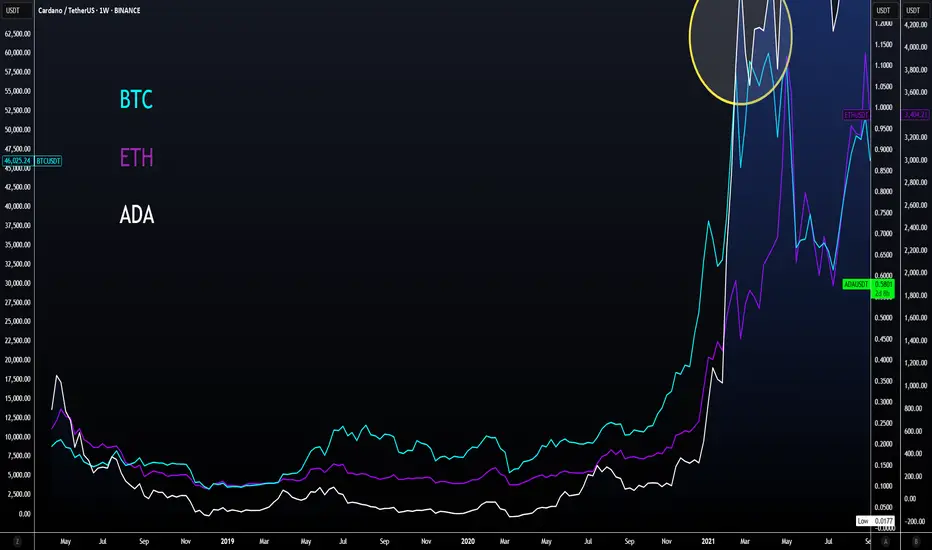
ADA | BTC | ET | Why ALTSEASON is COMING SOONAfter a -34% retracement, ADA is ready to go higher alongside with the rest of the alt market.
We see a very interesting phenomena here, were ADA also represents a large part of the larger alts: BTC pulls back, ETH is starting to increase or trades sideways (before the increase) whilst the alts dip.
This is actually BULLISH for alts, showing the very clear rotation between BTC, ETH and top 15 alts.
If we look at the macro of ANY of the alts I've been working through recently, a similar pattern appears - a clear bottom, followed by a sideways trade. This is usually the point just before the big ALTS season.
We actually see this pattern at the end of the 2018 rally, as well as after the 202- Covid dip:
The bottom line -
ADA and other alts are gearing up for their ALTSEASON. With patience, we will soon see some great gains across the markets.
Altcoin Season - Just around the corner!!!In this analysis I share my hypothesis on #OTHERS CRYPTOCAP:OTHERS as to why the big awaited alt season is right around the corner !
After analysing how the Trump mania season unfolded, I could see plenty of similarities:
1. Price filled the supply before the last retrace - gray rectangle
2. Then it broke the downtrend line and made a decent move up - red dot
3. Price correction to the 618 retrace on fib AND in the supply -> became demand from #1
4. RSI formed a hidden bullish divergence, marking a potential start of the rally
5. Time passed from #2 trendline breakout to the big impulse -> around 50 days
-> now we are around 60 days, which means more time to accumulate, bigger impulse
In an ideal scenario, the total OTHERS cap (all crypto excluding top 10) should at least reach the last high of 450 billions, and to pour some hopium, to around 600-700 billions...
So if you filled your bags around recent prices on your alts, you should expect at least 10-20x imo!
BNB Double Correction Hits Extreme ZoneBINANCE:BNBUSD has now entered the Blue Box buying area, signaling the final phase of the correction. A weekly reversal confirmation is the next key step — once that’s in place, the bounce phase is expected to begin.

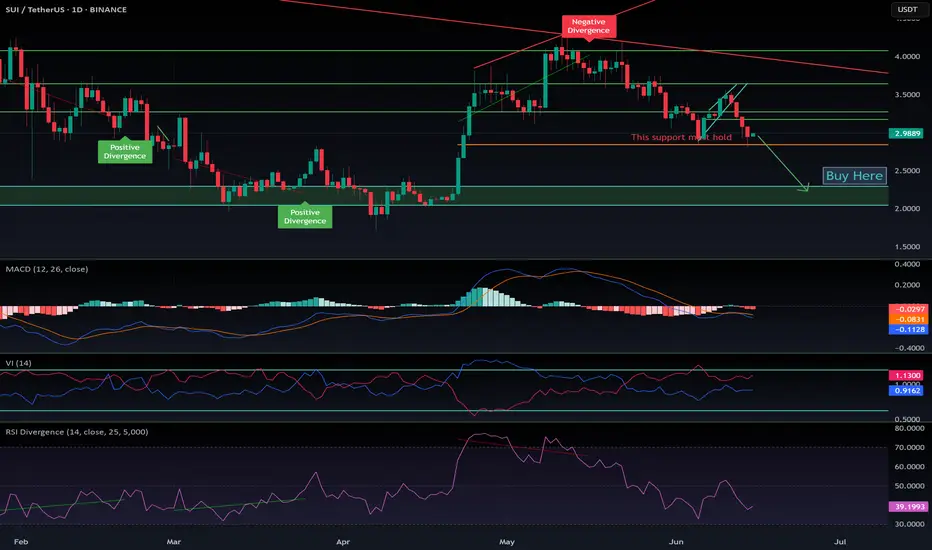
$SUI follow up for June 2025CRYPTOCAP:SUI has tapped my support zone around $2.85, which is currently holding well.
That said, the broader trend remains corrective, and it's likely only a matter of time before this support gives way.
If that happens, we could see a drop into my green buy zone — sitting just below a major order block. A break there might trigger heavy liquidations and a sharp move to the next support level.
I don't expect a deeper crash, as bulls are showing strong activity to defend this area.
If you set buy orders around this zone, a solid bounce could offer attractive profits.
As always, DYOR.
This is a follow up for this idea from May 2025
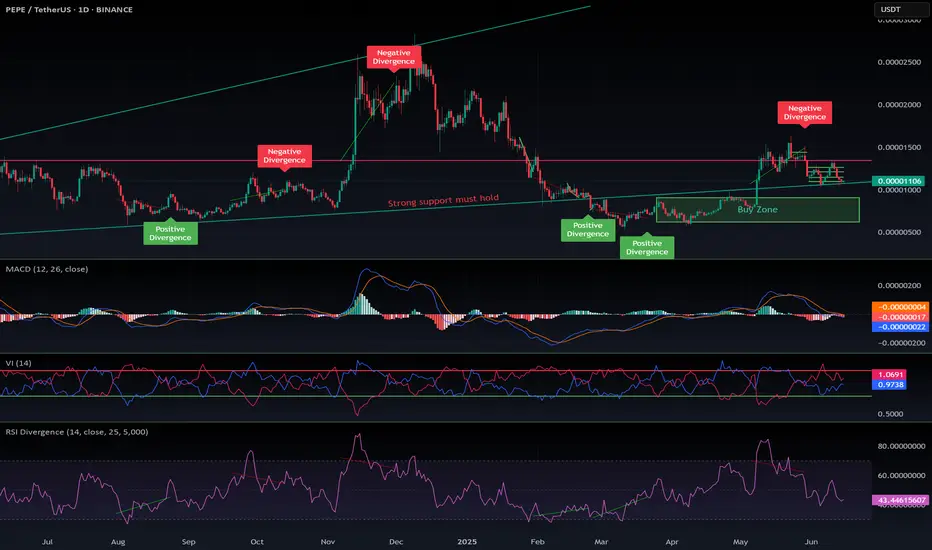
$PEPE follow up for June 2025Follow-up on my previous CRYPTOCAP:PEPE analysis — it played out exactly as expected.
CRYPTOCAP:PEPE remains my top meme coin, backed by some of the strongest tokenomics in the space. When altseason hits — if it hits — this one is primed to pump hard.
Like most altcoins right now, CRYPTOCAP:PEPE is in a short-term corrective pattern. That opens up another great opportunity to enter low and potentially ride a 2x or 3x move on the next leg up.
I’ve marked my usual buy zone. It may seem optimistic for now, but history shows how fast meme coins can dump… and then recover just as quickly. A drop into that green zone is entirely possible.
📲 Follow me for alerts — I’m monitoring CRYPTOCAP:PEPE daily. It’s one of my top picks.
DYOR.
Here was the previous analysis:
#PEPE #MemeCoin #Altseason #CryptoGems #BuyTheDip #Altcoins #CryptoTrading #Tokenomics #DYOR #CryptoAlerts